in the population sciences published by the Max Planck Institute for Demographic Research Doberaner Strasse 114 · D-18057 Rostock · GERMANY www.demographic-research.org
DEMOGRAPHIC RESEARCH
VOLUME 5, ARTICLE 7, PAGES 217-244
PUBLISHED 14 DECEMBER 2001
www.demographic-research.org/Volumes/Vol5/7/
DOI: 10.4054/DemRes.2001.5.7
Life expectancy in two Caucasian
countries.
Ruben Yeganyan
Irina Badurashvili
Evgueni Andreev
France Meslé
Vladimir Shkolnikov
Jacques Vallin
1 Introduction 218
2 Re-estimating populations 219
2.1 Georgia 219
2.2 Armenia 222
3 Taking in account under-registration of deaths 226
3.1 Problems in registration system 226
3.2 Infant mortality 227
3.3 Old age mortality 229
4 New estimates of mortality changes 231
4.1 The effect of population overestimation and death under-registration
231
4.2 Comparison with other countries of the ex-USSR 235
5 Conclusion 236
Notes 237
References 238
A I Annex I. Tables 240
Life expectancy in two Caucasian countries.
How much due to overestimated population?
(Note 1)Ruben Yeganyan1, Irina Badurashvili2, Evgueni Andreev3,
France Meslé4, Vladimir Shkolnikov5 and Jacques Vallin6
Abstract
This study is a first attempt to produce reliable estimates of mortality in Georgia and Armenia in the 1990s. Official statistics registered a decrease in mortality over the 1990s in spite of local wars, mass flows of refugees, and severe economic hardships faced by populations. According to official statistics, in 1999-2000 population size was about 5.4 millions in Georgia and about 3.8 millions in Armenia. Non-official estimates based on migration surveys are much lower: 4.0-4.1 millions and 3.0 millions, respectively. This huge difference is mostly due to unregistered out-migration.
In addition to corrections in population, corrections are made for under-registration of deaths. Hospital statistics is used for infant deaths and the Coale-Demeny model life tables are used for ages above 70.
In Georgia, the introduction of payment for the declaration of vital events resulted in a greater under-registration of deaths than in Armenia. Modified populations, mortality and life expectancy values are produced for the 1990s. In 1999 life expectancy was 68.6 and 75.6 for males and females in Georgia and 68.7 and 75.4 for males and females in Armenia. These figures are lower than the official estimates by 5.2 and 5.6 years for males and females in Georgia and by 3.8 and 1.7 years for males and females in
1 Economic Research Institute, Ministry of Finance and Economy, Republic of Armenia, Erevan.
Email: [email protected]
2 Georgian Centre of Population Research, Tbilisi. Email: [email protected]
3 Centre of Demography and Human Ecology at the Institute for Economic Forecasting, Moscow,
Email: [email protected]
4 Institut national d’études démographiques, 133 boulevard Davout 75980 Paris cedex 20, France.
Email: [email protected]
5 Max Planck Institute for Demographic Research, Doberaner Str. 114, 18057 Rostock, Germany.
Armenia. After corrections Caucasian male life expectancy is higher than in other post-Soviet countries.
1. Introduction
During the last years much of the demographic and epidemiological research was focused on changing patterns of health and mortality in the former Soviet Union. This increasing volume of research, however, was almost exclusively focused on Russia and Baltic countries. Much less attention have been paid to other former Soviet republics.
Before the collapse of the Soviet Union mortality patterns in Armenia and Georgia were quite different from those in Russia and Baltic countries. The former had substantially higher level of male life expectancy than the latter (about 68-69 years vs. 62-64 years in 1990). This difference was induced by male mortality rates at working ages, which were much higher in Russia or in Baltic countries than in Armenia or Georgia. There is a belief that this gap is attributable to special socio-cultural patterns typical for Caucasus and many other countries of Southern Europe.
Since the end of the 1980s the populations of the northern part of the former Soviet Union has experienced dramatic fluctuations in mortality. Surprisingly, official statistics of Caucasian countries registered a decrease in mortality over the 1990s in spite of local wars, mass flows of refugees, and severe economic hardships faced by Armenian and Georgian populations.
In 1989-90 male life expectancy at birth was 68.6 and 68.2 for Armenia and Georgia, respectively. Female life expectancy was 75.4 and 75.8, respectively. By the year 1998-99 these figures have increased significantly to 72.5 and 73.8 years for males and to 77.3 and 81.2 for females in Armenia and Georgia (Note 2, Note 3), respectively. There are, however, serious reasons to suspect these data (Badurashvili et al., submitted; Kingkade, 2000). Most importantly, in both countries a sharp increase in out-migration occurred in the 1990s. First, many Russians returned to Russia in the first years of independence. The migration out-flow has become even greater after 1991 due to socio-economic crisis and dramatic worsening of life conditions, which have become substantially worse than those in Russia. But the registration systems both in Georgia and Armenia failed to capture the scale of these flows. Consequently, official population numbers are over estimated while age structure less and less conforms to reality.
2. Re-estimating populations
Both Armenia and Georgia faced during the 90’s very important migration flows but in different ways linked to local situation and history. Let us look at them successively.
2.1 Georgia
At the end of the Soviet era the total population size of Georgia was 5.5 million. According to official sources the net out-migration from this country in the decade 1990-99 constituted about 220 thousand people. In reality, estimates of the number of people, who have left Georgia is very much undercounted. In addition to the dramatic changes which followed Independence, Georgia had to face two ethnic disputes: the claim for independence of South Ossetia (or Tskhinvali) and the Abkhazian war. The migration flows increased suddenly, not only because of the departure of Russians but also as direct or indirect consequences of these specific conflicts. Also, the territory actually controlled by Georgian government and the population covered by demographic statistics changed with the de facto separation of Abkhazia and part of Ossetia. Meanwhile, since 1989 the registration of migrations deeply deteriorated, and official statistics so largely underestimate real numbers that the total departures from Georgia are quite less than total immigrants from the country numbered in only Russia, which is far to be the only host country for Georgian migrants. According to Toma Gougoushvili, from 1990 until 1996, among 5.5 millions of inhabitants, Georgia would have lost 800,000 because of net emigration (Tsuladze and Badurashvili, 1999), and according to Giorgi Tsuladze, from 1990 till 1999, the losses would have reached 1.2 million (Tsuladze and Maglaperidze, 2000). Consequently, GCPR’s estimate for total
Georgian population at January 1st 1999 (Note 4) is 4.11 millions instead of 5.40
millions officially stated by SDSG, and CSS’ estimate for January 1st 2000 is 4.07
instead of 5.10 (without Abkhasia and Tskhinvali) according to official data (Note 5). These estimations are roughly corroborated by an national extrapolation of the results of the longitudinal household survey undertaken since 1996 by the SDSG in collaboration with the World Bank which gives 4.00 million population for mid-1999.
Taking in account the changes in the age structure of the population showed by this household survey, CSS produced new estimations of populations by five-year age groups for each year from 1990 to 2000 (Table 1).
official data give the numbers with and without these lost territories and in 2000 they give only the population without them. We can see that, in 1999, the difference of 1.3 million between official and estimated population is due to the underestimation of out migration by about 1 million and by near 0.3 million to the loss of Abkhazia and Tskhinvali territories.
Figure 1: Estimated trends in Georgian population as compared with official data,
1989-2000 (in millions)
Figure 2 compares the estimated age structure of 2000 Georgian population with the official data (without Abkhazia and Tskhinvali). As expected, the biggest differences appears at the ages between 5 and 40, since migration flows are much more important at these ages. There are still some differences at ages 40 to 65 but almost none after 65 and nothing at all below age 5. These differences are rather less for females.
4 4,2 4,4 4,6 4,8 5 5,2 5,4 5,6
1989 1991 1993 1995 1997 1999
Estimated
Official, total
Figure 2: Estimated age structure of Georgian population in January 1st 2000, as compared with official data (in thousands)
Of course this estimation will need to be confirmed by the next census which might be performed next year, but it allows us to try to produce right now better estimation of mortality rates.
In particular, it is striking to see at Figure 2 that the number of under-five-year boys is unexpectedly much higher than that of girls and we shall see that it will be the same for Armenia (Figure 4, below). At this age population numbers are very few dependant on migration (and migrations very few dependant on sex). The differences are only due to sex ratio at birth and mortality. In fact, in this case it seems to be due to an unusually high proportion of boys among births (see Annex 2). Reasons for such a phenomenon are not clear at all. This special topic should be treated elsewhere; however, it is not likely to bias too much our present estimations of mortality rates.
300 200 100 0 100 200 300
0-4 5-’9 10-’14 15-19 20-24 25-29 30-34 35-39 40-44 45-49 50-54 55-59 60-64 65-69 70-74 75-79 80-84 85+
Estimated population
Official data
2.2 Armenia
According to the 1989 census, Armenian population would have been 3.10 million inhabitants. However, to follow the same calendar as for the other Republics, this census was demanded by the USSR Goskomstat in spite of the objections of Armenian Government, while the country was shocked by the tragic earthquake which occurred in Spitak and its region in December 1988, and this result largely underestimated the real population. Indeed, the previous estimation founded on the 1979 census and vital and migration statistics gave 3.31 millions for 1988, 3.31 for 1989, and 3.35 for 1990. Taking in account these previous estimations and the results of the 1989 census for the regions where it was good, the Armenian Central Bureau of Statistics starts its new series of population numbers with a total population of 3.51 millions in 1990. In the absence of enough information on materials and methods used, we cannot evaluate the reliability of this estimation and we shall take it at this stage as the starting point of our reestimates for the 90’s.
From this point, as Georgia, Armenia faced a very difficult period. Not only the social and economical consequences of Independence and the transition to market economy were severe but the country was also involved in a war with Azerbaijan, about the status of Nagorny Karabach. A major consequence of these events was both a large out-migration flow, mainly of Russian population going back to Russia, and an also important in-migration of Armenian refugees escaping from Bakou or other places were they lived in Azerbaijan. Balancing these two contradictory flows, official statistics estimate the total net out-migration for the decade 1990-1999 to only 22.6 thousand people. In reality, estimates of the number of people, who have left Armenia is very much undercounted because a lot of them did not register their moves to outside.
Thus, according to data of the Aviation Department of the Government of Armenia in 1990-99 the total number of passengers leaving the country was higher than the number of arriving passengers by 630 thousand people. It is true that during the blockade years 1992-95 air transportation was almost the only connection between Armenia and outside world but before 1992 and since 1995 there were other means to leave Armenia and this figure is obviously understating of the real net out-migration. Another fact, indirectly confirming the absence of a substantial part of population is that by the end of the privatization of state property (in 1995) 650 thousand residents of Armenia had not taken their vouchers.
people from a representative samples of the total (official) population of Armenia. The
1995 survey, concerning a sample of 3100 households
,
focused on 1991-95out-migration and in-out-migration flows, and the 1999 survey (3600 households) on the same flows for the entire period 1991-98. In both cases, two questionnaires were used: a very brief questionnaire devoted to families, all members of which left Armenia was applied to the neighbors (number of family members, their sex and age), and a more detailed one for families in which at least one family member was still living in Armenia.
According to the results of these surveys, the cumulative net out-migration from Armenia in the 1990s was about 800 thousand people. Most of them left for Russia (about 60%-70% of the overall out-flow). Part of migrants went to other post-Soviet countries and to some western countries (USA). Based on the information collected on the age of the migrants and their year of leave, it has been possible to re-estimate year by year the total of the population by sex and, at the end of the period
(1st January 2000), the specific numbers by sex and age (Yeganyan and Davtyan, 2000;
Yeganyan, 2000).
According to the estimates, the size of the Armenian population at the beginning of the year 2000 was 3.0 millions while the official figure by the Armenian Bureau of Statistics is 3.8 millions. To evaluate the reliability of this re-estimation of the total of out-migration, we can use vital statistics collected in Russia on Armenians living in Russia. It is especially useful to compare the change in the number of Armenian deaths registered in Russia with the estimated flows of out-migrants from Armenia (Figure 3).
Figure 3 shows four curves of yearly changes since 1990 (in indexed values):
- number of deaths of Armenians registered in Russia,
- number of deaths of Russians registered in Russia,
- estimated population of Armenians in Russia taking in account all out-migrants
from Armenia,
- estimated population of Armenians in Russia taking in account 60 % of
out-migrants from Armenia.
Figure 3: Proportional changes since 1988 in the number of deaths of Armenians and Russians in Russia and in the size of Armenian population in Russia
Comparing the dynamics of the Armenian deaths in Russia to the estimates of Armenian population in Russia, we can clearly see that at the beginning of the period (1988-1991), deaths growth is more than that of Armenian population. This is due to the importance of the in-flow of Armenian refugees from Azerbaijan just before the Nagorny Kharabach war. On the contrary, since 1991, trends in Armenian deaths and population are rather similar. In fact there is a visible divergence during the years 1995-98, but the reason for the stabilisation in the number of deaths in spite of continuing out-migration from Armenia is due to the well known decrease in mortality in Russia during this period (Meslé et al. 2000). This comparison makes very plausible our estimates of Armenian out-migrations, and then, the new estimate of Armenian population trends.
1,0 1,5 2,0 2,5
1988 1989 1990 1991 1992 1993 1994 1995 1996 1997 1998 1999
Armenian population in Russia: if 100% of out-migrants go to Russia
if 60% of out-migrants go to Russia
Deaths of Armenians in
Russia
Deaths of Russians in
To produce annual population by age founded on these estimates and on the final age-structure already calculated above for the last year (2000), we first calculated the ratios of 2000 estimated population by age group to official numbers. Then, admitting a linear change in these ratios, from 1 in 1992 to their 2000 level, we apply interpolated ratios to the official annual numbers and then reduce or increase the results to reach the total population previously estimated.
Results are given in table-annex 2 below.
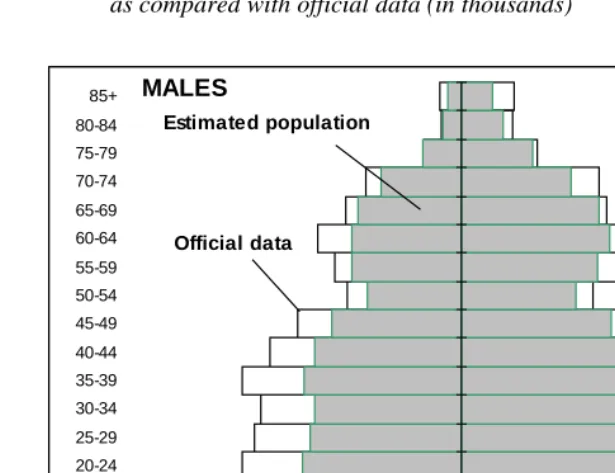
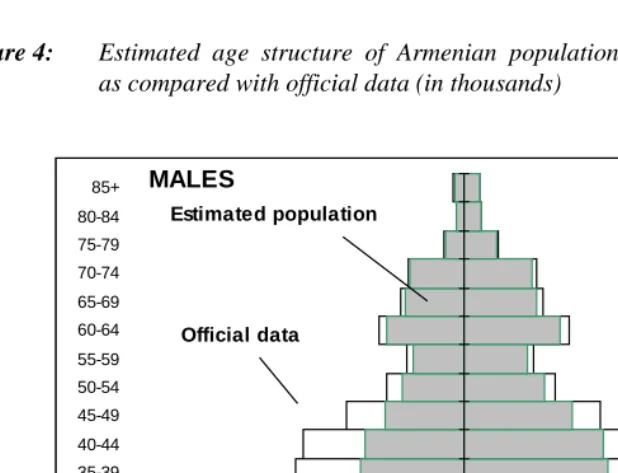
Figure 4 shows the 2000 estimated Armenian age pyramid as compared to the official figures.
As for Georgia, the differences between estimated and official figures are mainly concentrated on active age groups and more important for males than for females. Again, we can also see here the strikingly higher number of under-five-year boys as compared to girls (see Annex 2).
Figure 4: Estimated age structure of Armenian population in January 1st 2000,
as compared with official data (in thousands)
300 200 100 0 100 200 300
0-4 5-’9 10-’14 15-19 20-24 25-29 30-34 35-39 40-44 45-49 50-54 55-59 60-64 65-69 70-74 75-79 80-84 85+
Estimated population
Official data
3. Taking in account under-registration of deaths
Apart from the problem of denominator, we cannot exclude the possible effect of under-registration of deaths. Indeed, it seems that specific difficulties were recently encountered in this field, especially in Georgia. After comparison between different sources and between observed specific death rates by age group to model life tables, we finally had to make some correction for infant mortality and, at a lesser extent, for mortality at the oldest ages.
3.1 Problems in registration system
As far as registration problems are concerned, the situation is rather different in the two countries.
In Georgia, it appears rather clearly that a significant part of the total deaths fails to be registered and the problem seems to have got worse since the Independence. The Soviet system put constraints which were favourable to the completeness of the reporting but also gave people some advantages. The vanishing of these two factors and the introduction of a new rule requesting a payment for the declaration (the amount of the fee for the registration of a death is as high as that of a month of retirement pension !) seem to have worsened the under-reporting of deaths. As burials, especially in rural areas, can take place without a certificate, it seemed to us that this change could have produced an important reduction in the registration of death, at specific ages, especially among babies or, on the contrary, among elderly. On another hand, independently from the ZAGS (Note 6) records, thanks to information received from hospitals and other health centres by the Ministry of Health, it is clear that the registration of deaths below one year of age is not complete. Thus, in 1998, while the State Department of Statistics officially registered 710 deaths under age 1, the Ministry of Health numbered 1054 of them. Such an under-registration was already prevailing in the 80s. However, according to series from the Ministry of Health it has deteriorated since Independence.
Another difficulty of the Georgian situation is that, due to the Abkhasian war, vital statistics collection encountered some particular difficulties in 1993 and we do not know at what extent death registration coverage was affected this year.
under-registration prevails among rural population and the question must be examined for this country too.
3.2 Infant mortality
An evidence of the under-registration of infant deaths is given for both Georgia and Armenia, by simply comparing official statistics and special health data produced by Ministries of Health (Table 1). As expected, the problem is obviously more important in Georgia than in Armenia. Of course we have no proof that health data from the Ministries of Health are perfect (we may suspect some omissions) but it seems to us that it probably is much closer to the reality than official statistics. We decided to correct infant mortality rates by coefficients deduced from this comparison (Table 1 and Figure 5).
Table 1: Infant mortality rates according to official statistics and Ministry of
Health’s data, in Armenia and Georgia
Indicators 1990 1991 1992 1993 1994 1995 1996 1997 1998 1999
Armenia
Infant mortality rate (official statistics)
18.3 18.0 18.9 17.8 15.1 14.2 15.5 15.4 14.7 15.7
Infant mortality rate (data of Ministry of Health)
20.0 20.8 23.2 22.1 19.0 17.8 18.8 20.1 19.3 18.1
Coefficient of correction
1.09 1.15 1.23 1.25 1.26 1.25 1.21 1.30 1.31 1.16
Georgia
Infant mortality rate (official statistics)
15.8 13.8 12.6 16.9 16.7 13.1 17.4 16.3 15.2 17.5
Infant mortality rate (data of Ministry of Health)
19.8 21.1 20.0 24.9 25.0 23.5 27.4 23.5 21.0 23.4
Coefficient of correction
Figure 5: Infant mortality rates according to official statistics and corrected on the basis of Ministries of Health data
According to these corrections, infant mortality rates were about the same in Armenia and Georgia at the beginning of the 90’s, whereas the official data showed a better situation in Georgia than in Armenia. In the same way, after 1992, it seems rather clear that infant mortality increased in Georgia while it was decreasing in Armenia. In the most recent years, however, the gap between the two countries narrowed again.
10 15 20 25 30
1990 1991 1992 1993 1994 1995 1996 1997 1998 1999 2000
Georgia, corrected
Armenia, corrected
Georgia, official
Armenia, official
3.3 Old age mortality
For both Georgia and Armenia, we compared mortality rates by age obtained on the basis of registered deaths and our population estimates to those of different model life tables. For these two countries, like in Russia and other countries of the ex-USSR, age structure of mortality is very atypical, demonstrating an exceptionally high mortality at working ages (even if this phenomenon is less prominent than in Russia itself). However, at the young ages (except infant mortality) and among the oldest, mortality might fit to the models if death registration was complete.
Due to very different relative levels of mortality at young, middle and old ages, there is no model mortality schedule which would enable us to fit the observed mortality rates for the whole range of ages. Therefore, we decided to apply a very approximate approach by comparing Georgian and Armenian mortality patterns with several model life tables of the Coale and Demeny sets (1982) at similar levels of overall life expectancy. Our corrections of mortality at old ages, based on comparisons with model life tables, can not be considered exact. This is only one reasonable version of such correction.
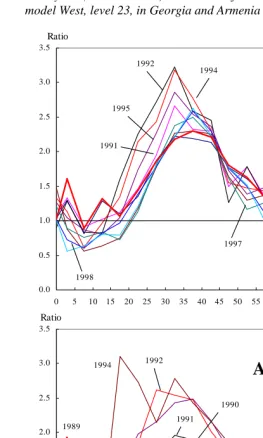
We found that, for the year 1989, both Armenian and Georgian mortality at ages 70+ fit rather well with the model life table corresponding to the actual level of infant and child mortality (as corrected here above). The best fit was with model West level 23 which we finally took in reference for adjusting mortality at old ages. Indeed, for the successive years in the 90’s, at the older ages, mortality rates are less than expected from the model. This is specially true for males in Georgia (Figure 6).
In this case of Georgian men, the deterioration was growing till 1993 about. So, we adopted correction coefficients for the years 1993-1999, adjusted from mean ratios observed for the period: 1.2 for age 70-74, 1.35 for age 75-79, 1.45 for age 80-84 and 1.5 for age 85 and over. For the years 1991 to 1992, we then interpolated correction coefficients for the same age groups assuming that no correction was needed for 1989 and 1990.
Figure 6: Relative difference between observed male age-specific mortality rates of each year (1990 to 1999) and those of Coale and Demeny life table, model West, level 23, in Georgia and Armenia
0.0 0.5 1.0 1.5 2.0 2.5 3.0 3.5
0 5 10 15 20 25 30 35 40 45 50 55 60 65 70 75 80 85
Ratio
Georgia
1989 1992
1994
1995
1991
1997 1999
1996 1998
0.0 0.5 1.0 1.5 2.0 2.5 3.0 3.5
Ratio
Armenia
1989
1994 1992
1993
1999
1998 1997
1996
1995
1991
For Armenia, the deviation from the model life table at the older ages is less pronounced (Figure 6). At age 70-74, it is almost negligible except for the year 1993, where observed mortality is higher than in the model, which is not unrealistic in the context of the war. However at the upper ages, the deviation from the model is growing with age, which probably indicates an under-registration of deaths at the oldest ages. For these reasons, we decided to keep constant, for each year, the relative difference with the model after the age 70-74, at its level at this age.
4. New estimates of mortality changes
After all these corrections mortality rates were used to produce life tables for each year from 1990 to 1999, for each sex and both countries. The results are significantly different from the official data. They also change substantially the comparison that one can do with other countries of the former Soviet Union.
4.1 The effect of population overestimation and death under-registration
Final correction of the population at risk and numbers of deaths results in decrease of life expectancy at birth in 1999 by 3.8 years for males and 1.7 year for females in Armenia and by 5.2 and 5.6 years in Georgia, correspondingly. Revised values of life expectancy at birth are: 68.7 years and 75.4 years for males and females in Armenia, respectively, and 68.6 and 75.6 in Georgia, respectively (Table 2).
The greatest part of the correction is due to the re-estimation of populations, but correction of deaths also produces considerable modifications. In Georgia, for example with new estimates of population, in 1999, male life expectancy is 3.6 years less than with official data while the correction of deaths decreases life expectancy by an additional 1.7 years. Figure 7 displays the divergence with time between official data and successive corrections.
Table 2: Change in life expectancy at birth in the 90’s according to official data, re-estimated populations and after correction of numbers of deaths
Year Males Females
I II III I II III
Armenia
1989 69.11 69.11 68.70 74.99 74.99 74.82
1990 69.18 69.18 68.64 76.07 76.07 75.73
1991 69.03 68.87 68.37 75.73 75.68 75.16
1992 67.92 66.93 66.44 75.00 74.63 73.94
1993 67.61 65.60 65.00 74.66 73.86 73.46
1994 68.56 65.76 65.09 76.41 75.40 74.91
1995 69.61 66.93 66.02 76.12 75.06 74.50
1996 70.02 67.41 66.42 76.14 75.15 74.55
1997 71.25 68.74 67.35 76.74 75.80 74.74
1998 72.46 70.06 68.31 77.28 76.38 75.29
1999 72.50 70.30 68.69 77.10 76.21 75.36
Georgia
1989 68.13 68.13 68.13 75.98 75.98 75.98
1990 68.90 69.04 68.73 76.44 76.50 76.23
1991 68.92 69.22 68.23 76.68 76.87 75.72
1992 69.00 69.04 67.76 76.84 76.89 75.25
1993 68.23 67.44 65.84 76.23 75.59 73.58
1994 70.76 69.11 67.28 78.52 76.98 74.79
1995 72.64 70.29 68.11 80.60 78.32 75.77
1996 74.84 71.67 69.29 82.44 79.27 76.55
1997 74.67 71.02 69.02 81.32 77.87 75.55
1998 74.19 70.16 68.34 82.00 77.98 75.76
1999 73.81 70.22 68.59 81.16 77.63 75.57
Figure 7: Trends in life expectancy at birth since 1989 according to official data and successive corrections for population and deaths
The remarkable difference in the importance of the correction between sexes in Armenia reflects the fact that net out-migration from this country involved much more men than women, whereas it seems that in Georgia this flow was more balanced.
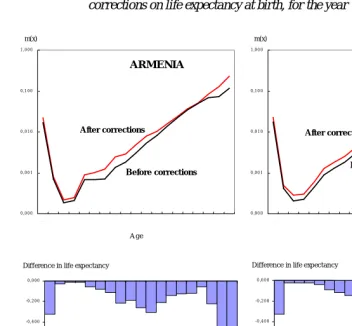
Figure 8 compares males age specific mortality rates before and after correction and the impact of these corrections on the estimation of life expectancy at birth, for the year 1999. Corrected mortality curve is significantly different from the non corrected one at the older ages in both countries and we can clearly see here to what extent the corrected values are more reliable than the uncorrected ones, since they fit much better with the expected increase of mortality with age. This difference is obviously due to the corrections in death numbers. The impact of population re-estimation is more concentrated on adult ages, especially in Armenia. In Georgia, however, the correction of population numbers shows certain anomalies, since the corrected mortality curve is more fluctuating between ages 50 and 70 than the initial one.
63 65 67 69 71 73 75 77 79 81 83
1 98 9 19 90 19 91 1 99 2 19 93 19 94 19 95 1 99 6 19 97 19 98 1 99 9 M ALES
FEM ALES
Official d ata Official d ata
W ith re-es timated p o pu latio n
W ith co rrected d eath s
W ith re-es timated p o pu latio n W ith co rrected d eath s
L ife exp ect an cy at birt h
AR MEN IA
63 65 67 69 71 73 75 77 79 81 83
19 89 1 990 1 99 1 1 99 2 19 93 1 994 19 95 1 99 6 1 99 7 19 98 19 99
W ith re-es timated p o p u latio n Official d ata
Official d ata W ith re-es timated p o p ulatio n
W ith co rrected d eath s
M ALES FEM ALES GEOR GIA
W ith co rrected d eath s
Figure 8: Age specific mortality rates before and after correction, and impact of the corrections on life expectancy at birth, for the year 1999
m(x)
0 ,0 0 0 0 ,0 0 1 0 ,0 1 0 0 ,1 0 0 1 ,0 0 0
A ge
B e fo re corre ctions A fte r corre ctions
ARMENIA
m(x)
0 ,0 0 0 0 ,0 0 1 0 ,0 1 0 0 ,1 0 0 1 ,0 0 0
A g e
G EO RG IA
A fte r corre ctions
B e fore corre ctio ns
Differen ce in life exp ectancy
-1 ,4 0 0 -1 ,2 0 0 -1 ,0 0 0 -0 ,8 0 0 -0 ,6 0 0 -0 ,4 0 0 -0 ,2 0 0 0 ,0 0 0
A ge
ARMENIA
Differen ce in life exp ectan cy
-1 ,4 0 0 -1 ,2 0 0 -1 ,0 0 0 -0 ,8 0 0 -0 ,6 0 0 -0 ,4 0 0 -0 ,2 0 0 0 ,0 0 0
A ge
The lower panel of Figure 8 displays the specific amount of reduction in life expectancy at birth corresponding to these changes in age-specific mortality rates. In both countries, the re-estimation of infant mortality plays a certain role, since it decreases life expectancy at birth by more than 0.3 year but the main effect is provided by the correction of mortality rates at the older ages, especially in Georgia, where the only correction of the rate at the age 85+ reduces life expectancy by 1.3 year. However, in the total, correction made at the active ages is the most important: the correction of the mortality rates between the ages 15 and 75 reduces life expectancy at birth by 1.9 year in Armenia and 2.6 in Georgia, while the correction at the upper ages reduces it by 1.6 and 2.3 respectively.
4.2 Comparison with other countries of the ex-USSR
Figure 9 compares the corrected trends in life expectancy of Armenia and Georgia with some other countries of the former Soviet Union: Russia, Ukraine, Lithuania and Latvia.
Figure 9: Corrected trends in life expectancy at birth in Armenia and Georgia
compared with some other countries of the ex-USSR
55,0 60,0 65,0 70,0
1989 1991 1993 1995 1997 1999
Armenia G eorgia
Russia Latvia
Ukraine Lithuania
MALES
65,0 70,0 75,0 80,0
1989 1991 1993 1995 1997 1999
Russia Georgia
Armenia
Latvia
Ukraine Lithuania
Even after correction, the levels of Caucasian male life expectancy remains substantially higher than those of the other ex-Soviet countries. However, they follow better the shape of the general trends, with a decrease in the early 90’s followed by an improvement after 1994, especially in Armenia. In the case or Armenia, it seems that the dramatic events including the consequences of the Spitak earthquake and Nagorny Kharabach war had not more influence on mortality trends than the common history of the whole ex-USSR. The case of Georgia is less similar to the rest of ex-USSR, since the only marked deterioration occurred in 1993, and could be explained by the Abkhazian war. Nevertheless, all these countries, including the two Caucasian ones, are in 1999 back to their levels of 1989.
The situation of Caucasian countries is rather different for women than for men. Contrary to the latter, the former are not in a better position than the rest of ex-USSR countries. But also they seem much less affected by the big fluctuation which characterises Russia and other northern republics.
5. Conclusion
Notes
1. Paper presented at the Helsinki, June 7-9 European Population Conference-2001
Theme C: Health, morbidity and mortality.
2. These values are computed from official populations and deaths (Tsuladze and
Maglaperidze, 2000).
3. Since 1993 indicators for Georgia do not cover the territory of Abkhazia and part
of South Ossetia. These regions are de facto not under the Georgian authority since the early 1990s.
4. Excluding Abkhazia and Tskhinvali region (South-Ossetia).
5. GCPR is the Georgian Centre for Population Research, SDSG is the State
Department of Statistics of Georgia, and CSS is the Centre for Social Studies.
References
Badurashvili Irina, McKee Martin, Tsuladzé Giorgi, Meslé France, Vallin Jacques, and Shkolnikov Vladimir, (submitted). – Where there are no data: what happened to life expectancy in Georgia since 1990? European Journal of Public Health. (Submitted for publication).
Coale Ansley and Demeny Paul, 1983. – Regional model life tables and stable
populations. – New York et Londres, Academic Press, 496 p. (Deuxième
édition).
Karapetyan S.A., Eganyan R.S., and Shakhnazaryan N.V. 1996. – Migratsiya
naseleniya Armenii za postsovetskiy period (1991-1995). [Migration of the
Armenian population during the post-Soviet period (1991-1995)]. –Erevan, UNFPA, 31 p.
Kingkade W. Ward, 2000. – Caucasian old age mortality: the case of Armenia. – Washington, US Census Bureau, 10 p. + tab. p. (paper presented at the Annual Meeting of the Population Association of America, Los Angeles, March 2000).
Meslé France, Vallin Jacques, and Shkolnikov Vladimir, 2000. – Reversal of mortality
decline : the case of contemporary Russia. World Health Statistics
Quarterly/Rapport Trimestriel De Statistiques Sanitaires, vol. 51, n° 2-3-4,
p. 191-206.
Miller Barbara D., 1996. – « Changing equality : the politics of sex selective abortion in Asia », in : IUSSP Committee on Anthropological Demography and Centre for Developpement Studies (éd.), Seminar on socio-cultural and political aspects of
abortion in a changing world, Kovalam, Trivandrum, India, 25-28 march 1996,
15 p. – Liège, UIESP, pagination multiple.
Tsuladze Giorgi and Badurashvili Irina, 1999. – The Demographic Yearbook of
Georgia 1998. – Tbilisi, Georgian Centre of Population Research, 92 p.
Tsuladze Giorgi and Maglaperidze Nika, 2000. – Demographic Yearbook of Georgia
1999. – Tbilisi, Centre for Social Studies, 90 p.
WHO Mortality Database http://www.who.int/whosis/mort/download.htm
Yeganyan Ruben S. and Davtyan L.M. 2000. – Vneshnemigratsionnaya situatsiya
Armenii. [Armenian situation with external migration]. – Erevan (Materials of
Yeganyan Ruben S., 2000. – Demografitcheskiye realii i perspektivi RA na poroge
21-go veka. [Demographic realities and perspectives of Armenia at threshold of
the 21th century]. – Erevan (Materials of the scientific seminar "Demography of Armenia between two centuries", Dilijan, 2000).
Yeganyan Ruben S. and Shakhnazaryan N.V. 1999. Issledovaniye
vneshnemigratsionnikh protsessov RA 1991-1998. [Study of the processes of
Annex I. Tables
Table Annex 1: Estimation of Georgian population by age groups from
January 1st 1990 to January 1st 2000 (in thousands)
Age 1990 1991 1992 1993 1994 1995 1996 1997 1998 1999 2000 Males
-1 46.1 46.6 44.6 36.3 31.2 29.3 28.8 27.6 27.5 26.0 25.4 1-4 188.8 182.7 175.5 161.8 141.6 130.5 120.9 112.2 105.7 104.5 103.4 5-9 228.3 224.1 218.5 204.7 182.1 170.8 161.3 152.7 146.9 145.3 141.7 10-14 219.0 219.7 218.9 209.6 190.6 183.0 177.0 171.7 169.3 167.4 162.1 15-19 214.2 214.1 212.6 202.8 183.9 175.9 169.3 163.7 160.8 159.0 159.4 20-24 202.2 201.1 198.7 188.6 170.1 161.9 155.1 149.2 145.7 144.1 143.7 25-29 225.4 220.4 214.2 199.7 177.0 165.3 155.2 146.4 140.2 138.6 136.6 30-34 204.1 201.2 197.0 185.3 165.6 156.1 148.1 140.9 136.3 134.8 132.4 35-39 178.8 181.5 183.0 177.3 163.2 158.5 154.9 151.8 151.3 149.6 142.1 40-44 139.0 143.7 147.6 145.3 136.0 134.2 133.1 132.3 133.7 132.2 133.0 45-49 120.7 125.2 129.0 127.4 119.5 118.1 117.5 117.2 118.6 117.3 117.8 50-54 170.7 162.5 153.4 138.6 118.7 106.8 96.4 87.0 79.3 78.4 84.8 55-59 136.3 137.2 137.2 131.9 120.5 116.1 112.6 109.6 108.5 107.3 99.3 60-64 136.2 136.0 135.0 128.8 116.7 111.6 107.5 103.8 102.0 100.9 99.7 65-69 65.8 73.6 81.0 84.8 83.7 86.7 89.8 92.9 97.3 96.3 93.9 70-74 36.8 44.0 51.0 55.5 56.7 60.2 63.9 67.3 71.7 71.0 72.4 75-79 33.7 34.2 34.6 33.6 31.0 30.2 29.5 29.0 29.0 28.7 34.7 80-84 18.4 18.9 19.3 19.0 17.7 17.4 17.2 17.0 17.1 17.0 17.0 85+ 10.4 11.0 11.6 11.6 11.1 11.2 11.3 11.4 11.7 11.6 12.2 Total 2574.9 2577.7 2562.7 2442.6 2216.9 2123.8 2049.4 1983.7 1952.6 1930.0 1911.6 Females
Table Annex 2: Estimation of Armenian population by age groups from
January 1s 1989 to January 1st 2000 (in thousands)
Age 1989 1990 1991 1992 1993 1994 1995 1996 1997 1998 1999 2000
Males
0 37.5 38.3 40.4 38.7 32.4 26.2 22.7 21.9 22.0 20.5 18.8 17.7 1-4 144.7 160.1 156.6 153.5 141.1 131.8 122.4 111.5 100.6 92.4 87.3 82.8 5-9 160.8 187.8 193.2 193.1 180.9 172.0 165.9 165.7 165.3 162.2 156.4 146.5 10-14 136.8 164.6 168.7 169.3 159.9 155.9 157.0 161.4 165.1 167.9 168.7 165.9 15-19 132.2 149.4 152.0 149.0 138.0 131.8 130.4 132.3 135.0 136.7 139.0 140.9 20-24 131.8 141.0 141.0 137.2 124.6 115.9 111.0 109.8 109.2 108.8 108.6 107.7 25-29 159.8 159.2 152.3 141.5 121.5 107.2 99.1 95.1 92.0 88.9 85.6 81.3 30-34 137.9 152.1 160.7 155.4 136.9 121.0 109.6 99.3 92.4 84.8 78.1 72.0 35-39 103.7 111.9 117.9 119.5 113.1 111.1 109.9 112.1 109.8 105.6 99.8 93.0 40-44 59.0 75.8 85.5 87.7 83.8 80.7 81.1 82.4 84.1 86.0 89.3 89.6 45-49 64.4 56.8 49.8 48.6 49.0 52.2 56.1 61.5 64.6 67.3 69.3 71.6 50-54 83.3 89.9 89.4 83.1 67.7 54.9 44.7 38.8 39.1 43.1 49.4 55.4 55-59 74.4 71.8 71.3 73.1 69.8 69.7 72.4 72.3 69.3 62.3 54.2 45.9 60-64 56.0 72.2 76.2 73.8 67.1 61.4 57.0 57.1 59.8 62.0 65.8 70.5 65-69 19.6 30.0 35.4 43.5 48.1 52.7 54.7 58.2 57.4 56.9 55.2 52.6 70-74 12.3 14.3 14.4 15.1 16.0 17.4 21.6 25.6 32.1 38.9 45.8 48.6 75-79 12.8 15.0 14.3 13.3 11.5 11.0 9.9 10.0 10.8 12.0 13.2 17.2
80-84 7.1 9.1 9.1 9.0 8.8 8.6 9.3 9.4 8.9 8.2 8.4 7.6
85 + 4.3 5.5 5.8 5.8 5.8 5.7 5.5 5.8 6.2 7.1 7.7 9.0
Total 1538.4 1704.8 1734.0 1710.0 1576.2 1487.4 1440.4 1430.2 1423.7 1411.6 1400.7 1375.8 Females
Annex II. Questions about sex ratio at birth
As it appears at the figure-annex below, according to the WHO Mortality Database, registered sex ratio at birth has suddenly risen since the mid 90’s in the three Caucasian countries, while no changes are observed in the other countries of the former USSR. Especially we do not see any change in Central Asian countries like Uzbekistan, Tadjikistan, etc. To explain this change, it is necessary either to think of a real change or to refer to a worsening in the quality of registration. As far as the quality of registration is concerned, it would be necessary to assume that there is an advantage for a better registration for boys than for girls. It could be the case if families demonstrate a male preference. This assumption is however rather weak since it could better apply to countries like Tadjikistan, Kyrgyzstan or Uzbekistan, or even Azerbaijan than to Armenia or Georgia. It clearly appears here as a Caucasian phenomenon than a question of Muslim culture.
As far as the change in sex ratio at birth could be an actual fact, it is even more difficult to explain. Indeed it is theoretically possible to think of selective abortion in favour of males like it can be observed in some regions of India or China (Miller, 1996). However, it would be necessary to assume the emergence or re-emergence of a very strong male preference.
Figure Annex: Trends in sex ratio at birth in the three Caucasian countries as compared with some other countries of the former Soviet Union (source: WHO mortality data base)
0.90 0.95 1.00 1.05 1.10 1.15 1.20 1.25
1981 1982 1983 1984 1985 1986 1987 1988 1989 1990 1991 1992 1993 1994 1995 1996 1997 1998 1999
Year
Sex r
a
ti
o