M
ONIKAM
IKLASZEWSKA1, J
ACEKA. P
IETRZYK1, K
ATARZYNAZ
ACHWIEJA1,
D
OROTAD
ROŻDŻ1, P
RZEMYSŁAWK
OROHODA2, R
OMANR
UMIAN2, L
IDIAK
RAWENTEK2,
W
ŁADYSŁAWS
UŁOWICZ3, M
AREKS
ZYMOŃSKI4Evaluation of Nanostructure in Reused Cuprophane
and Polysulfone Dialysis Membranes
Badanie nanostruktury reutylizowanych kuprofanowych
i polisulfonowych błon dializacyjnych
1Dialysis Unit, Children’s University Hospital of Cracow, Poland
2Chair of Electronics, Academy of Mining and Metallurgy (AGH) Cracow, Poland
3Chair and Department of Nephrology, Jagiellonian University Medical School, Cracow, Poland 4Institute of Physics, Jagiellonian University, Cracow, Poland
Adv Clin Exp Med 2008, 17, 2, 173–182 ISSN 1230−025X
ORIGINAL SCIENTIFIC PAPERS
© Copyright by Silesian Piasts University of Medicine in Wrocław
Abstract
Background. Internal surface roughness, chemical profile, overall mass transfer (KoA), and ultrafiltration coeffi− cients (Kufr) of dialysis membranes are the main determinants of the biocompatibility and functional profile of every dialyzer.
Objectives. The aim of the study was to compare the surface nanostructures of cuprophane (CUP) and polysulfone (PS) dialysis membranes and their changes depending on the number of dialyzer reutilizations with peracetic acid (Renalin®), which is commonly used in dialysis units for this purpose.
Material and Methods. Surface roughness parameters (RMS, BR20%; BR80%) were measured by atomic force microscopy (AFM) for new CUP and after 1, 2, 3, 4, and 5 reutilizations and for new PS dialysis membranes and after 1, 3, 5, 7, and 10 reutilizations. Biocompatibility of the CUP and PS membranes was evaluated by measuring interleukin−6 and TNF−αserum concentrations measured in each of the studied hemodialysis sessions. HD sessions were performed in 10 chronically dialyzed subjects in whom dialyzer reuse was accepted.
Results.Internal and external surface roughness of the membranes disclosed an asymmetrical nanostructure of PS and a symmetrical of CUP. The increase in serum IL−6 concentration during the HD sessions with new CUP dia− lyzers and after 1, 2, 3, 4, and 5 reutilizations was statistically significant (p< 0.05) in each HD session while the increases of IL−6 concentration during the HD session with new PS dialyzers and after 1, 3, 5, 7, and 10 reutiliza− tions was not statistically significant in any HD session. Increases in TNF−αconcentration during HD session with new CUP dialyzers and after 1, 2, 3, 4, and 5 reutilizations and with new PS dialyzers and after 1, 3, 5, 7, and 10 reutilizations were not statistically significant in any HD session.
Conclusions.Reuse of dialysis membranes with peracetic acid does not affect their surface nanostructure. No cor− relation between the dialysis membrane surface roughness and biocompatibility was found (Adv Clin Exp Med 2008, 17, 2, 172–182).
Key words: cuprophane dialysis membrane, polysulfone dialysis membrane, nanostructure, dialyzer reuse, bio− compatibility.
Streszczenie
Wprowadzenie. Szorstkość wewnętrznej powierzchni, skład chemiczny tworzywa, współczynnik przepuszczalności błonowej (KoA) i współczynnik ultrafiltracji (Kufr) błon dializacyjnych można uznać za główne wskaźniki bio− zgodności i charakterystyki czynnościowej dializatorów.
Cel pracy.Porównanie nanostruktury błon kuprofanowych (CUP) i polisulfonowych (PS) oraz ocena wpływu wie− lokrotnej reutylizacji kwasem nadoctowym (Renalin®) dializatorów z nich wykonanych.
Hemodialysis (HD) remains the dominant form of renal replacement therapy, both in Poland and in other developed countries in the world. In Poland, almost 14,000 patients on HD were report− ed in 2006, which represents 90% of all patients with CRF [1]. The dialysis membrane is the deci− sive factor of the efficacy and biocompatibility of chronic HD therapy and determines the quality and success of the whole therapeutic process. Depending on their chemical composition, con− temporary dialysis membranes are divided into three groups: 1) unmodified cellulosic, 2) modi− fied cellulosic, and 3) synthetic membranes. Semi− permeable dialysis membranes, imperfect in their structure and function, and the extremely high costs of chronically applied HD remain very seri− ous obstacles to improving hemodialysis adequa− cy. Dialyzer reuse is one way of lowering HD costs and has been applied in clinical practice since the very beginnings of hemodialysis therapy.
In past decades there was the very popular opinion that multiple dialyzer use does not con− tribute any negative consequences, reduces treat− ment costs, and may also bring some benefits for dialyzed patients. It was postulated that consecu− tive use of the same dialysis membrane is benefi− cial for the patient because of protective proteins which are absorbed on its internal surface. Correlations between dialysis membrane nanos− tructure and the patient’s body reactions have not yet been the subject of study. Attention was drawn to correlations between the dialysis mem− brane’s surface roughness and its degree of bio− compatibility, described as the thrombocyte adhe− sion index to the membrane surface, for the first time in 1999 [2]. Anecdotal suggestions in scien− tific literature that a membrane’s surface rough− ness (expressed as the root mean square, RMS) may closely correlate with its biocompatibility and that employing atomic force microscopy (AFM) and studies of the capillaries’ surface nanostruc− ture were expected to provide novel proofs con−
cerning the membrane’s physical characteristics related to this phenomenon.
The aim of the study was to compare the sur− face nanostructures of two types of dialysis mem− branes, i.e. cuprophane (CUP) and polysulfone (PS), and assess their changes depending on the number of dialyzer reutilizations. Comparison of surface nanostructure parameters of the given dial− ysis membranes and biocompatibility markers expressed as IL−6 and TNF−α serum concentra− tions was performed as well.
Material and Methods
Patients
Ten patients took part in the study, including five end−stage renal disease patients treated with HD at the Dialysis Unit of the Chair and Dept. of Nephrology, Jagiellonian University Medical School, and five ESRD children treated with HD at the Dialysis Unit of University Children’s Hos− pital in Cracow. Informed consent of the patients and approval of the Jagiellonian University ethical commission were obtained before the study began.
Dialyzers
The two most commonly used types of dialyz− ers, those made of cuprophane (CU, low−flux Bellco NT 1375 in pediatric patients) and of poly− sulfone (PS, low−flux Fresenius F7, F8 in adult patients), were used in the study. A total of 60 dia− lyzers (30 CUP and 30 PS) were used.
Reuse of Dialyzers
Both CUP and PS dialyzers were reused auto− matically using the Renatron RS 8300 machine (Renal Systems, Minneapolis, USA) according to the manufacturer’s guidelines [3]. The reuse
−krotnie i polisulfonu 1−, 3−, 5−, 7−, 10−krotnie. Biozgodność oceniono, oznaczając w surowicy stężenie interleuki− ny 6 i TNF−αpodczas każdej sesji hemodializacyjnej. Badania przeprowadzono u 10 przewlekle dializowanych chorych, którzy akceptowali wielokrotne użycie dializatorów.
Wyniki. Badania nanostrukturalne potwierdziły symetryczną budowę błony kuprofanowej i asymetryczną – błony polisulfonowej. Reutylizacja kwasem nadoctowym nie wpłynęła w istotny sposób na zmianę szorstkości badanych błon. Przyrost stężeń IL−6 podczas dializ na nowych i reutylizowanych dializatorach kuprofanowych był istotny statystycznie dla każdej krotności. Nie obserwowano tego skutku podczas dializ wykonywanych na dializatorach polisulfonowych. Zmiany stężeń TNF−αbyły nieistotne statystycznie zarówno w odniesieniu do rodzaju błony, jak i krotności reutylizacji.
Wnioski. Reutylizacja kwasem nadoctowym nie wpływa na nanostrukturę i nie poprawia biozgodności błon dia− lizacyjnych, zarówno kuprowanowych, jak i polisulfonowych. Stężenia tych markerów nie korelują ze wartościa− mi wskaźników szorstkości błon poddawanych reutylizacji (Adv Clin Exp Med 2008, 17, 2, 173–182).
process was performed with Renalin® (Renal Systems, Minneapolis, USA) [4]. The LAL test was used to control the bacteriological cleanliness of the reverse osmosis water for rinsing the dia− lyzer. During the reuse process a post−priming vol− ume (PPV) was defined for each dialyzer. A PPV value lower than 80% of the FBV (fiber bundle volume) disqualified a dialyzer from further clini− cal use, according to Gotch’s guidelines [5].
Membrane Surface
Nanostructure Evaluation
with AFM
The dialysis membranes’ surface roughness parameters were measured by atomic force microscopy (AFM) using new dialyzers and after subsequent reuse (1, 2, 3, 4, and 5 times for CUP and 1, 3, 5, 7, and 10 times for PS). Evaluation of the dialysis membranes’ nanostructures was per− formed with an atomic force microscope (Thermo− microscopes Autoprobe CP). Seven fibers were randomly selected in each dialyzer on which 14 surface images were performed (7 of the internal and 7 of the external surfaces). These images of the CUP fibers were collected using the contact AFM mode. Images of the internal surfaces of the PS fibers were collected with contact AFM mode and those of the external surfaces with the non− contact AFM mode. Altogether, 420 surface images were collected (210 images of the internal and 210 of the external surface) of the CUP and PS capillaries. Cumulatively, 840 AFM images of capillaries’ were obtained.
Surface Roughness
Parameter Analysis
Evaluation of the characteristic features of the dialysis membranes with AFM consisted of mea−
suring and comparing the parameters describing the surface properties recorded as an AFM image [6]. In the present study, these were the RMS (root mean square) values corresponding to surface roughness and the bearing ratio (BR, the height over the plane defined by the xand ycoordinates in three−dimensional space for which the given percentage of all pixels in the AFM image have values greater than or equal to that value), described by the equation:
zi– the i−thobservation within the sample,
z
– – sample mean,
n – number of observations within the sample, n – 1 – degrees of freedom (the number of independent observations that may be used to cal− culate the given statistics).
Variable Coefficient
and Dynamic Changes
Coefficients
A variable coefficient and dynamic change coefficients were applied to obtain a detailed esti− mation of the changeability in the membranes’ surface roughness.
Variable coefficient– the ratio of the standard deviation of the roughness parameter (RMS, BR 20%, BR 80%) to its arithmetic mean value, i.e. V% = SD/mean ×100.
Dynamic changes coefficients:
– change rate – the ratio of the absolute
increase (AI) in the RMS observed in the consec− utive dialyzer reutilizations to the values observed for the new membrane (N), i.e. CR% = AI/N × 100%,
– fixed base index– the ratio of the RMS val− ues observed in the consecutive dialyzer reutiliza− tions (R) to the values observed for the new mem− brane (N), i.e. FBI% = R/N×100%.
Dialysis Membrane
Biocompatibility Assessment
Blood samples of 1.5 ml each were drawn from the arterial lines before staring the HD ses− sion to assess both IL−6 and TNF−αlevels and then after 90 and 120 minutes of HD. IL−6 concentra− tions were determined with an immunoradiometric assay (IRMA) using an Interleukin−6−IRMA kit (Biosource International) [7]. The radioactivity measurements were performed using a Wallac
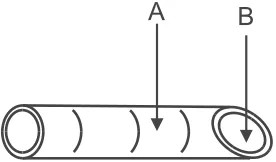
Fig. 1.Schematic presentation of a single capillary section to show its internal and external surface avail− able to the AFM cantilever tip: A – external capillary surface, B – internal capillary surface
Ryc. 1.Schematyczny obraz przecięcia pojedynczej kapilary w celu udostępnienia powierzchni wewnętrz− nej dla ostrza mikroskopu sił atomowych: A – po− wierzchnia zewnętrzna, B – powierzchnia wewnętrzna
RMS =
√
1∑
(z – z–)2 nn
1470 WIZARD® automatic scintillation gamma counter (PerkinElmer, USA). TNF−α concentra− tions were determined with an immunoenzymatic assay (ELISA) using a Tumor Necrosis Factor−
α CB ELISA (TNF−α CB) kit (Biosource International) [8]. Sample absorbance measure− ments were performed with a single−wave method using a 650−nm filter in a Universal Microplate Reader Elx800NB automatic microplate reader (BIO−TEK Instruments, Inc.).
Statistical Analysis
The results of the two studied dialyzers groups, CUP and PS, were analyzed for small sam− ples with equal variances with Student’s t test. Differences in IL−6 and TNF−α concentrations during dialysis on new cuprophane dialyzers and after 1, 2, 3, 4, and 5 reutilizations and on new polysulfone dialyzers and after 1, 3, 5, 7, and 10 reutilizations were analyzed with Student’s t test for small dependent samples. Comparison of the internal surface roughness parameters of the CUP and PS membranes with IL−6 and TNF−αconcen− trations obtained from consecutive dialyzer use are presented as Pearson’s correlation coefficient. The level of statistical significance for each calculation was p < 0.05. Statistical analysis was performed with STATSDIRECT STATISTICAL SOFT− WARE v. 2.3.8.
Results
The symmetrical external and internal surfaces of the single CUP capillary are presented in Figs.
2a and 2b. The symmetrical structures of the PS capillary are shown in Figs. 3a and 3b. The AFM technique allows spectacular viewing of the differ− ences.
Dialysis Membrane
Nanostructure Evaluation
– Roughness Parameters
(RMS, BR 20%, BR 80%)
Analysis of the RMS, BR 20%, and BR 80% values of the CUP and PS membranes’ internal and external surfaces (Figs. 4–7) shows that, except for dispersion of significant results and after eliminating the extreme values, there were no crucial changes in roughness of the two mem− branes after consecutive dialyzer utilizations and that there was a very close correlation of all the evaluated parameters (RMS, BR 20%, and BR 80%).
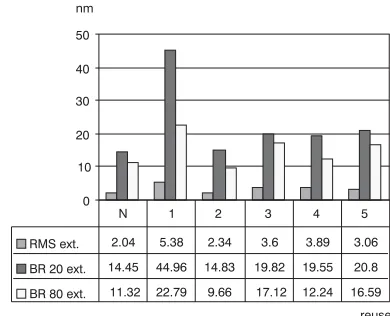
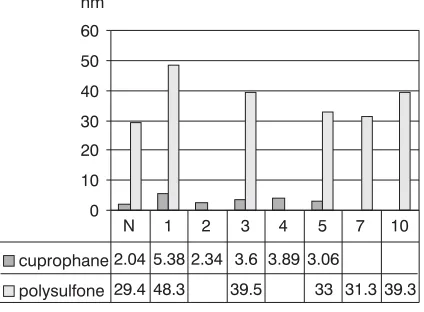
The roughness parameters of the PS internal surface (mean RMS: 8.7 nm) demonstrated greater roughness than those of the internal CUP surface (mean RMS: 4.1 nm). Analysis of the external sur− face roughness parameters of the CUP and PS membranes shows much greater roughness (poros− ity) of the PS membrane (mean RMS of the exter− nal surface: 36.8 nm) than of the CUP membrane (mean RMS of the external surface: 3.4 nm; Figs. 8, 9).
Variable Coefficient (V%)
The mean RMS value of the CUP mem− brane’s internal surface was 4.2 nm, (range: 1.1–12.5 nm). There was very high diversity in the
Fig. 2.CUP: a – symmetrical membrane, internal surface (AFM), b– external surface (AFM), authors’ ownership
Fig. 3. PS: a – asymmetrical membrane, internal surface (AFM), b – external surface (AFM), authors’ ownership
Ryc. 3. Polisulfon, przykład błony asymetrycznej: a – obraz powierzchni wewnętrznej, b – obraz powierzchni zewnętrznej (badania własne autorów)
Fig. 4.CUP, mean values of RMS, BR20%, and BR80% of the internal surface
Ryc. 4.Kuprofan, średnie wartości RMS, BR 20%, BR 80% – powierzchnia wewnętrzna
0 10 20 30 40
reuse RMS int. 4.23 3.52 2.97 2.94 6.86 4.32
BR 20 int. 27.9 15.1 17.5 23.6 35.1 21.7
BR 80 int. 21.3 11.9 12.9 20.6 24.4 16.4
N 1 2 3 4 5
nm
Fig. 5. CUP, mean values of RMS, BR20%, and BR 80% of the external surface
Ryc. 5.Kuprofan, średnie wartości RMS, BR 20%, BR 80% – powierzchnia zewnętrzna
0 10 20 30 40 50
reuse RMS ext. 2.04 5.38 2.34 3.6 3.89 3.06
BR 20 ext. 14.45 44.96 14.83 19.82 19.55 20.8
BR 80 ext. 11.32 22.79 9.66 17.12 12.24 16.59
N 1 2 3 4 5
nm
Fig. 6.PS, mean values of RMS, BR 20%, and BR80% of the internal surface
Ryc. 6.Polisulfon – średnie wartości RMS, BR 20%, BR 80% – powierzchnia wewnętrzna
0 10 20 30 40 50 60
reuse
RMS int. 7.26 9.84 7.93 8.08 10.69 8.42
BR 20 int. 34.54 54.4 37.77 40.56 56.55 45.25
BR 80 int. 22.96 36.16 25.88 27.95 39.2 30.86
N 1 3 5 7 10
nm
Ryc. 7.PS, mean values of RMS, BR20%, and BR 80% of the external surface
Ryc. 7. Polisulfon, średnie wartości RMS, BR 20%, BR 80% – powierzchnia zewnętrzna
0 100 200 300
reuse RMS ext. 29.4 48.3 39.5 33 31.3 39.3
BR 20 ext. 115 260 222 208 169 233
BR 80 ext. 94.2 188 155 155 122 163
N 1 3 5 7 10
nm
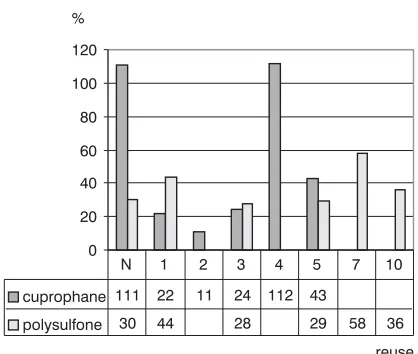
initial RMS parameters of the CUP membranes’ internal surfaces, the variable coefficient being as much as 111%. After consecutive reuse, the CUP membrane’s internal surface RMS was very unsta− ble, which was reflected by the variable coeffi− cient, which ranged from 11 to 112% after 5 reuti− lizations. The RMS values of new PS mem− brane’s internal surface were stable, ranging from 4.6 nm to 10.6 nm. The variable coefficient (V%) for this membrane was 30%. The maximal vari− able coefficient for the RMS of the internal PS membrane was 58% and the minimal 28% (Figs. 10, 11).
The data in Table 1 indicate that the mean vari− able coefficient (V%) for the RMS of the internal PS surface was 37.5% and that for the internal CUP surface was as much as 53.8%. Values of the variable coefficient for the RMS of the external surfaces of the studied membranes were analo−
gous, with that for the external PS surface being 25% and for the external CUP surface as much as 36.2% (Tab. 1, Figs. 12, 13).
Dynamic Changes Coefficients
Values of the change rate (CR%) after consec− utive reutilizations for all the observed roughness parameters (RMS, BR20%, and BR 80%) for the PS membrane were stable and predictable (mean CR% for the RMS of the internal surface: 31.4%, of the external surface: 31.5%), which confirms the great resistance of PS polymer to external clin− ical working conditions. For the CUP membrane the change rate was variable, unstable, and after consecutive reutilizations characterized by large ups and downs (mean CR% for the RMS of the internal surface: 99.9%, of the external surface: 91.3%), which confirms the lack of durability and
Fig. 8.CUP and PS, comparison of mean RMS values of the internal surfaces
Ryc. 8.Kuprofan i polisulfon, porównanie średniej wartości RMS dla powierzchni wewnętrznej
0 2 4 6 8 10 12
reuse cuprophane 4.23 3.52 2.97 2.94 6.86 4.32
polysulfone 7.26 9.84 7.93 8.08 10.69 8.42
N 1 2 3 4 5 7 10
nm
Fig. 9. CUP and PS, comparison of mean RMS values of the external surfaces
Ryc. 9.Kuprofan i polisulfon, porównanie średniej wartości RMS dla powierzchni zewnętrznej
0 10 20 30 40 50 60
reuse cuprophane 2.04 5.38 2.34 3.6 3.89 3.06
polysulfone 29.4 48.3 39.5 33 31.3 39.3
N 1 2 3 4 5 7 10
nm
Fig. 10.CUP, V% for RMS, BR 20%, and BR 80% of the internal surface
Ryc. 10.Kuprofan, wartość V% dla BR 20% i BR 80% dla powierzchni wewnętrznej
0 50 100 150
reuse RMS int. 111 22 11 24 112 43
BR 20 int. 141 51 41 86 120 44
BR 80 int. 125 28 57 112 113 55
N 1 2 3 4 5
%
Fig. 11.PS, V% for RMS, BR 20%, and BR 80% of the external surface
Ryc. 11.Polisulfon, wartość V% dla BR 20% i BR 80% dla powierzchni zewnętrznej
0 20 40 60 80
reuse RMS int. 30 44 28 29 58 36
BR 20 int. 31 46 36 31 57 43
BR 80 int. 35 36 42 33 59 43
N 1 3 5 7 10
resistance of cellulose to the external clinical working conditions of these dialyzers (Tab. 2). Comparison of the fixed based index in relation to those observed for new membranes also confirms the great stability and homogeneity of the PS membrane’s roughness parameters (mean FBI% for the RMS of the internal surface: 131.4%, of the external surface: 131.5%) and the lack of these features in the CUP membrane (mean FBI% for the RMS of the internal surface: 199.9%, of the external surface: 191.3%).
Assessment of Biocompatibility
Reactions
Interleukin 6 (IL−6)
The increase in IL−6 concentration during HD sessions with a new CUP dialyzer and after 1, 2, 3, 4, and 5 reutilizations was statistically significant (p < 0.05) in each HD session. while that with a new PS dialyzer and after 1, 3, 5, 7, and 10 reuti− lizations was not statistically significant in any HD session (Tables 3, 4).
Tumor Necrosis Factor−alpha (TNF−
αα
)
The increases in TNF−αconcentration during HD sessions with a new CUP dialyzer and after 1, 2, 3, 4, and 5 reutilizations and with a new PS dia− lyzer and after 1, 3, 5, 7, and 10 reutilizations were not statistically significant in any HD session (Tables 5, 6).
Correlation of Membrane Roughness
Parameters and Biocompatibility
Marker Values
As expected, no correlation between surface roughness parameters (RMS) of the internal CUP and PS membranes in subsequent dialyzer reuti−
Fig. 12.Comparison of V% for RMS of CUP and PS membranes, internal surfaces
Ryc. 12.Porównanie wartości V% dla RMS błon kuprofanowych i polisulfonowych, powierzchnia wewnętrzna
0 20 40 60 80 100 120
reuse cuprophane 111 22 11 24 112 43
polysulfone 30 44 28 29 58 36 N 1 2 3 4 5 7 10 %
Fig. 13.Comparison of V% for RMS of CUP and PS membranes, external surfaces
Ryc. 13.Porównanie wartości V% dla RMS błon kuprofanowych i polisulfonowych, powierzchnia wewnętrzna
0 10 20 30 40 50 60
reuse cuprophane 27 57 15 29 57 32
polysulfone 13 50 18 25 23 21
N 1 2 3 4 5 7 10
%
Table 1.Comparison of mean surface roughness parameters’ values (RMS, BR 20%, BR 80%) and the variable coefficient (V%) for RMS of the PS and CUP membranes
Tabela 1.Porównanie średnich wartości wskaźników szorstkości powierzchni (RMS BR 20%, BR 80%) i współczynnika zmienności RMS (V%) dla błon kuprofanowych i polisulfonowych
Cuprophane membrane Polysulfone membrane (Błona kuprofanowa) (Błona polisulfanowa)
RMS BR 20% BR 80% V% RMS RMS BR 20% BR 80% V% RMS
Internal surface 4.1 23.5 17.9 53.8% 8.7 44.9 30.5 37.5%
(Powierzchnia wewnętrzna)
External surface 3.4 22.4 15 36.2% 36.8 201.1 146.1 25%
Table 2.PS and CUP membranes: mean values of CR% and FBI% for the calculated RMS
Tabela 2.Błony polisulfonowe i kuprofanowe, porównanie średnich wartości CR% and FBI% dla wyliczonych wartości wskaźników RMS
Polysulfone membrane Cuprophane membrane
(Błona polisulfanowa) (Błona kuprofanowa)
internal surface % external surface % internal surface % external surface %
CR% RMS 31.36 31.50 99.86 91.27
FBI% RMS 131.36 131.50 199.86 191.30
Table 3.CUP dialyzers. IL−6 levels during HD sessions with new dialyzers and after 1, 2, 3, 4, and 5 reutilizations
Tabela 3.Dializatory kuprofanowe, zestawienie średnich wartości stężeń IL−6 podczas sesji hemodializacyjnych wykony− wanych na nowych i reutylizowanych, odpowiednio: 1, 2, 3, 4 i 5−krotnie, dializatorach
Cuprophane dialyzers t0 SD t120 SD p delta
(Dializatory kuprofanowe)
N 5.77 1.92 14.62 4.53 0.019 8.84
1 5.27 2.91 14.58 9.09 0.048 9.31
2 9.29 5.93 18.54 7.26 0.010 9.25
3 5.17 2.07 17.24 6.38 0.012 12.07
4 7.89 3.78 16.36 5.93 0.008 8.47
5 6.77 5.48 16.59 6.36 0.011 9.82
Tabela 4.Dializatory polisulfonowe. Zestawienie średnich wartości stężeń IL−6 w czasie sesji hemodializacyjnych wykony− wanych na nowych i reutylizowanych odpowiednio 1, 3, 5, 7 i 10−krotnie dializatorach
Table 4.PS dialyzers, IL−6 levels during HD sessions with new dialyzers and after 1, 3, 5, 7, and 10
Polysulfone dialyzers t0 SD t120 SD p delta
(Dializatory polisulfonowe)
N 19.82 12.94 19.76 13.23 ns. –0.06
1 17.04 5.55 18.88 5.55 ns. 1.84
3 19.48 12.66 20.42 12.23 ns. 0.94
5 16.54 12.42 16.12 8.59 ns. –0.42
7 18.54 13.73 17.74 11.36 ns. –0.80
10 16.00 9.94 17.2 10.01 ns. 1.20
Table 5.CUP dialyzers. TNF−αconcentrations during HD sessions with new dialyzers and after 1, 2, 3, 4, and 5 reutilizations
Tabela 5. Dializatory kuprofanowe, zestawienie średnich wartości stężęń TNF−αpodczas sesji hemodializacyjnych wykonywanych na nowych i reutylizowanych, odpowiednio: 1, 2, 3, 4 i 5−krotnie, dializatorach
Cuprophane dialyzers t0 SD t90 SD p delta
(Dializatory kuprofanowe)
N 3.66 1.59 3.70 1.48 ns. 0.04
1 4.16 1.78 3.48 2.03 ns. –0.68
2 3.42 1.54 3.00 1.12 ns. –0.42
3 3.32 1.08 3.80 0.81 ns. 0.48
4 3.40 0.83 3.52 1.65 ns. 0.12
5 2.88 0.29 3.26 0.51 ns. 0.38
Table 6.PS dialyzers. TNF−αconcentrations during HD sessions with new dialyzers and after 1, 3, 5, 7, and 10 reutilizations
Tabela 6. Dializatory polisulfonowe, zestawienie średnich wartości stężeń TNF−αpodczas sesji hemodializacyjnych wykonywanych na nowych i reutylizowanych, odpowiednio: 1, 3, 5, 7 i 10−krotnie, dializatorach
Polysulfone dialyzers t0 SD t90 SD p delta
(Dializatory polisulfonowe)
N 4.78 1.25 4.60 1.42 ns. –0.18
1 4.96 2.00 5.58 1.79 ns. 0.62
3 5.00 1.51 4.76 1.03 ns. –0.24
5 5.24 0.94 5.10 1.33 ns. –0.14
7 4.72 0.99 4.96 1.61 ns. 0.24
lizations and IL−6 or TNF−αsecretion profiles in the patients’ serum was found. Based on the results presented above, the following conclusion can be drawn: dialyzer reuse with peracetic acid does not significantly affects the surface nanos− tructure of the studied membranes nor has an influence on their degree of biocompatibility assessed by IL−6 and TNF−αconcentration moni− toring.
Discussion
The character of the biochemical interactions which take place when a patient’s blood comes in contact with a dialyzer’s capillaries is determined by several properties of the dialysis membrane. The internal surface roughness, chemical profile, molecular mass transfer (KoA), and ultrafiltration coefficients (Kufr) of the dialysis membrane are the main determinants of biocompatibility and func− tional profile of every dialyzer. The adhesion of cells (mainly thrombocytes and leukocytes) and several proteins on the dialysis membrane’s sur− face is a result of both physical and chemical reac− tions [9]. Tsunoda et al. evaluated the effect of five types of surface roughness of cellulosic dialysis membranes (by the AFM technique) on the degree of thrombocyte adhesion [2]. They found that in membranes with higher surface roughness the degree of thrombocyte adhesion was more intense and the biocompatibility of these membranes was lower, while the capillaries with lower surface roughness contributed to much less intense throm− bogenesis and were characterized by a higher degree of biocompatibility.
The present study demonstrated that the inter− nal surface roughness of the PS membrane (mean RMS: 8.7 nm) was higher than that of the CUP membrane (mean RMS: 4.1 nm). With reference to Tsunoda’s results, false conclusions might be drawn about a higher degree of biocompatibility for the CUP membrane [4]. The results of this study naturally cannot confirm such a correlation because the decisive factor in the degree of a dial− ysis membrane’s biocompatibility is first and fore− most the chemical compound of the internal sur− face which is in direct contact with the patient’s blood. The significance of the roughness of this surface is very important; however, with RMS val− ues ranging from 8.7 nm to 4.1 nm, this parameter is not so crucial as to affect the degree of a mem− brane biocompatibility. A much higher external roughness (in other words, porosity) of the PS membrane (mean RMS of the external surface: 36.8 nm) than of the CUP membrane (mean RMS of the external surface: 3.4 nm) was noted.
However, this finding may have another explana− tion. The higher the RMS value, the greater the surface area of the membrane, which might explain the excellent bacterial endotoxin adsorp− tion from a dialysate on an external PS membrane surface and lack of such capability in the case of the CUP membrane. Furthermore, comparing the RMS values of the PS membrane (RMS of the internal surface: 8.7 nm and of the external sur− face: 36.8 nm), it would clearly appear that its asymmetrical nanostructure cannot be ascertained by analyzing the analogous values of the symmet− rical CUP membrane (RMS of the internal surface: 4.1 nm and of the external surface: 3.4 nm).
The lack of any trend in changes in surface roughness of the evaluated dialysis membranes after consecutive reutilizations might be explained by the fact that dialyzer reuse was performed using peracetic acid, which, in contrast to bleach’s removal of PVP from PS polymer and destroying the structure of CUP membranes (chemical reaction between cellulose and alkali), did not impair the chemical structure of the studied dialysis mem− branes. The variable coefficient values for the new CUP internal surface (V%: 111%) obtained in this study and the considerable diversity of this parame− ter after consecutive reuse of the dialyzer (from 11 to 112%) might show lack of both nanostructure homogeneity and reusability of this membrane, which were assessed by the capillaries’ roughness and their great receptivity to external factors caused by the dialyzers’ working conditions (TMP, QB, QD) and the reuse process itself. This may have an impact on changes in the characteristics of CUP membrane parameters, which not only leads to delivering an insufficient dialysis dose to the patient, but decreases the safety and biocompatibil− ity of the hemodialysis session as well. In contrast, the stable internal surface variable coefficients of new (V%: 30%) and reused (28–58%) PS mem− branes may demonstrate greater homogeneity and reusability of this membrane and its lower receptiv− ity to external factors related to the clinical working conditions of these dialyzers. The stable variable coefficient values of PS membrane provide more predictable and homogenous conditions of hemodialysis sessions, which contributes to deliver− ing the desired dialysis dose to the patients as well as safety and maximal procedure biocompatibility.
in this article it can be concluded that dialyzer reuse with peracetic acid neither affects signifi− cantly the surface nanostructure of evaluated dialy− sis membranes nor influences considerably their degree of biocompatibility evaluated by monitor− ing IL−6 and TNF−α levels. Matsuda et al., who comprehensively studied the problems of structur− al and functional characteristics of dialysis mem− branes and dialyzer biocompatibility showed, that there was no one selected and independent factor describing the surface which comes in contact with the patient’s blood and which would be decisive for the total biocompatibility profile of the given device [10]. In other words, there is currently no biomaterial or polymer which would fully cover all the biocompatibility criteria concerning all the bio− logical parameters which might be considered as biocompatibility markers in the human body. PS polymer is characterized by numerous advantages essential in current dialysis therapy which are not covered even partially by cellulosic membranes or other synthetic polymers. PS dialysis membranes, owing to their high degree of biocompatibility and excellent functional parameters, were considered to
be a the ”gold standard” among synthetic dialysis membranes [11]. The results obtained in the pre− sent study values for the variable coefficient (V%), change rate parameter (T%), and fixed based index (FBI %) entirely confirm this thesis.
The authors conclude that the internal and exter− nal surface roughness of the studied membranes (expressed as the mean RMS value) disclosed an asymmetrical nanostructure of the PS and symmetri− cal nanostructure of the CUP membrane. Mean val− ues of the variable coefficient (V%) for the RMS of both the internal and external surfaces of the studied dialysis membranes showed greater nanostructure stability of new and reused PS membranes in com− parison with CUP ones. The reuse of dialysis mem− branes with peracetic acid does not affect signifi− cantly the surface nanostructures of the studied dial− ysis membranes. No correlation between dialysis membrane surface roughness (RMS) and degree of biocompatibility (IL−6 and TNF−α) was found in this study, which takes note of the importance of the chemical composition of the material the capillaries are made of as a decisive factor in determining and influencing dialyzer biocompatibility.
References
[1] Puka J, Rutkowski B, Lichodziejewska−Niemirko M et al.:Raport o stanie leczenia nerkozastępczego w Pol− sce – 2003. MAKmedia, Gdańsk 2004.
[2] Tsunoda N, Kokubo K, Sakai K et al.:Surface roughness of cellulose hollow fiber dialysis membranes and pla− telet adhesion. ASAIO 1999, 45, 418−423.
[3] Renal Systems Inc.: Renatron. Dialyzer reprocessing system. Model RS 8300. Instruction Manual. Minneapolis 1983. [4] Renal Systems Inc.: Renalin. Dialyzer reprocessing concentrate. Instruction for use and technical notes. Minnea−
polis 1983.
[5] Fresenius Medical Care. ESRD patients in 2006. A Global perspective. Bad Hamburg 2007.
[6] Rumian R, Krawentek L, Pietrzyk JA:Zastosowanie techniki atomowego mikroskopu siłowego (AFM) do ba− dań nad strukturą i biozgodnością błon dializacyjnych. Sprawozdanie z realizacji projektu badawczego KBN nr 4T11E 024 22. Kraków 2004.
[7] Biosource International: Interleukin 6 IRMA (IL−6). Diagnostic Catalog 2002–2003, 98.
[8] Biosource International: Tumor Necrosis Factor−αCB ELISA (TNF−αCB). Diagnostic catalog 2002−2003, 104. [9] Bowry SK, Ronco C:Surface topography and surface elemental composition analysis of Helixone®, a new high−
flux polysulfone dialysis membrane. Int J Artif Org 2001, 24, 757−765.
[10] Matsuda T:Biological response at non−physiological interfaces and molecular design of biocompatible surfaces. Nephrol Dial Transplant 1989, 4, 60−66.
[11] Bowry SK:Dialysis membranes today. Int J Artif Org 2002, 5, 447−460.
Address for correspondence:
Monika Miklaszewska
Dialysis Unit, Children’s University Hospital of Cracow Wielicka 265
30−047 Cracow Poland
Tel.: +48 12 658 11 59 E−mail: [email protected]
Conflict of interest: None declared