© 2014 Samidha Kamtekar et al. This is an open access article distributed under the terms of the Creative Commons Attribution License -NonCommercial-ShareAlikeUnported License (http://creativecommons.org/licenses/by-nc-sa/3.0/).
Journal of Applied Pharmaceutical Science Vol. 4 (09), pp. 061-065, September, 2014 Available online at http://www.japsonline.com
DOI: 10.7324/JAPS.2014.40911 ISSN 2231-3354
Estimation of Phenolic content, Flavonoid content, Antioxidant and
Alpha amylase Inhibitory Activity of Marketed Polyherbal
Formulation
Samidha Kamtekar*, Vrushali Keer, Vijaya Patil
M.E.T Institute of Pharmacy, Bhujbal Knowledge Center, Bandra Reclamation, Bandra (W), Mumbai- 400050, Maharashtra, India.
ARTICLE INFO ABSTRACT
Article history:
Received on: 01/07/2014 Revised on: 24/07/2014 Accepted on: 12/08/2014 Available online: 27/09/2014
The objective of this study was to evaluate α- amylase inhibitory activity of a marketed polyherbal formulation.
The α-amylase is one of the major secretory products helps in digestion of starch and glycogen. The polyherbal
extract were prepared with aqueous, hydroalcohol and ethanol. In addition, total phenolic content, total flavonoid content and in vitro antioxidant activity was evaluated. Total phenolic content was found to be 3.5725 ± 0.2336 mg of GAE/ 100 g (aqueous extract), 2.9616 ± 0.2563 mg of GAE/ 100 g (hydroalcohol extract), 4.6683 ± 0.4199 mg of GAE/ 100 g (ethanol extract). Total flavonoid content was found to be 96.1556 ± 4.2664 mg of quercetin equivalent/ 100 g (aqueous extract), 85.1881 ± 4.2135 mg of quercetin equivalent/ 100 g (hydroalcohol extract), 96.0122 ± 2.9972 mg of quercetin equivalent/ 100 g (ethanol extract). In vitro antioxidant activity was found to be 6.436 ± 0.3638 mg of ascorbic acid equivalent / 100 g (aqueous extract), 6.7242 ± 0.2461 mg of ascorbic acid equivalent / 100 g (hydroalcohol extract), 5.4616 ± 0.6696 mg of ascorbic acid equivalent / 100 g (ethanol
extract). α-amylase inhibitory activity was found to maximum in water extract followed by ethanol extract and
hydroalcohol extract.
Key words:
Gallic acid, Quercetin,
Fenugreek, α-amylase.
INTRODUCTION
Diabetes mellitus is a metabolic disorder of multiple etiology characterized by chronic hyperglycemia with disturbances of carbohydrate, fat and protein metabolism resulting from defects in insulin secretion, insulin action, or both. According to World Health Organization (W.H.O) report, number of diabetic patients is expected to increase from 171 million in year 2000 to 366 million or more by the year 2030. There are two main types of diabetes, namely type I diabetes, type II diabetes and gestational
diabetes. In type I diabetes (juvenile), β-cell of pancreas does not
produce insulin. These patients have absolute insulin deficiency and are dependent on insulin replacement for life. Type II diabetes is accounting for about 90-95%. The key components of type II
diabetes are β-cell dysfunction causing impaired insulin
secretion and increased need for insulin due to insulin resistance (American Diabetes Association, 2008; Arif et al., 2014). The cause of diabetes remains mystery although both genetics and
.
.
* Corresponding Author
Email id: samidha246@yahoo.co.in, vrushali.keer@gmail.com
environmental factors such as obesity, changing life style, eating habits and lack of exercise appear to play a role. The treatment with insulin or oral hypoglycemic agent on long term usage leads to increase blood sugar, drug resistance, adverse effects and complications which will further affect the immune system of the body. To avoid such problems, it seems beneficial to use ayurvedic formulations for better management of diabetes mellitus (Mishra, 2003). The phytoconstituents have reported to exert biological effects, including carbohydrate hydrolyzing enzyme inhibition and
antioxidant activity. The α-amylase (α-1,
4-glucan-4-glucanohydrolases) is one of the major secretory products of the pancreas and salivary glands, playing a role in digestion of starch and glycogen and can be found in microorganisms, plants and
higher organisms. The α-amylase enzyme catalyzes the initial step
in hydrolysis of starch to a mixture of smaller oligosaccharides consisting of maltose, maltotriose and branched oligosaccharides of
α-(1-6) and α-(1-4) oligoglucans. These are the acted on by α
-glucosidases and further degraded to glucose which on absorption enters the blood stream. Rapid degradation of dietary starch by
Inhibition of α-amylase limits postprandial glucose levels by delaying the process of carbohydrate hydrolysis and absorption. Another prospect mostly emphasized is the antioxidant potential of plants which have beneficial effects on prevention of diabetes and other chronic diseases. The antioxidants from natural source play a principal role by stimulating endogenous antioxidants to neutralize oxidative stress. Plants generally contain secondary metabolites like phenolics, flavonoids, glycosides, coumarins, saponins, terpenoids, alkaloids etc. which reveal their specific characteristic properties and attribute to their pharmacological properties (Sudha et al., 2011; Paul and Banerjee, 2013).
Aim of the present was to evaluate α- amylase inhibitory
potential of marketed polyherbal formulation which consists of nineteen herbs namely Acacia arabica Wild. (Leguminosae),
Asphaltum, Bombax ceiba Linn. (Bombacaceae), Butea
monosperma Wild. (Fabaceae), Emblica officinalis Gaertn. (Euphorbiaceace), Eugenia jambolana Lam. (Myrtaceae), Ficus
bengalensis Linn. (Moraceae), Gymnema sylvestre Retz.
(Ascepidaceae), Holarrhena antidysentrica Wall. (Apocynaceae), Momordica charantia Linn. (Cucurbitaceae), Pistacia integerrima
Stew. ex Brand (Anacardiaceae), Plumbago zeylanica Linn.
(Plumbaginaceae), Pongamia glabra Linn. (Fabaceae),
Pterocarpus marsupium Roxb. (Leguminosae), Santalum album Linn. (Santalaceae), Swertia chirata Buch Ham. (Gentinaceae), Terminalia chebula Retz. (Combretaceae), Tribulus terrestris
Linn. (Zygophyllaceae) and Woodfordia fruticosa Kurz.
(Lythraceae).
MATERIALS AND METHODS
The marketed D-Diabetes S.M.A.R.T powder was obtained from Shree Maruti Herbals, Mumbai.
Folin Ciocalteu’s reagent was procured from Qualigens Fine Chemicals, Bombay. Sodium carbonate, sodium nitrite, aluminium chloride, sodium hydroxide, potassium dihydrogen orthophosphate, sodium hydroxide, potassium ferricyanide,
trichloroacetic acid, ferric chloride, Potato starch, diastase (α
-amylase), 3, 5-dinitro salicylic acid, sodium potassium tartrate (Rochelle’s salt), disodium hydrogen orthophosphate, sodium dihydrogen orthophosphate, sodium chloride were procured from S.D. Fines Chemicals Pvt. Ltd., Mumbai. Gallic acid and Quercetin standards were procured from Dr. K. S. Laddha, ICT, Matunga as a gift samples. Fenugreek seed powder was purchased from Sheetal Ayurved Kendra, Thane.
Preparation of standard solutions, buffer, reagent and extract
Gallic acid solution (100 μg/ml): 10 mg of gallic acid
was dissolved in 100 ml of distilled water in volumetric flask.
Quercetin solution (1000 μg/ml): 1000 μg/ml stock
solution was prepared by dissolving 100 mg of quercetin in 100 ml of absolute alcohol.
Ascorbic acid solution: Ascorbic acid was prepared in distilled water of different concentration such as 60, 120, 180, 240,
300, 360, 420, 480 μg/ml.
Fenugreek seed powder extract: 20 g of Trigonella foenum-graecum Linn. (Leguminosae) seed powder was weighed and kept for maceration in 100 ml of hydroalcohol (1.0: 1.0) [98 % ethanol] solvent overnight and was filtered and filtrate was used for assay.
Preparation of 0.02 M sodium phosphate buffer pH 6.9 with 6.7 mM sodium chloride: 0.02 M disodium hydrogen phosphate and 0.02 M sodium dihydrogen phosphate was prepare separately and check individual pH. The one that has lower pH was added to the one that has higher pH until pH reaches 6.9, if necessary adjust pH with 1 M sodium hydroxide. 6.7 mM sodium chloride was added (Rushabhy).
DNSA reagent preparation: 1 g of 3, 5-dintro salicylic acid (DNSA) was dissolved in 50 ml of distilled water and then add 30 g of sodium potassium tartrate in small lots; the solution turns milky yellow in color. To the above, add 20 ml of 2 N sodium hydroxide; it turns to transparent orange yellow color. Volume was made up with 100 ml of distilled water. The reagent bottle was wrapped in brown paper and stored in dark and cool place (Amrita, 1956).
Preparation of polyherbal extract: The sample was prepared by macerating 5 g of polyherbal powder in three different solvent such as aqueous, hydroalcohol (1.0: 1.0) [98 % ethanol] and ethanol (absolute) for 4 hours. The extract was filtered and filtrate was used for assay.
Determination of total phenol content
Total phenolic content was estimated by Folin Ciocalteu’s method. 1 ml of aliquots and standard gallic acid (10, 20, 40, 60, 80, 100 µg/ml) was positioned into the test tubes and 5 ml of distilled water and 0.5 ml of Folin Ciocalteu’s reagent was mixed and shaken. After 5 minutes, 1.5 ml of 20 % sodium carbonate was added and volume made up to 10 ml with distilled water.
It was allowed to incubate for 2 hours at room temperature. Intense blue color was developed. After incubation, absorbance was measured at 750 nm spectrophotometer using UV- visible Jasco V- 630 instrument. The extracts were performed in triplicates. The blank was performed using reagent blank with solvent. Gallic acid was used as standard. The calibration curve was plotted using standard gallic acid. The data for total phenolic contents of polyherbal formulation were expressed as mg of gallic acid equivalent weight (GAE)/ 100 g of dry mass (Bhalodia et al., 2011; Patel et al., 2010)
Determination of total flavonoid content
yellowish color was developed. The absorbance was measured at
510 nm spectrophotometer using UV-visible Jasco V-630
instrument. The blank was performed using distilled water. Quercetin was used as standard. The samples were performed in triplicates. The calibration curve was plotted using standard quercetin. The data of total flavonoids of polyherbal formulation were expressed as mg of quercetin equivalents/ 100 g of dry mass (Patel et al., 2010; Pallab et al., 2013; Satish Kumar et al., 2008; Patel et al., 2012).
In vitro antioxidant assay
In vitro antioxidant assay was estimated by ferric reducing antioxidant power method. To the 2.5 ml of extract, 1ml of 0.2 M phosphate buffer pH 6.6 and 1 ml of 1 % potassium ferricyanide was added. The reaction mixture was incubated in water bath at 50°C for 20 minutes. Afterward, reaction mixture was rapidly cooled and 2.5 ml of 10 % trichloroacetic acid was added to stop the reaction and was centrifuged for 10 minutes. 2.5 ml of aliquots was pipetted out and 2.5 ml of distilled water and 0.5 ml of 0.1 % ferric chloride solution was added. The color changes to green.
The mixture was allowed to stand for 10 minutes and absorbance was measured at 593 nm spectrophotometerically using UV- visible Jasco V-630 instrument. The blank was performed using reagent blank and solvent. Ascorbic acid was used as standard. The extracts were performed in triplicate (Patel et al., 2010; Patel et al., 2012).
In vitro inhibitory alpha amylase assay
The 500 μL of plant extract was incubated with 500 μL of α-amylase solution (enzyme solution (2 units/ml) was obtained
by dissolving 0.001 g of α-amylase in 100 ml of 0.02 M sodium
phosphate buffer pH 6.9 with 6.7 mM sodium chloride) at room temperature (32°C) for about 10 minutes. After incubation, 500 μL
of 1 % starch solution (dissolving 1 g of potato starch in 100 ml of distilled water with boiling and stirring for 15 minutes) was added and was incubated at room temperature (32°C) for about 10 minutes. To the above, 1 ml of DNSA reagent was added to stop the reaction and was incubated in hot water bath (85°C) for 5 minutes. After 5 minutes, reaction mixture color changed to orange-red and was removed from water bath and cooled to room temperature.
It was diluted up to 5 ml of distilled water. Extracts at different concentrations (2, 5, 10, 15, 20 mg/ml) were performed in triplicates. Individual blank was performed by replacing enzyme with buffer. Control was performed by replacing extract with solvent. Fenugreek seed powder (4, 10, 20, 30, 40 mg/ml) was used as positive control. Absorbance was measured at 540 nm in JascoV-630 spectrophotometer. Enzyme unit is defined as one unit of enzyme will liberate 1mg of maltose from 1 % starch in 5 minutes under defined condition i.e. room temperature. Logarithmic regression curve was established by plotting percentage of alpha amylase inhibition against sample concentration in order to calculate IC50 (inhibitory concentration)
value. This represents sample concentration (mg/ml) required to decrease the absorbance by 50 % of alpha amylase (Paul and Banerjee, 2013; Parimelazhagan et al., 2011).
The inhibition percentage of α-amylase was assessed by the
following formula:
The α-amylase inhibitory activity = (Ac+) – (Ac-) – (As - Ab)/
(Ac+) – (Ac-) × 100 Where,
Ac+ that absorbance of 100% enzyme activity (only solvent with enzyme)
Ac- that absorbance of 0% enzyme activity (only solvent without enzyme)
As that absorbance of test sample with enzyme Ab that absorbance of test sample without enzyme
RESULTS AND DISCUSSION
Determination of total phenolic content
The total phenolic content for aqueous, hydroalcohol and ethanol extracts were estimated by Folin Ciocalteu’s method using gallic acid as standard. The reagent is formed from a mixture of phosphotungstic acid and phosphomolybdic acid which after oxidation of the phenols, is reduced to a mixture of blue oxides of tungsten and molybdenum. The blue coloration produced has a maximum absorption in the region of 750 nm and proportional to the total quantity of phenolic compounds originally present. The gallic acid solution of concentration (10-100 ppm) conformed to Beer’s Law at 750 nm with a regression co-efficient (R2) = 0.9995.The plot has a slope (m) = 0.0106 and intercept = 0.0542. The equation of standard curve is y = 0.0106x + 0.0542 (Fig. 1).
R² values represented mean data set of n=3
Fig. 1: Total phenolic content for standard gallic acid.
Table 1: Results of total phenolic content for polyherbal formulation.
Concentration of extracts Phenolic content (mg of gallic acid equivalent/ g dry material) Aqueous, 4 mg/ml 3.5725 ± 0.2336 Hydroalcohol, 1 mg/ml 2.9616 ± 0.2563 Ethanol, 20 mg/ml 4.6683 ± 0.4199 Values are mean ± S.E.M, n=3
Determination of total flavonoid content
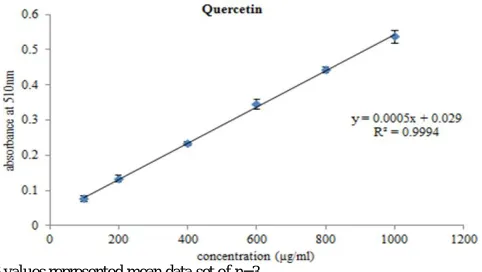
colorimetric assay using quercetin as standard. Aluminium chloride forms acid stable complexes with the C-4 keto groups and either the C-3 or C-5 hydroxide group of flavones and flavonols. In addition it also forms liable complexes with ortho dihydroxide groups in A/B rings of flavonoids. The quercetin solution of concentration (100-1000 ppm) conformed to Beer’s Law at 510 nm with a regression co-efficient (R2) = 0.9994. The plot has a slope (m) = 0.0005 and intercept = 0.029. The equation of standard curve is y = 0.0005x + 0.029 (Fig. 2).
R² values represented mean data set of n=3
Fig. 2: Total flavonoid content for standard quercetin.
Table 2: Results of total flavonoid content for polyherbal formulation.
Concentration of extracts Flavonoid content (mg of quercetin equivalent/ g dry material) Aqueous, 40 mg/ml 96.1556 ± 4.2664 Hydroalcohol, 15 mg/ml 85.1881 ± 4.2135 Ethanol, 20 mg/ml 96.0122 ± 2.9972 Values are mean ± S.E.M, n=3
In vitro antioxidant assay
In vitro antioxidant assay for aqueous, hydroalcohol and ethanol extracts were estimated by ferric reducing antioxidant power method using ascorbic acid as standard. Reducing power is a measure of ability of the extract to reduce Fe+3 to Fe+2. Substance which have reduction potential react with potassium ferricyanide (Fe+3) to form potassium ferrocyanide (Fe+2) and then react with ferric chloride to form ferric-ferrous complex. The ascorbic acid solution of concentration (60-480 μg/ml) conformed
to Beer’s Law at 593 nm with a regression co-efficient (R2) = 0.999. The plot has a slope (m) = 0.0019 and intercept = 0.0396. The equation of standard curve is y = 0.0019x-0.0396 (Fig. 3).
R² values represented mean data set of n=3
Fig. 3:In vitro antioxidant assay for standard ascorbic acid.
Table 3: Results of in vitro antioxidant assay for polyherbal formulation. Concentration of
extracts
Flavonoid content (mg of quercetin equivalent/ g dry material) Aqueous, 5 mg/ml 6.4360 ± 0.3638 Hydroalcohol, 0.8 mg/ml 6.7242 ± 0.2461 Ethanol, 2 mg/ml 5.4616 ± 0.6696 Values are mean ± S.E.M, n=3
In vitro inhibitory alpha amylase assay
The IC50 value of α-amylase inhibition for water extract,
hydroalcohol extract and ethanol extract was found to be 6.476, 12.395 and 8.690 mg/ml respectively. The IC50value of α-amylase
inhibition for hydroalcohol extract of fenugreek seed powder was found to be 9.741 mg/ml (Fig. 4). It was found that water extract
shows maximum α-amylase inhibitory activity followed by ethanol
extract and hydroalcohol extract (Fig. 5).
R² values represented mean data set of n=3
Fig. 4:In vitro alpha amylase inhibitory assay for standard fenugreek.
Fig. 5:In vitro alpha amylase inhibitory assay for aqueous, hydroalcohol and ethanol polyherbal extracts.
The α-amylase enzyme, catalyses the hydrolysis of α-1-4
glycosidic linkages from the non-reducing ends of polysaccharides (starch-amylase, amylopectine and glycogen) to yield maltose
units. This enzyme does not hydrolyze α-1-6-glycosidic linkages
carbohydrates, alkaloids, glycosides, phytosterols, phenols, tannins and flavonoids. Quantitative estimation of polyherbal aqueous, hydroalcohol and ethanol extract also showed the presence of phenol, flavonoid and antioxidant. Diabetes mellitus is a metabolic disorder may be due to enhanced cellular oxidative stress and reduced antioxidant activity. Polyphenols and flavonoids are natural antidiabetic agents, which interferes the production of free radicals, reduce oxidative stress and inhibit digestive enzyme, thus lowering postprandial glucose. The aqueous polyherbal extract
shows high α-amylase inhibitory activity followed by ethanol and
hydroalcohol extract. This suggests that these extracts, rich in flavonoids and phenolics have potential to contribute to the management of diabetes.
CONCLUSION
D-Diabetes polyherbal formulation shows the presence of polyphenols, flavonoids and antioxidant compounds. The
polyherbal extracts shows good α-amylase inhibitory activity. The
highest α-amylase inhibitory activity shown by aqueous polyherbal
extract followed by ethanol and hydroalcohol extracts. This suggests that these extracts, contains flavonoids and phenolics which have potential to contribute in the management of diabetes and its complications. Hence, the parameters such as chemical and in vitro pharmacological methods may be considered as a tool for assistance to the scientific organization and manufacturers in developing standards.
ACKNOWLEDGEMENTS
The authors are thankful to Shree Maruti Herbals, Mumbai for gift sample of D-Diabetes S.M.A.R.T powder and Dr. K. S. Laddha, I.C.T, Matunga, Mumbai for gift samples of Gallic acid and Quercetin.
REFERENCES
American Diabetes Association. Diagnosis and classification of diabetes mellitus. Diabetes Care, 2008; 31(1): 33-40.
Amrita Vishwa Vidhyapeetam University, 1956. DNSA reagent: Effect of substrate concentration on enzyme kinetics.
Available at: http://amrita.vlab.co.in /?sub=3&brch=64&sim=1090&cnt=2 [Accessed 05 May 2013].
Arif T, Sharma B, Gahlaut A, Kumar V, Dabur R. Anti-diabetes agents from medicinal plants- A review. Chemical Biology Letters, 2014; 1(1): 1-13.
Bhalodia N, Nariya P, Acharya R, Shukla V. Evaluation of in vitro antioxidant activity of flowers of Cassia fistula Linn. Int J PharmTech Res, 2011; 3(1): 589-599.
Mishra LC. 2003. Scientific basis for ayurvedic therapies. 1st edition, Boca Raton, USA: CRC Press: 102.
Pallab K, Tapan B, Tapas P, Ramen K. Estimation of total flavonoids content (TPC) and antioxidant activities of methanolic whole plant extract of Biophytum sensitivum Linn. Journal of Drug Delivery and Therapeutics, 2013; 3(4): 33-37.
Parimelazhagan T, Manian S, Pugalenthi M. Herbal perspectives: Present and Future. 1st edition, New Delhi: Satish Serial Publishing House; 2011: 158.
Patel A, Patel A, Patel A and Dr. Patel NM . Estimation of flavonoid, polyphenolic content and in vitro antioxidant capacity of leaves of Tephrosia purpurea Linn. (Leguminosae). Int J Pharma Sci and Res, 2010; 1(1): 66-77.
Patel S, Patel J, Patel RK. To study proximate analysis & biological evaluation of Triphala Guggulu formulation. Int J PharmTech Res, 2012; 4(4): 1520-1526.
Paul T, Banerjee S. In vitro evaluation of α-amylase inhibitory activity & antioxidant potential of Pteris vittata L. with special reference to its HPTLC profile. Int J Pharma and Bio Sci, 2013; 4(2): 494-503.
Rushabhy. How to prepare 0.02M sodium phosphate buffer pH 6.9 with 6.7mM sodium chloride. Available at: http://wiki.answers.com/Q/How_do_you_make_0.02M_sodium_
phosphate_ buffer_of_pH_6.9_with_0.006M_NaCl [Accessed 05 May 2013].
Satish Kumar T, Baskar, Shanmugam S, Rajasekaren P, Sadasivam and Manikandan V. Optimization of flavonoids extraction from the leaves of Tabernaemontana Heyneana Wall. Using L16 orthodesign. Nature and Science, 2008; 6(3): 10-21.
Sudha P, Zinjarde S, Bhargava S, Kumar A. Potent α-amylase
inhibitory activity of Indian ayurvedic medicinal plants. BMC complementary and Alternative Medicine, 2011; 11(5): 1-10.
How to cite this article: