Turkish Journal of Fisheries and Aquatic Sciences 10: 245-254 (2010)
www.trjfas.org ISSN 1303-2712 DOI: 10.4194/trjfas.2010.0213
© Published by Central Fisheries Research Institute (CFRI) Trabzon, Turkey in cooperation with Japan International Cooperation Agency (JICA), Japan
Zooplankton Seasonal Abundance and Vertical Distribution of Highly
Alkaline Lake Burdur, Turkey
Introduction
Despite the worldwide simplicity of highly saline lakes, in terms of biological diversity, ecosystem structure and habitat homogeneity, no complete picture of the ecology of any salt lake has yet been produced (Williams, 1996). Euryhaline invertebrates generally include cosmopolitan species and those with wide distributions but presence only in certain habitats. The rotifer Brachionus plicatilis and
the brine shrimp Artemia spp. are the examples of
first category, while the calanoid copepod D. salinus
may be the example of the latter (Cole, 1983).
Lake Burdur is one of the deepest lakes of Turkey. The aquatic plants are not observed in the lake because of the amount of sodium sulphate and
chlorine content (Anonymous, 1998). Since the lake does not freeze in winter, it serves as a winter refuge for the birds (Arcak and Altındağ, 2000). The ecosystem of the lake is threatened by the presence of an industrial complex (Isparta Organized Endustrial Region) and Süleyman Demirel Airport close to the northern shore. The decrease of water levels (because of construction of upstream dams and unknown causes), increasing of sedimentation (from catchment erosion), organic pollution (from food processing and Burdur City raw sewage waste) and inorganic effluent (from a sulphur mine) represent long-term threats to the integrity of the lake (Anonymous, 1993; Green et al., 1996). The water level has decreased from 1975
to 2002 due to construction of dams and ponds in catchment basin, resulting in the loss of 27% of the
Iskender Gülle1, Ismail Ibrahim Turna2, Salim Serkan Güçlü2, Pinar Gülle2, Zekiye Güçlü2
1 Mehmet Akif Ersoy University, Faculty of Arts and Sciences, Department of Biology, 15100 Burdur, Turkey. 2 Süleyman Demirel University, Fisheries Faculty, 32500 Egirdir, Isparta, Turkey.
* Corresponding Author: Tel.: +90.248 2122700 / 1686; Fax: +90.248 2122718;
E-mail: igulle@mehmetakif.edu.tr Accepted 08 February 2010 Received 19 July 2008
Abstract
During the period from December 2003 to November 2004 a study has been held to examine the water quality and zooplankton of highly alkaline Lake Burdur. The lake showed thermal stratification between June and October. Six zooplankton taxa were determined, Hexarthra fennica, Brachionus plicatilis from Rotifera and Arctodiaptomus burduricus from Copepoda were the dominant species. Average zooplankton density was 399,074 ind.m-3 and they were 51% H. fennica, 9% B. plicatilis and 40% A. burduricus. In addition, vertical zooplankton distributions have been investigated in this study. Generally, zooplankton groups were concentrated between 5-20 m. However, rotifers and A. burduricus were determined to have the highest density at 5 and 15 m, respectively.
Keywords: Saline lake, Arctodiaptomus burduricus,zooplankton, vertical distribution.
Alkali Özellikli Burdur Gölü Zooplanktonunun Mevsimsel Bolluğu ve Dikey Dağılımı
Özet
Aralık 2003-Kasım 2004 tarihleri arasında yürütülen bu çalışmada, yüksek alkali özellikteki Burdur Gölü’nün su kalitesi ve zooplanktonu incelenmiştir. Haziran-Ekim ayları arasında termal tabakalaşma gösteren gölde zooplanktonu temsilen 6 takson belirlenmiş olup, Rotiferadan Hexarthra fennica ve Brachionus plicatilis ile Copepoda’dan Arctodiaptomus burduricus baskın bulunan türlerdir. Ortalama yoğunluğu 399.074 birey m-3 olan zooplanktonunun %51’ini H. fennica, %9’unu B. plicatilis ve %40’ını A. burduricus oluşturmuştur. Zooplanktonun dikey dağılımının da incelendiği bu çalışmada, genel olarak, toplam zooplankton 5-20 m derinlikler arasında yoğunlaşmasına karşılık, rotiferler ve A. burduricus sırasıyla 5. ve 15. m derinliklerde en yüksek yoğunluk değerinde saptanmıştır.
246
lake area during the period of 27 years (Şener et al.,
2005). Nowadays the estimated lake area ranges between 140 km2 (Girgin
et al., 2004) or 153 km2
(Şener et al., 2005).
Lake Burdur has great ornithological importance harbouring numerous wintering bird species. It is the most important wintering site in the world for the white-headed duck Oxyura leucocephala, a globally
threatened species. It has also served habitats to 10 other internationally important waterfowl species (Green et al., 1996). Lake Burdur has been a Ramsar
Site since 1993 and Wildlife Reserve since 1994 (Yarar and Magnin, 1997). Aphanius anatoliae sureyanus (Cyprinodontidae, Pisces) (the only fish
species) and A. burduricus Kiefer, 1939 (Copepoda,
Crustaceae) are endemic species of the lake (Altındağ and Yiğit, 2002; Girgin et al., 2004). The lake show
mesosaprobic levels (Girgin et al., 2004) and Nodularia spumigena (Cyanobacteria) blooms occur
during summer (Anonymous, 2000).
The previous studies on zooplankton and limnoecology of Lake Burdur were done by Numann (1958), Timur et al. (1988), Kazancı et al. (1998),
Arcak and Altındağ (2000), Altındağ and Yiğit (2002) and Girgin et al. (2004). These studies mainly dealt
with the seasonal variation of zooplankton distribution, while vertical distributions were not included.
The aim of this study is to determine annual cycle and vertical distribution in thermal stratification period of the zooplankton, also the effective limnological parameters. Since the vertical distribution and monthly densities of zooplankton in Lake Burdur are firstly described in this study, it can contribute to related studies. Secondarily, it is aimed at presenting a distribution model representative of zooplankton in saline-alkaline lakes of Turkey.
Materials and Methods
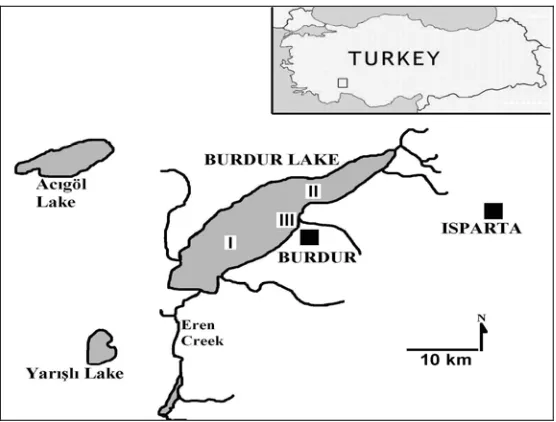
Lake Burdur is among the largest and deepest lakes of Turkey, located at the Lake District Region in south-western Anatolia (37°43′351′′ N, 30°10′878′′ E), within a closed basin (Figure 1). Catchment area is 6150 km2. The average depth is 40 m and maximum depth 68 m. Maximum surface area is 140 km2 at 854 m elevation (Girgin et al., 2004). It is salty and highly
alkaline (pH 9-9.60) and it never freezes.
Three stations were chosen from different parts of the lake (Figure 1): station I at 37°43′351′′ N, 30°10′878′′ E (depth: 60-65 m); station II at 37°46′849′′ N, 30°16′256′′ E (depth: 6-7 m), and station III at 37°44′517′′ N, 30°13′981′′ E (depth: 15-20 m).
The samples for water quality were collected at three stations (Figure 1), at surface water at depth of transparency by using Nansen bottles (1.7 L volume). The water quality parameters were analyzed using the methods described by Apha-Awwa-Wef (1998), Boyd and Tucker (1992) and Lind (1985). Transparency (Secchi disc depth), temperature, pH (WTW 330i pH meter), conductivity (YSI 30 model SCT meter) and dissolved oxygen (WTW Oxi 320 oximeter) were measured in situ. Nutrient analysis of water was done
by filtering with GF/C filters in the Merck Spectroquant® test kits, and water is analyzed for NH4-N, NO3-N, and PO4-P. Turbidity and color were determined directly in Merck Nova 60 photometer. Chlorophyll a was determined according to
Apha-Awwa-Wef (1998), Bartram and Balance (1996). Total non-filterable (suspended matter) and filterable residues were filtered through the filter paper (Whatman CF/C) and dried 1 h at 103-105°C (Apha-Awwa-Wef, 1998).
Zooplankton was sampled monthly during the
247
period from December 2003 to November 2004. Sampling was done with plankton net of 55µm mesh size equipped with mounted digital flow meter (Hydro-bios Kiel), as vertical hauls of 20, 10 and 5 m; of Ist, IIIrd and IInd stations respectively (according to the depth of the lake). The net-selected samples were preserved in 4% formalin. Also, in July 2004, zooplankton samples were collected vertically from 0 to 60 m (at station I), in 5 meter intervals from bottom upwards and with 5 sampling from each depth in a 24 hours duration, by using a motor-pump. 20 litres of water samples taken from each sampling depth were filtered through net of 55 µm pore size. Zooplankton counts were carried out in Sedgwick-Rafter counting chambers under an inverted microscope (Nikon Eclipse TE-200). Zooplankton abundance was expressed as individuals per cubic meter.
Statistical analyses were done for zooplankton density and its vertical distribution using one-way ANOVA.
Results
The mean surface water parameter values of Lake Burdur are shown below (Table 1).
Graphics for parameters of water quality are
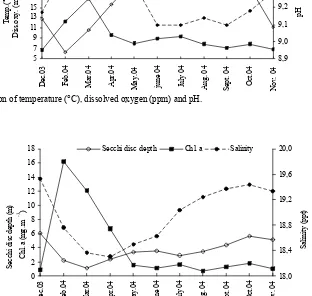
shown in Figures 2 and 4. Differences between the mean for parameters of water quality were significant (P<0.05), excluding colour and turbidity (Table 1). Variance of temperature, dissolved oxygen and pH are shown in Figure 2; transparency, chlorophyll a
and salinity are shown in Figure 3; NH4-N, NO3-N and PO4-P are shown in Figure 4. The minimum and maximum temperatures were measured in February (6.3°C) and July (24.9°C), respectively. The minimum and maximum values of dissolved oxygen were found in December (6.8 mg L-1) and March (16.7 mg L-1), respectively (Figure 2).
Figure 3 shows that the salinity is low in February-June period and high in July-December period. The minimum and maximum values were determined in April (18.3 ppt) and November (19.5 ppt), respectively. The highest chlorophyll a values
were recorded in spring (the maximum in February, 16.17 μg L-1) and the lowest ones in the other seasons (the minimum in August, 0.70 μg L-1). The chlorophyll a concentrations showed a dissimilar
gradient of transparency (Secchi disc depth) (Figure 3) addition, differences of mean chlorophyll a
contents were significant (P<0.05) (Table 1).
In generally, PO4-P values were moderate to high. Its concentrations ranged from 0.02 to 0.26 mg
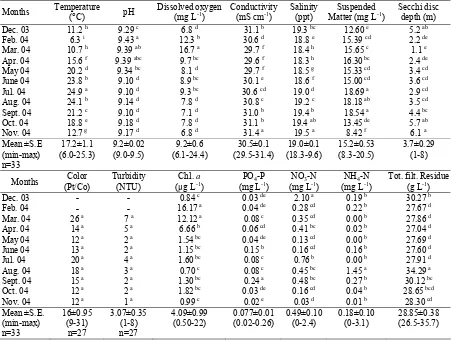
Table 1. Chemical and physical features of the water in Lake Burdur, December 2003-November 2004
Months Temperature(°C) pH Dissolved oxygen (mg L-1) Conductivity (mS cm-1) Salinity (ppt) Matter (mg LSuspended -1) Secchi disc depth (m)
Dec. 03 11.2 h 9.29 c 6.8 d 31.1 b 19.3 bc 12.60 e 5.2 ab Feb. 04 6.3 i 9.43 a 12.3 b 30.6 d 18.8 e 15.39 cd 2.2 de Mar. 04 10.7 h 9.39 ab 16.7 a 29.7 f 18.4 h 15.65 c 1.1 e Apr. 04 15.6 f 9.39 abc 9.7 bc 29.6 f 18.3 h 16.30 bc 2.4 de May 04 20.2 d 9.34 bc 8.1 d 29.7 f 18.5 g 15.33 cd 3.4 cd June 04 23.8 b 9.10 d 8.9 bc 30.1 e 18.6 f 15.00 cd 3.6 cd Jul. 04 24.9 a 9.10 d 9.3 bc 30.6 cd 19.0 d 18.69 a 2.9 cd Aug. 04 24.1 b 9.14 d 7.8 d 30.8 c 19.2 c 18.18 ab 3.5 cd Sept. 04 21.2 c 9.10 d 7.1 d 31.0 b 19.4 b 18.54 a 4.4 bc Oct. 04 18.8 e 9.18 d 7.8 d 31.1 b 19.4 ab 13.45 de 5.7 ab Nov. 04 12.7 g 9.17 d 6.8 d 31.4 a 19.5 a 8.42 f 6.1 a Mean ±S.E
(min-max) n=33
17.2±1.1
(6.0-25.3) 9.2±0.02 (9.0-9.5) (6.1-24.4)9.2±0.6 (29.5-31.4)30.5±0.1 (18.3-9.6)19.0±0.1 15.2±0.53 (8.3-20.5) 3.7±0.29 (1-8)
Months (Pt/Co) Color Turbidity (NTU) (Chl. a μg L-1) (mg LPO4-P -1) (mg LNO3-N -1) (mg LNH4-N -1) Tot. filt. Residue(g L-1)
Dec. 03 - - 0.84 c 0.03 de 2.10 a 0.19 b 30.27 b
Feb. 04 - - 16.17 a 0.04 de 0.28 cd 0.22 b 27.67 d
Mar. 04 26 a 7 a 12.12 a 0.08 c 0.35 cd 0.00 b 27.86 d Apr. 04 14 a 5 a 6.66 b 0.06 cd 0.41 bc 0.02 b 27.04 d May 04 12 a 2 a 1.54 bc 0.04 de 0.13 cd 0.00 b 27.69 d June 04 13 a 2 a 1.15 bc 0.15 b 0.16 cd 0.16 b 27.60 d
Jul. 04 20 a 4 a 1.60 bc 0.08 c 0.76 b 0.00 b 27.91 d
Aug. 04 18 a 3 a 0.70 c 0.08 c 0.45 bc 1.45 a 34.29 a Sept. 04 15 a 2 a 1.30 bc 0.24 a 0.48 bc 0.27 b 30.12 bc Oct. 04 12 a 2 a 1.82 bc 0.03 de 0.16 cd 0.04 b 28.65 bcd Nov. 04 12 a 1 a 0.99 c 0.02 e 0.03 d 0.01 b 28.30 cd Mean ±S.E.
(min-max) n=33
16±0.95 (9-31)
n=27
3.07±0.35 (1-8) n=27
4.09±0.99
248
L-1. NO
3-N values were found as 0.03-2.10 mg L-1 and NH4-N values were measured up to 1.45 mg L-1 (Figure 4).
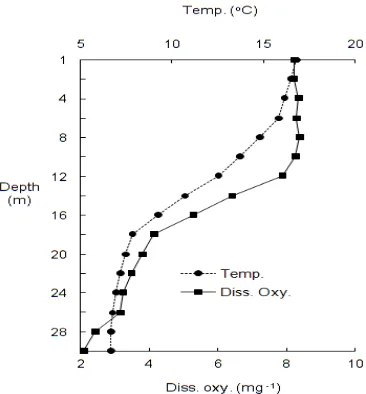
Temperature and dissolved oxygen profiles are presented in Table 2, at the surface layer and deep waters (downward to 30 m). Temperature and dissolved oxygen concentration in between layers are statistically different from each other (P<0.05).
Dissolved oxygen profile is clinograde type and similar to the temperature profile. This graph indicates the existence of thermocline between 10 and 16 m depth. Surface water (1-14 m) is rich for dissolved oxygen however, deep water is (from 18th m to depth) poor in dissolved oxygen (Figure 5).
The seasonal maximal density of zooplankton was observed in June as 1,144,559 ind. m-3, and minimum density in February as 129,765 ind. m-3, thus seasonal fluctuation in the zooplankton community was important (P<0.05) The maximum density of A. burduricus was 437,915 ind. m-3 in
March. In general, two periods were detected in zooplankton density: one with the lesser density (between September-February) and the other with the higher density (between March-August) (Figure 6, Figure 7).
A total of 6 zooplankton taxa were recorded: 3 rotifers, and 3 copepods. Cladoceran species were not observed.
Rotifera
Order: Monogononta Family: Brachionidae
Brachionus plicatilis Müller, 1786 Family: Colurellidae
Colurella adriatica Ehrenberg, 1831 Family: Hexarthriidae
Hexarthra fennica (Levander, 1892) Copepoda
Order: Calanoida Family: Diaptomidae
Arctodiaptomus burduricus Kiefer,1939 Order: Cyclopoida Family: Cyclopidae Cyclops sp. Order: Harpacticoida Family: Canthocamptidae Canthocamptus sp.
The abundance levels of zooplankton in three sampling stations are different from each other (Figure 8).
At station I, which is the deepest of stations, A.
5 7 9 11 13 15 17 19 21 23 25 De c. 03 Fe b. 04 Ma r.0 4 Ap r.0 4 M ay. 04 ju ne 0 4 Ju ly 0 4 A ug. 04 Se pt . 0 4 Oc t.0 4 No v. 0 4 Te m p. (° C ) Di ss .o xy . ( m g L -1 ) 8,9 9,0 9,1 9,2 9,3 9,4 9,5 pH
Temp. Diss. oxy. pH
Figure 2. Variation of temperature (°C), dissolved oxygen (ppm) and pH.
0 2 4 6 8 10 12 14 16 18 De c. 03 Fe b. 04 Ma r.04 Ap r.0 4 Ma y. 04 ju ne 0 4 Ju ly 0 4 Au g. 0 4 Se pt . 0 4 Oc t.0 4 N ov. 04 Se cc hi di sc de pt h ( m ) Ch l. a ( m g. m -3 ) 18,0 18,4 18,8 19,2 19,6 20,0 Sa lin ity (p pt )
Secchi disc depth Chl. a Salinity
249
Figure 4. Variation of NO3-N, NH4-N and PO4-P.
Table 2. Monthly distribution of temperature and dissolved oxygen according to depth (0-30 m), during December 2003-Novomber 2004, monthly
Temperature Dissolved Oxygen
Depth Mean ±SD
(n=11) Min Max Mean ±SD (n=11) Min Max
1 16.8±6.4 a 5.9 24.4 8.2±2.1 a 6.0 12.7
2 16.5±6.4 ab 5.6 24.3 8.2±2.1 a 6.0 12.5
4 16.2±6.4 ab 5.4 24.3 8.3±2.2 a 6.0 12.6
6 15.8±6.4 ab 5.4 24.1 8.3±2.0 a 5.9 11.7
8 14.8±6.0 ab 5.4 23.2 8.4±1.9 a 6.0 11.5
10 13.7±5.8 abc 5.4 21.6 8.3±1.8 a 6.4 11.0
12 12.6±5.2 bcd 5.4 20.2 7.9±1.4 a 6.5 10.5
14 10.7±4.5 cde 5.6 19.8 6.4±2.2 ab 3.0 10.2
16 9.2±2.9 de 5.8 15.7 5.3±3.0 bc 1.2 9.6
18 7.9±1.6 e 5.9 10.8 4.1±3.4 cd 0.0 9.5
20 7.4±1.4 e 5.9 10.1 3.8±3.3 cd 0.0 8.9
22 7.1±1.3 e 6.1 10.0 3.5±2.9 cd 0.0 8.0
24 6.9±1.0 e 6.2 9.7 3.3±2.6 cd 0.0 7.7
26 6.8±0.7 e 6.3 8.6 3.1±2.5 cd 0.2 7.6
28 6.6±0.4 e 6.3 7.7 2.4±2.0 cd 0.4 6.5
30 6.6±0.3e 6.2 7.5 2.1±2.0 d 0.1 6.3
Statistical analysis was performed in order to observe the relation according to one tailed ANOVA Duncan test. Values in the same column with same superscript are not significantly different (P>0.05)
250
burduricus is the dominant species (238,519±175,772
ind.m-3), and stations II and III are alike in zooplanton density. All through the lake, the rotifers showed a widespread distribution (Figure 9).
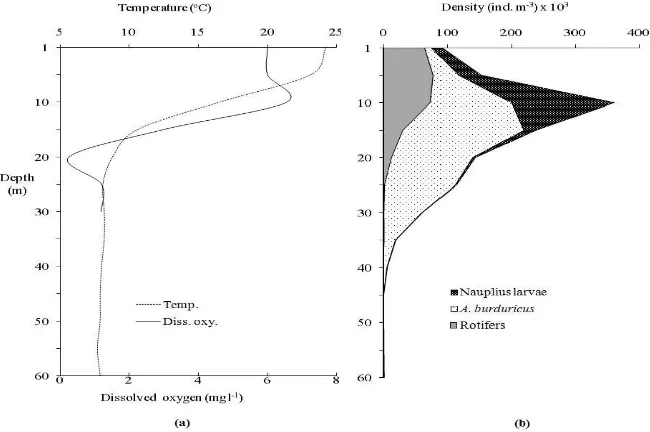
The vertical distribution of zooplankton showed a clear correlation between zooplankton groups and water depth. The upwater was characterized by the presence of the rotifers and the lower depth by the Calanoid copepod, A. burduricus. Rotifers and
nauplius larvae colonized the surface layer (1-10 m), but A. burduricus inhabited in the mid layer of water
(Figure 10b). Vertical temperature and dissolved oxygen profile of the lake were determined in same period (Figure 10a). The vertical distribution patterns of zooplankton were very similar to that of temperature and dissolved oxygen curves (Figures. 10a, b).
0 200 400 600 800 1.000 1.200
De
c.
03
Fe
b.
04
M
ar-0
4
Ap
r.0
4
Ma
y-04
ju
ne
04
Ju
ly
0
4
Au
g.
0
4
Se
pt
. 0
4
Oct
.0
4
No
v.
0
4
in
d.
m-3 (x
10
3)
Rotifera A. burduricus
Figure 6. Monthly distribution of zooplankton groups density (ind. m-3).
1 10 100 1.000 10.000 100.000 1.000.000 10.000.000
De
c.
03
Fe
b.
04
Ma
r.
04
Ap
r.
04
Ma
y.
0
4
ju
n
e 0
4
Ju
ly
0
4
Au
g.
0
4
Se
p
t. 0
4
Oc
t.0
4
No
v.
0
4
D
ens
ity (i
nd
. m
-3 )
B. plicatilis
H. fennica
A. burduricus
Figure 7. Monthly distribution of zooplankton species density (ind. m-3).
0 100 200 300 400 500
st. I st. II st. III
D
ens
ity
(i
nd
. m
-3 ) x
1
0
3
B. plicatilis
H. fennica
A. burduricus
251
Discussion and Conclusions
In order to determine the vertical distribution of zooplankton, the sampling was performed throughout the day (24 hours) in July, when thermal and chemical stratification could be observed. However, while observing the zooplankton distribution according to depth, the time periods of the day were neglected, so the repression by fish hunting could not have been determined. Additionally, the effects of the environmental factors on seasonal distribution of zooplankton were discussed.
The dissolved oxygen value of the surface level was generally sufficient for each season of the year (between 6.1-24.4 mg L-1). Similar results had been found in the previous studies that were performed on the lake (Altındağ and Yiğit, 2002; Arcak and Altındağ, 2000; Kazancı et al., 1998; Girgin et al.,
2004; Timur et al., 1988).
Vertical water quality measurements of Lake Burdur between June and November presented a
thermal stratification. During the year, according to the vertical dissolved oxygen measurements, it was observed that this parameter was increasing from surface to 20 m depth, and anoxic conditions were present after 24 m in general. In the period of thermal stratification, the epilimnion layer occurred between 0-14 m; metalimnion layer occurred between 14-18 m; and hypolimnion layer (6-8°C) occurred after 18 m depth. In the lake, classified as warm monomictic due to thermal characteristics, the amount of dissolved oxygen has an instantaneous decline after 16m depth. The vertical profile of dissolved oxygen is clinograde type which coincides with eutrophic lakes (Cole, 1983; Goldman and Horne, 1983).
The measurements of pH, conductivity and salinity according to the depth were correlated well with thermal stratification. The values of pH increased distinctly from surface to depth, and had a maximum value (9.36) at 22-37.5 m and a minimum value (9.15) at 60 m. The conductivity and salinity values at the surface were 28.9 mS cm-1 and 17.8 ppt
B. plicatilis 9,1%
H. fennica 49,5% A. burduricus
41,5%
Figure 9. The distribution of zooplankton taxa in Lake Burdur.
252
respectively; at the depth level (50 m) these values were between 30.86 mS cm-1 and 19.6 ppt. These gradations are the general characteristics of salty lakes (Cole, 1983).
At the surface level of Lake Burdur, there is no dissolved oxygen deficiency, since average dissolved oxygen value was 9.2±0.6 mg L-1 and saturation value was 103%. The maximum dissolved oxygen value (16.73 mg L-1) measured was in March. The maximum chlorophyll a (16.17μg L-1) measurements
coincide with those of minimum transparency values (1.1 m). This condition can be explained by an increase in photosynthesis of phytoplankton.
In the other studies that were performed in Lake Burdur, transparency values were measured as 3-6 m in 1993-1995 (Kazancıet al., 1998), 1.3-5 m in 1997
(Girgin et al., 2004), and 1.5-4.2 m in 1998 (Arcak
and Atındağ, 2000). These results are in conformity with our results (with the range of 1.1-6.1 m, Figure 3).
In this study, the average chlorophyll a
concentration was 4.09 μg L-1, with a range of 0.70-16.17 μg L-1. This parameter was determined as 0.006 μg L-1 in 1993-1995 (Kazancı
et al., 1988), and
1.17-14.74 μg L-1 (spring overturn) in 1997 (Girgin et al.,
2004). Chlorophyll a concentration peaked in late
winter (February to April), but was low in summer and early winter in general (Figure 3). This figure can be explained as a result of thermal and chemical stratification; because in warm monomictic lakes, the highest values of chlorophyll a are available in spring,
the mixing period (Cole, 1983; Wetzel, 2001). The increasing concentration of chlorophyll a displays an
upward trend of the trophic level of the lake during this period.
In our research, average PO4-P value was measured as 0.106 mg L-1. This value is over the derigueur limit values for eutrophic lakes (Harper, 1992; Henderson-Sellers and Markland, 1987). In previous studies, PO4-P was measured as 0-0.013 mg L-1 (Kazancı
et al., 1998), 0.03-0.09 mg L-1 (Arcak
and Altındağ, 2000) and 0-0.19 mg L-1 (Girgin et al.,
2004). Consequently, a substantial increase in the nutrient level in the last decade can also be seen
Total hardness level is very high, with values between 4,750 and 6,250 mg L-1 as CaCO
3 (Arcak and Altındağ, 2000; Kazancı et al., 1998). In this
case, the coprecipitation of phosphate and calcium is especially important in taking phosphate out of circulation. Phosphate adsorbs on calcium carbonate and they precipitate concurrently when the pH rises to values close to 9.0 (Cole, 1983). Also concentration of iron, on which phosphate is known to adsorb also, had been declared high (160 mg L-1) (Kazancı
et al.,
1998). Considering the hardness levels, the striking upward trend of the phosphate concentration is considered an issue of concern for future of the lake.
In our study, 6 taxa of zooplankton (Rotifera 3 and Copepoda 3) were determined, while Kazancıet al. (1988) determined 9 (Rotifera 8 and Copepoda 1),
Arcak and Altındağ (2000) 18 (Rotifera 10, Cladocera 5 and Copepoda 3), Altındağ and Yiğit (2002) 17 (Rotifera 10, Cladocera 5 and Copepoda 2), Girgin et al. (2004) 7 (Rotifera 6 and Copepoda 1) zooplankton
taxa. The higher number of cladoceran and rotifer species in contrast to lower numbers in the present study should be due to coverage of drifted material from the streams and other freshwater sources like Soğanlı Pond. In our study, intrusion from other environments was prevented by selection of stations at least 1 km off the coastline. But there are recordings from springs and mouths of streams in previous studies. Thus, indeed, the actual zooplankton of Lake Burdur is relatively poor as shown by our results.
Normally, increase in the trophic levels is characterized by increase in number and abundance of rotifers in zooplankton (Harper, 1992). But the saline (mesohaline) and highly alkaline structure of the lake hindered this change and only tolerant species remained in salty water of the lake. (Halse et al.,
1998; Williams, 1998). So the salinity is more determinative on zooplankton composition than the trophy levels (Hammer, 1986).
In general, the diversity of species is inversely correlated with salinity. There is only a limited list of species found in waters having excess of 10% salinity (Cole, 1983). So the zooplanktonic organisms that really represent the lake consist of the species that are suitable for brackish-salty lakes.
A. burduricus, an endemic of the lake, is the
organism adapted most to the saline-alkaline character of the lake. Rotifera taxa have tolerance to salinity, pH, and hardness, although planktonic rotifer genus
Brachionus is mainly calciphilic (Cole, 1983).
According to Koste (1978), C. adriatica is euryhaline
and found in waters with pH 5.5-10.5. The pH of the Lake Burdur ranges between 8.5-9.6 and according to Arcak and Altındağ (2000) and it is a suitable habitat for this species, which was mentioned to be ‘frequent' in their study concerning the relative abundance of zooplankton. However, in this study, C. adriatica and
copepod species other than A. burduricus were found
as extremely rare and therefore density level for the species was not calculated.
Salinity is one of the important factors affecting the distribution of aquatic invertebrate species (Halse
et al., 1998). In hyposaline (3-20 ppt) and mesosaline
(20-50 ppt) waters, halotolerant forms become much less and most of the biota comprises taxa adapted to inland saline waters (Hammer, 1986; Halse et al.,
1998). The occurrence and species compositions of cladoceran zooplankton are related to ambient Ca concentrations, pH, total phosphorus, chlorophyll a
and predators. Ambient Ca concentrations appeared to influence the distribution of Daphnia species
(Wærvågen et al., 2002). There are several
halotolerant groups among cladocerans (e.g. Moina mongolica, Daphniopsis pusilla) (Williams, 1998).
253
biotic–abiotic conditions were suitable, there was no cladoceran species in Lake Burdur, and this is explicable by high salinity (19 ppt) that limits the distribution of cladocerans.
Maximum conductivity value, measured as 22.5 (Merter et al., 1986) and as 29.4 mS.cm-1 in 2000
(Altınkale, 2001), was found as 30.5 mS.cm-1 in this study. It is believed that the increase in conductivity is among the factors promoting productivity in freshwater systems (Harper, 1992) and it also correlates with density of the zooplankton, which indicates eutrophication (Radwan, 1984). Yet, sometimes, in lakes with high conductivity levels there can be low biological production, and thus zooplanktonic indication of eutrophy may not be present in such waters (Radwan, 1984).
The high values of zooplankton abundance in shallow lakes indicate their eutrophic and
hypereutrophic condition (Echaniz et al.,2006) but in
such cases the diversity of plankton communities is
also characteristically low (Wetzel, 2001). In the
previous studies that were performed in Lake Burdur (Arcak and Altındağ, 2000; Girgin et al., 2004;
Kazancı et al., 1988; Ongan et al.,1972) and in the
current study the recorded numbers of zooplankton species were relatively low, not as a result of low or high tropic level of the lake, but due to the fact that low number of species were able to tolerate high alkalinity, conductivity, and salinity. However, since the lake is mentioned as α-β mesosaprobic (Girgin et al., 2004), it was expected to inhabit more species. As
the current tropic level is to be classified as eutrophic according to the parameters analyzed (Table 1, Figures 3 and Figure 4), the low diversity among zooplanktons is explainable.
When we examine the distribution of zooplankton sampling stations: A. burduricus was
observed as the most dominant species in the station I, which is very deep (approximately 70 m) (Figure 8). Although the depth of this station provides a refuge for A. burduricus from birds and fish, especially in
thermal stratification period, the oxygen deficiency has an effect on keeping the fish away from this site. Additionally, Timur et al. (1988) mentioned that the
H2S level limits the biological life in hypolimnion and deep mud in Lake Burdur.
Rotifers are consistently found in station II, which is very shallow (5-6 m), both A. burduricus and
rotifers are found approximately at the same consistency in station III, which is of medium-depth (15-20 m) (Figure 8). Rotifers were found more consistently in stations II and III as these are shallow and consist high amounts of organic material. Harper (1992) and Radwan (1984) mentioned that the rotifers are dominant zooplankton groups in the environments rich in organic materials. According to our observations, in the station II there is high avian pressure and in the station III drainage water mixture is the source of organic material.
In our study, general zooplankton distribution in
Lake Burdur is found as follows; 50%; H. fennica,
41% A. burduricus, and 9% B. plicatilis (Figure 9).
No relation could be found between densities of the rotifers and A. burduricus (Figure 6). As the first
group inhabits shallow regions (stations I-II) and the latter is predominantly found in limnetic region (Fig. 10b), this distinctiveness is thought to be caused solely by ecological conditions.
In the previous studies, the rotifers were determined to be dominant (Kazancı et al., 1998;
Girgin et al., 2004). In 1998, the 46.6% of total
zooplankton were A. burduricus (104,000 ind. m-3)
peaking in March and April, while rotifers peaked in June and July (Girgin et al., 2004), and our findings
are concordant with these results.
When the vertical distribution of A. burduricus
was studied during the day; it was found to concentrate in 4 different regions (1-10 m; 10-25 m; 25-35 m and after 35. m), nevertheless the most concentrated region was between 10-25 m (P<0.05). But the nauplius larvae of the species concentrated in 10 m depth throughout the day (P<0.05). The vertical distributions of rotifers during the day was not flexible, and the organisms were found mostly in 0-10 m zone, epilimnion layer (P<0.05) (Figure 10b).
If we generalize the vertical distribution of the zooplankton, the distributions are limited mostly for rotifers and nauplius larvae at 20 m, while adult A. burduricus could be found even below 30 m in low
numbers (P<0.05). But A. burduricus was not found
in hipolimnion (Figure 10b) due to coldness (below 10°C in sampling date), anoxic conditions (Figure 10a) and possibly feed-feeding relations.
As a result of the long history of pollution (due to domestic, agricultural and industrial discharge) (Anonymous, 1998; Green et al., 1996; Kazancıet al.,
1999; Timur et al., 1988), trophic level of the lake
gradually increased (Girgin et al., 2004; Altındağ and
Yiğit, 2002) to its eutrophic stage.
This study, along with the description of zooplankton population features, is unique in presentation of vertical distribution of zooplankton taxa of the lake for the first time. The zooplankton, generally dominated by halotolerant-euryhaline rotifers, show diversification in vertical distribution during thermal stratification period: rotifers concentrate in epilimnion, while A. burduricus is
found mainly within thermocline.
The lake has been surviving dramatic changes in recent years and these changes would also affect zooplankton composition. But there is no concrete data on zooplankton history of the lake. Thus follow up studies are needed to understand actual effects of mentioned changes. Also in future zooplankton studies in the lake, determination of diel vertical migration patterns and vertical distribution effects of the fish predation, thermal stratification and chlorophyll a would contribute to further
254
Acknowledgements
This study was supported by the Süleyman Demirel University Scientific Research Fund (Project no: 03-M-647). The authors also are thankful to Dr. Ümit KEBAPÇI (Mehmet Akif Ersoy University) for his suggestions on the improvement of English text.
References
Altındağ, A. and Yiğit, S. 2002. The Zooplankton Fauna of Lake Burdur. Ege University Journal of Fisheries & Aquatic Sciences. 19 (1-2): 129-132.
Altınkale, S. 2001. Hydrogeochemical and Isotope Geochemical Comparison of the Eğirdir and Burdur Lakes. MSc. Thesis. Isparta: Süleyman Demirel University.
Anonymous. 1993. Wetlands of Turkey. Environment Foundation of Turkey Publications. 398 pp. Ankara. Anonymous, 1998. Turkey’s Environmental Problems’99.
Environment Foundation of Turkey Publications. Ankara, 464 pp.
Anonymous. 2000. Nodularia spumigena (Cyanobacteria) Blooms in Burdur Lake. Limnological Report, Süleyman Demirel University Eğirdir Fisheries Faculty (unpublished).
APHA-Awwa-Wef. 1998. Standard Methods for the Examination of Water and Wastewater. 20th Edition., Washington D.C.
Arcak, S. and Altındağ, A. 2000. Water Quality and Ecologycal Properties of Burdur Lake. Proceedings of International Symposium on Desertification 13-17 June 2000. Konya, Turkey.
Bartram, J. and Balance, R. 1996. Water Quality Monitoring. UNEP/WHO. E&FN SPON Chapman & Hall, London, U.K.
Boyd, C.E. and Tucker, C.S. 1992. Water Quality and Pond Soil Analysis for Aquaculture. Auburn University, Alabama, 183 pp.
Cole, G.A. 1983. Texbook of Limnology. Third Edition. The C. V. Mosby Comp., St. Louis, 401 pp.
Echaniz, S.A., Vignatti, A.M., De Paggi, S.J., Paggi, J.C. and Pilati, A. 2006.Zooplankton Seasonal Abundance of South American Saline Shallow Lakes. Internat. Rev. Hydrobiol., 91(1): 86–100.
Girgin, S., Kazancı, N. and Dügel, M. 2004. On the Limnology of Deep and Saline Lake Burdur in Turkey. Acta Hydrochim. Hydrobiol., 32(3): 189-200.
Goldman, C.R. and Horne, A.J. 1983. Limnology. McGraw-Hill Int. Book Comp. NewYork, 464 pp.
Green, A.J., Fox, A.D., Hilton, G., Hughes, B., Yarar, M. and Salathé, T. 1996. Threats to Burdur Lake Ecosystem. Turkey and its Waterbirds. Particularly the White-Headed Duck Oxyura leucocephala. Biol. Conserv., 76 (3): 241-252.
Halse, S.A., Shiel, R.J. and Williams, W.D. 1998. Aquatic invertebrates of Lake Gregory, north-western Australia, in relation to salinity and ionic composition. Hydrobiologia, 381:15–29.
Hammer, U.T. 1986. Saline Lake Ecosystems of the World.
Dr.W. Junk Publishers, Dordrecht, 632 pp.
Harper, D. 1992. Eutrophication of Freshwaters. Chapman& Hall, London, 327 pp.
Henderson-Sellers, B. and Markland, H.R. 1987. Decaying Lakes. The Origins and Control of Cultural Eutrofication. John Wiley and Sons, Chichester, 254 pp.
Kazancı, N., Girgin, S., Dügel, M. and Oğuzkurt, D. 1998. Researches on Inland Waters of Turkey III: Limnology, Environmental Quality and Biodiversity of Burdur and Acı Lakes. Imaj Press, Ankara, 167 pp. Koste, W. 1978. Rotatoria. Überordnung Monogononta. Die
Rädertiere Mitteleuropas, I. Textband, Berlin, Stuttgart, 673 pp.
Lind, O.T. 1985. Handbook of Common Methods in Limnology. Sec. ed.: Kendall/Hunt Pub. Comp., Dubeque-Iowa, U.S.A., 199 pp.
Merter, Ü., Genç, Ş. and Göksu, Z.L. 1986. Isparta ve Yöresindeki Göllerdeki Su Kalitesi, Fiziksel Kimyasal ve Biyolojik Parametreler. TÜBİTAK Deniz Bilimleri ve Çevre Araştırmaları Grubu, Proje No: ÇAG-45/G, Ankara.
Nümann, W. 1958. Anadolu’nun Muhtelif Göllerinde Limnolojik ve Balıkçılık İlmi Bakımından Araştırmalar ve Bu Göllerde Yaşayan Sazanlar Hakkında Özel Bir Etüd. İstanbul Üniversitesi, Fen Fakültesi, Hidrobiyoloji Araştırma Enstitüsü Yayınları Monografi, Sayı7: 59-63, İstanbul.
Ongan, T., Akdağ, O., Kırgız, T. and Kaftancıoğlu, M. 1972. Burdur, Yarışlı, Karataş ve Beyşehir Gölleri Cladocera (Crustacea) Türleri. İstanbul Üniversitesi Fen Fakültesi, Hidrobioloji Araştırma Enstitüsü Yayınları,12: 1-9.
Radwan, S., 1984. The Influence of Some Abiotic Factors on the Occurrence of Rotifers of Leczna and Wladova Lake District. Hydrobiologia, 112: 117-124.
Şener, E., Davraz, A. and Ismailov, T. 2005. Burdur Gölü Seviye Değişimlerinin Çok Zamanlı Uydu Görüntüleri
İle İzlenmesi. Türkiye Kuvaterner Sempozyumu Turqua-V, İTÜ Avrasya Yer Bilimleri Enstitüsü, 2-5 Haziran 2005. İstanbul, 148.
Timur, M., Timur, G. and Özkan, G. 1988. A Study on Physicochemical and Hydrobiological Changes in Burdur Lake and Its Effects in Living Organisms. Akdeniz University Journal of Fisheries Faculty, 1: 75-104.
Wærvågen, S.B., Nina, A.R. and Hessen, D.O. 2002. Calcium Content of Crustacean Zooplankton Its Potential Role in Species Distribution. Freshw. Biol., 47: 1886-1878.
Wetzel, R.G. 2001. Limnology. Lake and River Ecosystems. Third Edition. Academic Press, 1006 pp. Williams, W.D. 1996. Australian Lakes. F.B. Taub (Ed.),
Lakes and Reservoirs. Ecosystems of the World 23. Elsevier Sci., Netherlands, 499-519.
Williams, W.D. 1998. Salinity as a determinant of the structure of biological communities in salt lakes. Hydrobiologia, 381:191–201.
Yarar, M. and Magnin, G. 1997. Türkiye’nin Önemli Kuş