© 2015 Akelesh Thyagarajan et al.. This is an open access article distributed under the terms of the Creative Commons Attribution License -NonCommercial-ShareAlikeUnported License (http://creativecommons.org/licenses/by-nc-sa/3.0/).
Journal of Applied Pharmaceutical Science Vol. 5 (Suppl 3), pp. 033-039, 2015 Available online at http://www.japsonline.com
DOI: 10.7324/JAPS.2015.510.S6 ISSN 2231-3354
Preparation,
in vitro
Characterization of Transdermal Patch
Containing Atenolol and Hydrochlorothiazide: A Combinational
Approach
Akelesh Thyagarajan*, J. Sam Johnson Udaya Chander, C. Senthil Kumar, Vidya Sreenivasan, R. Venkata Narayanan
RVS College of Pharmaceutical Sciences, Coimbatore, Tamil Nadu, India.
ARTICLE INFO ABSTRACT
Article history:
Received on: 30/07/2015 Revised on: 29/08/2015 Accepted on: 03/10/2015 Available online: 12/11/2015
Background: In the present days, the prevalence of hypertension is potentially increasing. To overcome the effects of this disease, a complex therapeutic regimen is often introduced, but the patient compliance is always questionable. Methodology: To improve patient compliance, a novel approach has to be implemented. Hence, the present study was designed to develop a transdermal patch containing Atenolol and hydrochlorothiazide in combination using blends of different polymeric combinations such as hydroxypropyl methyl cellulose, sodium alginate, and polyethylene glycol. The patches were subjected to physicochemical tests and in-vitro drug release study. Results: Good results were obtained in all the evaluated parameters. The drug release of all formulation followed zero order kinetics. The medicated films also went through primary skin irritation test and the results showed that the films were non-irritant. Conclusion: The developed transdermal delivery system containing Atenolol & hydrochlorothiazide might be a milestone in the combinational therapy of hypertension.
Key words: Transdermal patches, atenolol,
hydrochlorothiazide, diuretic, hypertension.
INTRODUCTION
During the past few years, the ordinary dosage forms are rapidly being replaced by the new and novel drug delivering systems. Amongst these, the controlled release dosage forms have become extremely popular in modern therapeutics because of their advantages over conventional dosage forms. With the advent of new era of pharmaceutical dosage forms, the conventional dosage forms can be duplicated without its harmful effects by using skin as the port of entry of drugs into the body. This is known as transdermal administration and the drug delivery systems are known as transdermal drug delivery system (TDDS) or popularly transdermal patches. This has been established as an integral part of novel drug releasing systems (Singh, 2000). TDDS is a system where medicaments are administered topically as either gels or patches that can deliver drugs for the systemic effects at a predetermined and controlled rate (Brahmankar and Jaiswal, 2009; Vyas and Khar, 2002;
Chopda, 2006; Patel et al., 2006; Aulton, 2004; Chein, 1983).
The TDDS shows certain benefits like increasing bioavailability,
* Corresponding Author Email: [email protected]
increasing therapeutic efficacy, bypassing first pass metabolism, decreasing side effects, and controlled release of drugs thereby increasing the frequency of dosing, which improves patient compliance (Cho and Shin, 2004). Patients with hypertension often take multiple medications. Some studies have suggested that patients fail to adhere to the medication regimen because of the
number of medicines required and duration (Kruse et al., 1991;
Eisen, 1990; Taggart, 1981; Greenberg, 1984; Farmer et al., 1994). The more medications prescribed, the fewer patients adhere to the full treatment regimen. In contrast, the total number of medications taken per day could be reduced if both the combinations were given in a single formulation. Though Joint National Commission 7 (JNC-7) guidelines state a preference for a thiazide diuretics as the initial step for all the patients with uncomplicated hypertension, this is not universally followed, as there are other guidelines which suggest preference for more patient-specific approach (Houston, 2004; Scott and Stowasser, 2003; Sica, 2005). This combinatorial concept was built on the assumption that when two antihypertensive drugs are to be given in a hypertensive patient, then two drugs having different BP-regulating pathways should be
combined and, since JNC-7 state a preference for a thiazide
diuretics, one of the combining drugs should be a thiazide diuretic. Hence, the present study aims to prepare transdermal films that are loaded with both atenolol and hydrochlorothiazide to treat hypertension and to improve patient compliance. Atenolol (A) is a β-blocker and is prescribed widely in diverse cardiovascular diseases such as hypertension, angina pectoris, arrhythmias, and myocardial infarction. Administration of conventional tablets of atenolol has been reported to exhibit fluctuations in the plasma drug levels, resulting in either manifestation of side effects or reduction in drug concentration at the receptor site (Young-Chang, 2010; Modamio, 2000). Hydrochlorothiazide is a Thiazide diuretic drug which is mainly used in treatment of hypertension and edema associated with heart failure and renal and hepatic disorders. It blocks the reabsorption of sodium and chloride ions thereby increasing the quantity of sodium in the distal tubule and the volume of water excreted (The United States Pharmacopeia, 2007). In the present study, a novel strategy was attempted to develop and evaluate transdermal
membranes incorporated with both atenolol and
hydrochlorothiazide with varied ratios of non-irritating and pharmaceutically acceptable polymers such as Soidum Alginate (SA) and hydroxypropyl methyl cellulose (HPMC) in combination with permeation enhancer PEG because PEG is considered as a good permeation enhancing agent, as it increases the fluidity of stratum corneum lipid by increasing the formation of capillary channels (Inayat and Setty, 2009). The purpose was to provide the delivery of drug at a controlled rate across intact skin to achieve a therapeutically effective drug level for a longer duration of time from transdermal patches (Chien, 1987).
MATERIALS AND METHODS
Materials
Hydrochlorothiazide, atenolol, sodium alginate,
polyethylene glycol, electronic digital balance, digital pH meter, vernier caliper, digital melting point apparatus, magnetic stirrer, mechanical stirrer, UV spectrophotometer, Franz diffusion cells, and synthetic cell membrane. Drug-Excipient Interaction Study (Shivakumar et al., 2009; Ubaidulla et al., 2007; Patel, 2009): The drugs Atenolol and Hydrochlorothiazide along with polymers were subjected to infrared (IR) studies using an FTIR spectrophotometer by the KBr pellet method and the spectra were recorded in the
wavelength region of 4000 and 400 cm-1. The procedure consisted
of dispersing the sample in KBr in the ratio of 100:1 and compressed into discs by applying a pressure of 5 tons for 5 min in a hydraulic press. The pellet was placed in the way of light and the spectrum was obtained with principle peaks. The peaks obtained by IR spectroscopy of Atenolol and Hydrochlorothiazide were compared with the standard.
Preparation of Drug Free Patches
Polymers of single or in combination are accurately weighed and dissolved in respective solvent and then casted on a glass surface containing ring with inner radius of 4.425 cm. The
films were allowed to dry overnight at room temperature. Then, the films were separated and noticed for film formations.
Preparation of Drug-Loaded Transdermal Membranes
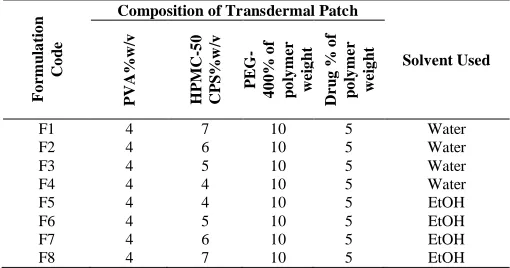
Transdermal membrane was prepared with the polymer polyvinyl alcohol as backing membrane and HPMC-50CPS as dispersion polymer. Atenolol 25 mg and hydrochlorothiazide 12.5 mg was used invariably in all formulations. The composition of the transdermal formulations can be seen in Table 1.
Table 1: Composition of Transdermal Patches.
F o r m u la ti o n C o d e
Composition of Transdermal Patch
Solvent Used P V A %w /v H P M C -50 C P S %w /v P EG -4 0 0 % o f p o ly m e r w e ig h t D r u g % o f p o ly m e r w e ig h t
F1 4 7 10 5 Water
F2 4 6 10 5 Water
F3 4 5 10 5 Water
F4 4 4 10 5 Water
F5 4 4 10 5 EtOH
F6 4 5 10 5 EtOH
F7 4 6 10 5 EtOH
F8 4 7 10 5 EtOH
The matrix-type patches were prepared by first preparing the backing membrane of Polyvinyl Alcohol and dispersing HPMC–50CPS in different proportion in water and ethanol. The backing membrane was prepared and dried for overnight at room temperature. Weighed quantity of atenolol, hydrochlorothiazide, and HPMC with suitable solvent was continuously stirred for one hour. Then, polyethylene glycol (PEG) was added as plasticizer and continuous stirring was continued for another one hour. Then the 5 ml of dispersion containing atenolol/hydrochlorothiazide was withdrawn by a pipette and poured slowly over the previously prepared backing of PVA. By placing an inverted funnel over the glass plate, the solvent was allowed to evaporate at a controlled rate. After drying at room temperature, the membranes were retrieved and evaluated.
Evaluation of Transdermal Patches of Atenolol and Hydrochlorothiazide
Initial drug content
The total content of transdermal patch was placed in a 100 ml volumetric flask and dissolved in water. The solution was filtered through a Whatman filter membrane (0.45µm). The absorbance of the solution was measured against the corresponding blank solution at 225 nm for atenolol and 275 nm for hydrochlorothiazide using UV spectrophotometer (Shimadzu, model UV-1601 PC, Japan).
Patch Weight and Thickness
Weight Uniformity
The prepared patches were dried at 60 C for four hours before testing. A specified area of patch was cut in different parts of the patch and weighed on digital balance. The average weight and standard deviation values were calculated from the individual weights.
Percentage Flatness
Transdermal patches (1 x 1 cm2) were tested for %
flatness and the results were recorded. Lesser standard deviation values indicate that the patches have uniform % flatness.
Folding Endurance
The folding endurance of the patches was determined manually by folding the film repeatedly at the same place until it broke.
Content Uniformity
Presence of Salbutamol in all formulations was analyzed spectrophotometrically at 225 nm and the data are recorded.
Percentage Moisture Content
The prepared membranes were weighed individually and kept in desiccators containing fused calcium chloride at room temperature for 24 hours. After 24 hours, the films were re-weighed and percentage moisture content was determined.
Water Vapor Transmission Rate
Glass vials of equal diameter were used as transmission cell (Kulkurni, 2000). These transmission cells were washed thoroughly and dried completely. About 1 g of fused calcium chloride was taken in cells and the polymeric patches measuring 1
cm2 area were fixed over the brim with the help of an adhesive.
The cells were weighed accurately and initial weight was recorded, and then kept in a closed desiccator containing saturated solution of potassium chloride to maintain 80-90% RH. The cells were taken out and weighed after 24 hrs. The amount and rate of water vapor transmitted was calculated by the difference in weight using the formula W V T = WL/S where, W is water vapor transmitted in mg, L is thickness of the film in mm, S is exposed surface area in cm2. Water vapor transmission rate is usually
expressed as the number of grams of moisture gained/hr/cm2.
In Vitro Dissolution Studies
The in-vitro release was carried out with the egg membrane using Franz diffusion cell. The cell consists of two chambers, the donor and the receptor compartment. The donor compartment was open at the top and was exposed to atmosphere. The temperature was maintained at room temperature and receptor compartment was provided with sampling port. The diffusion medium used was Phosphate Buffered Saline (PBS) (pH 7.4). The drug containing film with a support of backing membrane was kept in the donor compartment and was separated from the receptor compartment by egg membrane. The egg membrane was
previously soaked for 24 hours in PBS. The donor and receptor compartments were held together using a clamp. The receptor compartment with 15 ml of PBS was maintained at room temperature and stirred with magnetic stirrer, to prevent the formation of concentrated drug solution layer below the dialysis membrane (Vlassios et al., 1995; Weiyong et al., 2005; Narasimha
Murthy et al., 2001). Samples of 3 ml were collected at
predetermined time intervals and replaced with fresh buffer. The concentration of drug was determined by UV spectrophotometer at 225 nm and 275 nm for atenolol and hydrochlorothiazide respectively.
Primary Skin Irritation Study (Bureau of Indian Standards, 1997)
The primary skin irritation test was performed for prepared transdermal films after approval of the protocol by the Institutional Animal Ethics Committee (IAEC) and animal care was taken as per the guidelines of Committee for the Purpose of Control and Supervision of Experiments on Animals (CPCSEA), Government of India (Registration No. 1012/c/06/CPCSEA). Skin irritation test was performed since skin is a vital organ through which drug is transported. Skin irritation studies were performed on healthy Albino rats of average weight of 150 mg to 200 mg.
The dorsal surface (3 cm2) of the rat was cleaned, and the hair was
removed by shaving. The skin was cleansed with rectified spirit.
The best formulation (F7) was placed over the skin with the use of
adhesive tape and was removed after 24 hrs. The resulting skin reaction was evaluated and compared with control group which was placed with a placebo film.
RESULTS AND DISCUSSION
The physicochemical compatibility of the drugs and the polymer was established through FTIR studies. In the physical mixture of hydrochlorothiazide and atenolol with HPMC, sodium alginate, and polyethylene glycol, the chief absorption bands of the drugs indicate that there is an absence of physical and chemical interactions among both active component and the excipients, which is shown in table 2.
Partition coefficient determination study of Atenolol and hydrochlorothiazide was carried out with n-octanol and pH 7.4 phosphate buffer. The partition coefficient [log P(octanol] of atenolol was found to be 0.230 and hydrochlorothiazide was found to be 0.855. The partition coefficient value indicates that the drug has required lipophilicity.
All the prepared patches compiled with pharmacopoeial limits for content uniformity. The prepared patches had thickness ranging from 0.1800 mm to 0.2100 and their weight was uniform, varying from 0.0313 g/patch to 0.0426 g/patch. These ranges are suitable for application to the skin as reported earlier. Almost all patches prepared has >99.5% flatness. The optimized patch F7 contained 99.76±0.14% of Atenolol and 99.68±0.16% of Hydrochlorothiazide. These are all depicted in Table 3.
The folding endurance values of matrix films were found within 277 number of folds, indicating good strength and
elasticity. Within these films, the optimized patch F7exhibited the
optimal folding endurance 271.33±3.00. The percentage moisture
uptake was found in formulation F9 with high rate of moisture
absorption (1.60± 0.01). The formulations F2 and F3 show higher
value of moisture loss 1.02± 0.00. The formulation F6 has shown
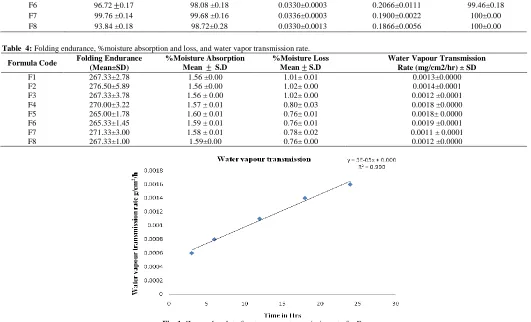
maximum water vapor transmission of 0.0019 ±0.0001 and
formulation F7 shows less water vapor transmission of 0.0011 ±
0.0001. These are all indicated in Table 4.
The optimized patch has the water vapour transmission
rate of 0.0011±0.0001with r2=0.990, which is shown in Figure 1.
Table 2: Drug Excipient Compatibility Results.
Atenolol Atenolol with excipients Hydrochlorothiazide Hydrochlorothiazide with excipients
O-H 3336.62 3336.62 - -
H-N 3336.62 3336.62 3360.73 3361.69
C-C 3148.58 3148.58 - -
C-H 2917.13 2917.13 - -
C=O 1635.52 1635.52 - -
Conjugated C=C 1612.38 1612.38 1601.77 1604.00
C-O 1179.39 1179.39 - -
C-N 1035.70 1035.70 - -
O=S=O 3382.00 3388.00
Table 3: Drug content, physical characterization, %flatness of salbutamol transdermal patches.
Formula Code Drug content Aten
(%±SD)
Drug content HTZ (%±SD)
Uniformity of weight (gm) (Mean±SD)
Uniformity of thickness (mm) (Mean±SD)
Percentage Flatness (Mean±SD)
F1 99.68±0.21 99.36 ±0.18 0.0426±0.0067 0.2100±0.0067 100±0.00
F2 96.72± 0.31 98.88 ±0.21 0.0336±0.0022 0.2100±0.0067 100±0.00
F3 95.7±60.12 98.56 ±0.19 0.0313±0.0045 0.1900 ±0.0133 100±0.00
F4 97.72± 0.22 98.32 ±0.26 0.0333±0.0000 0.2000 ±0.0045 99.82±.18
F5 94.84±0.24 95.12 ±0.22 0.0336±0.0003 0.1800±0.0155 99.64±0.00
F6 96.72 ±0.17 98.08 ±0.18 0.0330±0.0003 0.2066±0.0111 99.46±0.18
F7 99.76 ±0.14 99.68 ±0.16 0.0336±0.0003 0.1900±0.0022 100±0.00
F8 93.84 ±0.18 98.72±0.28 0.0330±0.0013 0.1866±0.0056 100±0.00
Table 4: Folding endurance, %moisture absorption and loss, and water vapor transmission rate.
Formula Code Folding Endurance (Mean±SD) %Moisture Absorption Mean ± S.D %Moisture Loss Mean ± S.D Water Vapour Transmission Rate (mg/cm2/hr) ± SD
F1 267.33±2.78 1.56 ±0.00 1.01± 0.01 0.0013±0.0000
F2 276.50±5.89 1.56 ±0.00 1.02± 0.00 0.0014±0.0001
F3 267.33±3.78 1.56 ± 0.00 1.02± 0.00 0.0012 ±0.0001
F4 270.00±3.22 1.57 ± 0.01 0.80± 0.03 0.0018 ±0.0000
F5 265.00±1.78 1.60 ± 0.01 0.76± 0.01 0.0018± 0.0000
F6 265.33±1.45 1.59 ± 0.01 0.76± 0.01 0.0019 ±0.0001
F7 271.33±3.00 1.58 ± 0.01 0.78± 0.02 0.0011 ± 0.0001
F8 267.33±1.00 1.59±0.00 0.76± 0.00 0.0012 ±0.0000
Table 5 indicates the cumulative percentage drug release of various formulations. The cumulative percentage of drug released in 12 hours was high for formulation F7, which has shown the drug release of 82.879% and 73.007% respectively for atenolol and hydrochlorothiazide.
Table 5: Data for in vitro drug release of all formulation.
Formula Code Time (h) Cumulative %release of drug (%)
A H
F1 11 96.403 94.416
F2 11 95.561 93.413
F3 11 96.652 94.066
F4 11 94.452 95.716
F5 11 94.093 93.642
F6 10 94.562 96.356
F7 12 82.879 73.007
F8 12 79.623 71.980
The cumulative percentage drug release profile of various formulations is shown in Figure 2 and Figure 3.
Fig. 2: Cumulative % of drug release of Atenolol from F1 to F8.
Fig. 3: Cumulative % of drug release of Hydrochlorothiazide from F1 to F8.
The kinetics of atenolol and hydrochlorothiazide diffusion profiles was found out by plotting different graphical models. This can be explained as:
1. Korsemeyer and Peppas model indicates the mechanism
of drug release from the formulation is by diffusion.
2. The release kinetics from optimized formulation F7
followed zero order release kinetic (r2=0.987) and
(r2=0.995) for Atenolol and Hydrochlorothiazide
respectively. The ‘n’ value of Peppas equation was found
to be 0.472 for Atenolol and 0.338 for
Hydrochlorothiazide, which shows that the release from
optimized formulation F7 follows Fickian transport. This
can be shown in Table 5.
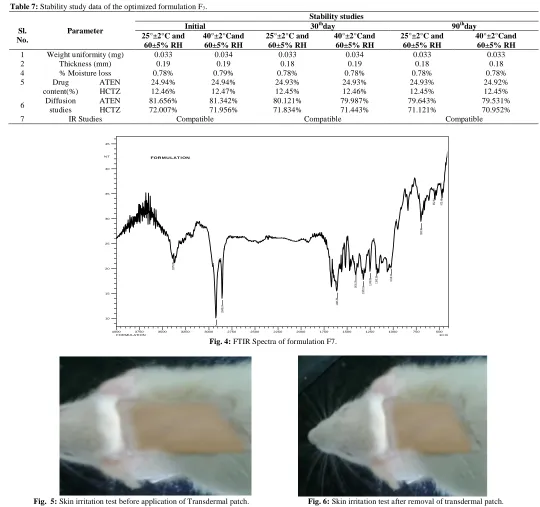
FTIR studies of formulation F7 was done and it was concluded that there was no interference in the functional group of
the atenolol and hydrochlorothiazide in formulation F7 and was
compatible both physically & chemically. This is depicted in Figure 4 and Table 6.
Table 6: IR compatibility Results for formulation F7.
FREQUENCY BAND
(cm-1) GROUP RESPONSIBLE
3404 O=S=O
3365 O-H
3360 H-N
3168 C-C
2916 C-H
1665 C=O
1606 Conjugated C=C (aromatic)
1180 C-O
1018 C-N
Stability study of the optimized formulation F7 was carried out for three months as per ICH guidelines. The transdermal system was analyzed for its physical parameters and drug content.
From the results, it is observed that the compatibility studies do not show any interaction with the physical appearance and there was no change in the drug content and the in vitro drug
release results were reproducible. It can be concluded that F7
formulation was stable under room temperature and provides satisfactory results after 90 days time period. This is depicted in Table 7.
The primary skin irritation studies revealed that neither the adhesive nor the drug caused any noticeable irritation on the rat’s skin throughout the study. The results are depicted in Table 8.
Table 8: Score of skin irritation studies.
TEST SKIN REACTIONS SCORE
ERYTHEMA
Very slight erythema 0
Well defined erythema 0
Moderate to severe erythema 0
Severe erythema 0
Total possible erythema score 0
EDEMA
Very slight edema 0
Well defined edema 0
Moderate to severe edema 0
Severe edema 0
Total possible edema score 0
Total score for primary skin irritation 0
The figures 5 and 6 show the status of rat’s skin before application and after removal of salbutamol transdermal patch.
0 20 40 60 80 100 120
0 5 10 15
C
u
m
u
la
ti
v
e
%
D
r
u
g
r
e
le
a
se
Time in Hrs
Cumulative % Drug release of Atenolol from F1 to F8
F1
F2
F3
F4
F5
F6
F7
F8
0 20 40 60 80 100 120
0 5 10 15
C
u
m
u
la
ti
v
e
%
D
r
u
g
r
e
le
a
se
Time in Hrs
Cumulative % Drug release of Hydrochlorothiazide from F1 to F8
F1
F2
F3
F4
F5
F6
F7
DISCUSSION
Transdermal drug delivery system is an alternative route of administration of systematically acting drugs since this route of administration has the advantage of avoiding the first pass metabolism, minimizing the side effects, and improving the physiological and pharmacological response of the drugs and most importantly it gives patient compliance.
REFERENCES
Abhishek Singh. The Use of Controlled Release Technology in Drug Delivery. MURJ. 2000;2: 56-58.
Bureau of Indian Standards. 1997. Indian Standard Institute. New Delhi. No 4011,273.
Chien YW. 1987. Transdermal Therapeutic Systems in Controlled Drug Delivery: Fundamentals and Applications, J.R. Robinson and V.H.L. Lee, Eds. (Marcel Dekker, Inc., NY, 2nd ed. 523– 552.
Cho CW and Shin SC. Enhanced transdermal delivery of atenolol from the ethylene-vinyl acetate matrix International journal of Pharmaceutics, 2004;287:67.
DM Brahmankar & SB Jaiswal. 2009. Biopharmaceutics and Pharmacokinetics, Vallabh Prakashan, Delhi, II ed. pp. 495-501.
Eisen SA, Miller DK, Woodward RS, Spitznagel E, Pzybeck TR: The effect of prescribed daily dose frequency on patient medication compliance. Arch Intern Med, 1990;150:1881-1884.
Table 7: Stability study data of the optimized formulation F7.
Sl. No.
Parameter
Stability studies
Initial 30thday 90thday
25°±2°C and 60±5% RH
40°±2°Cand 60±5% RH
25°±2°C and 60±5% RH
40°±2°Cand 60±5% RH
25°±2°C and 60±5% RH
40°±2°Cand 60±5% RH
1 Weight uniformity (mg) 0.033 0.034 0.033 0.034 0.033 0.033
2 Thickness (mm) 0.19 0.19 0.18 0.19 0.18 0.18
4 % Moisture loss 0.78% 0.79% 0.78% 0.78% 0.78% 0.78%
5 Drug
content(%)
ATEN 24.94% 24.94% 24.93% 24.93% 24.93% 24.92%
HCTZ 12.46% 12.47% 12.45% 12.46% 12.45% 12.45%
6 Diffusion studies
ATEN 81.656% 81.342% 80.121% 79.987% 79.643% 79.531%
HCTZ 72.007% 71.956% 71.834% 71.443% 71.121% 70.952%
7 IR Studies Compatible Compatible Compatible
Fig. 4: FTIR Spectra of formulation F7.
Fig. 5: Skin irritation test before application of Transdermal patch. Fig. 6: Skin irritation test after removal of transdermal patch.
500 750 1000 1250 1500 1750 2000 2250 2500 2750 3000 3250 3500 3750 4000
1/cm 10
15 20 25 30 35 40 45 %T
33
79
.0
5
29
16
.1
7
28
48
.6
7 1606
.5
9
14
05
.0
5
13
20
.1
8 1246
.8
9
11
80
.3
5
10
18
.3
4
69
3.
36
55
2.
57
47
3.
49
FORMULATION
Farmer KC, Jacobs EW, Phillips CR: Longterm patient compliance with prescribed regimens of calcium channel blockers. Clin Ther,16:316-326, 1994.
G Chopda. 2006. Transdermal delivery system, a review, Pharmainfo.net. accessed on 12th January 2015.
Greenberg RN: Overview of patient compliance with medication dosing: a literature review. Ciin Ther, 6:592-599, 1984.
Houston MC. ALLHAT debate: diuretics are not preferred, first-line initial therapy for hypertension. Arch Intern Med, 2004;164:570– 571. [PubMed: 15006839] author reply 571–572.
Inayat BP, Setty CM. Chemical penetration enhancers for transdermal drug delivery systems, Trop. J. Pharm. Res., 2009; 8:
173-179.
Kruse W, Eggert-Kruse W, Rampmaier J, Runnebaum B, Weber E: Dosage frequency and drug-compliance behavior: a comparative study on compliance with a medication to be taken twice or four times daily Eur] Clin Pharmacol, 1991; 41:589-592.
Kulkurni Raghavendra, Doddaya H, Marihal SC, Patiln CC and Habhu PV. Comparative Evaluation of Polymeric films for Transdermal Application. The East.Pharma., 2000; 516: 109-111.
ME Aulton. 2002. Pharmaceutics, The science of Dosage form Design. Elsevier. Churchill Livingstone, pp. 499-533.
Modamio P, Lastra CF and Marino EL. A comparative in vitro study of percutaneous penetration of betablockers in human skin. International Journal of Pharmaceutics, 2000;194:249–259.
Patel RP, Patel G, Baria A. Formulation and evaluation of transdermal patch of aceclofenac. Int J Drug Deliv 2009; 1:41-51.
PB Patel, A Chaudhary, and GA Gupta. Recent progress in active transdermal drug delivery technologies, Pharmainfo.net. 10th June 2006, pp. 3-12.
Scott I, Stowasser M. Are thiazide diuretics preferred as first-line therapy for hypertension? An appraisal of The Antihypertensive and Lipid-lowering Treatment to Prevent Heart Attack Trial (ALLHAT). Intern Med J., 2003;33:327–330.
Shivakumar HN, Jamakandi VG, Mulla JS, Vinay BL. Formulation, characterization and evaluation of matrix-type transdermal patches of a model antihypertensive drug. Asian J Pharm, 2009; 3:59-64.
Sica DA. Diuretics should continue to be one of the preferred initial therapies in the management of hypertension: the argument against. J Clin Hypertens (Greenwich), 2005;7:117–120.
S Narasimha Murthy, Shobha Rani and R Hiremath. Drug Dev Ind Pharm, 2001; 27 (10): 1057-1062.
SP Vyas, RK Khar. 2005. Controlled Drug Delivery Concepts and Advances, Vallabh Prakashan, Delhi. pp. 411-447.
Taggart AJ, Johnson GD, McDevitt DG: Does the frequency of daily dosage influence compliance with digoxin therapy? Br J Clin Pharmacol, 1:31-34,1981.
The United States Pharmacopeia. 2007. 30th edition, The National Formulary, 25th edition, The Official Compendia of Standards; The United States Pharmacopeial Convention, Inc., Asian Edition: Washington, D.C. pp. 1375–1376, 1613–1614, 2287–2288, 3062–3063, 3445–3448.
Ubaidulla U, Reddy MVS, Ruckmani K, Ahmad FJ, Khar RK. Transdermal therapeutic system of carvedilol: effect of hydrophilic and hydrophobic matrix on in vitro and in vivo characteristics. AAPS PharmSciTech., 2007; 8(1):E13-20.
Vlassios Andronis, Mounir S Mesiha and Fotios M Plakogiannis. Eur J Pharm Sci., 1995; 70 (4): 301–306.
Weiyong Li, David Nadig, Henrik T Rasmussen, Kudan Patel and Tridarsh Shah. J Pharmaceut Biomed., 2005; 37 (3): 493-498.
Young-Chang Ah, Jin-Kyu Choi, Yang-Kyu Choi, Han-Moi Ki and Joon-Ho Bae. A novel transdermal patch incorporating meloxicam: In vitro and in vivo characterization. International Journal of Pharmaceutics, 2010; 385(1-2):12-19.
YW Chein. 1997. Novel drug delivery systems, Marcel Dekker, New York, ed. II, revised and expanded, pp. 301-380.
How to cite this article: