Patron: Her Majesty The Queen Rothamsted Research Harpenden, Herts, AL5 2JQ
Telephone: +44 (0)1582 763133 Web: http://www.rothamsted.ac.uk/
Rothamsted Research is a Company Limited by Guarantee Registered Office: as above. Registered in England No. 2393175. Registered Charity No. 802038. VAT No. 197 4201 51.
Rothamsted Repository Download
A - Papers appearing in refereed journals
Menezes-Blackburn, D., Zhang, H., Stutter, M., Giles, C. D., Darch, T.,
George, T. S., Shand, C., Lumsdon, D., Blackwell, M. S. A., Wearing, C.,
Cooper, P., Wendler, R., Brown, L. and Haygarth, P. M. 2016. A Holistic
Approach to Understanding the Desorption of Phosphorus in Soils.
Environmental Science & Technology. 50 (7), pp. 3371-3381.
The publisher's version can be accessed at:
•
https://dx.doi.org/10.1021/acs.est.5b05395
The output can be accessed at:
https://repository.rothamsted.ac.uk/item/8v364
.
© 25 February 2016. Licensed under the Creative Commons CC BY.
A Holistic Approach to Understanding the Desorption of Phosphorus
in Soils
Daniel Menezes-Blackburn,*
,†Hao Zhang,*
,†Marc Stutter,
‡Courtney D. Giles,
‡Tegan Darch,
§Timothy S. George,
‡Charles Shand,
‡David Lumsdon,
‡Martin Blackwell,
§Catherine Wearing,
†Patricia Cooper,
‡Renate Wendler,
‡Lawrie Brown,
‡and Philip M. Haygarth
††Lancaster Environment Centre, Lancaster University, Lancaster, LA1 4YQ, U.K. ‡The James Hutton Institute, Aberdeen AB15 8QHScotland, U.K.
§Rothamsted Research, North Wyke, Okehampton, Devon EX20 2SB, U.K.
*
S Supporting InformationABSTRACT: The mobility and resupply of inorganic phos-phorus (P) from the solid phase were studied in 32 soils from the UK. The combined use of diffusive gradients in thin
films (DGT), diffusive equilibration in thin films (DET) and the “DGT-induced fluxes in sediments” model (DIFS) were adapted to explore the basic principles of solid-to-solution P desorption kinetics in previously unattainable detail. On average across soil types, the response time (Tc) was 3.6 h, the desorption rate constant (k−1) was 0.0046 h−1, and the desorption rate was 4.71 nmol l−1s−1. While the relative DGT-induced inorganic Pflux responses in thefirst hour is mainly a function of soil water retention and % Corg, at longer times it is a function of the P resupply from the soil solid phase. Desorp-tion rates and resupply from solid phase were fundamentally
influenced by P status as reflected by their high correlation with P concentration in FeO strips, Olsen, NaOH−EDTA and water extracts. Soil pH and particle size distribution showed no significant correlation with the evaluated mobility and resupply parameters. The DGT and DET techniques, along with the DIFS model, were considered accurate and practical tools for studying parameters related to soil P desorption kinetics.
■
INTRODUCTIONModern agriculture is dependent on phosphorus (P) fertilizer applications to maintain their productivity. The application of P fertilizer in soil is an inefficient practice since, in general, just a small fraction of the applied P is taken up by plants and represents an inadequate use of finite mineral resources.1 Phosphorus is perhaps, among all the essential plants macro-nutrients, the one with most limited bioavailability in soils.2 To ensure optimal plant growth, P fertilizers are applied to agricultural soils in excess of plant requirements to overcome soil P fixation processes and maintain soil solution P at sufficient levels for plant growth.3The use of P in excess of crop require-ments and the inefficient acquisition of soil P by plants have led to an accumulation of a largely unavailable pool of soil P as well as the eutrophication of receiving water courses.
Phosphorus from freshly added P fertilizer adsorbs to soil particles, displacing other anions with lower affinity to the surface of the soil solid phase.3Precipitation with metals and their oxy/ hydroxides also plays an important role in the short term (hours to days)fixation of soil P.4The reduced mobility of P in soils is one of the main factors that influences its limited availability.5 Differences in soil mobility and P fixing capacity are generally
assumed to be a function of soil type and the associated surface properties of their minerals. Phosphorus mobility in soils has been commonly studied by quantifying P in different extracts as a way of assessing its lability (availability). Lability is defined as the likelihood of P undergoing a change of state; in this study it is generally referred to as the process of P desorption from the surface of soil particles induced by the depletion of solution concentration (e.g., due to the P uptake by plants). The P desorbed to soil solution is therefore assumed to be readily plant-available. In this study we explore the use of diffusive gradient in thinfilms (DGT) and diffusive equilibrium in thinfilms (DET) as tools to assess intrinsic P mobility properties of different agricultural soils. The similarities of this system to a plant root and its usefulness as“plant proxy”to study bioavailability was reviewed by Degryse et al. (2009).6Better knowledge of these mobility properties will allow better understanding and manage-ment of the administration of appropriate amounts of P for
Received: November 2, 2015
Revised: February 22, 2016
Accepted: February 24, 2016
Published: February 25, 2016
Article
pubs.acs.org/est provided the author and source are cited.
Downloaded via ROTHAMSTED RESEARCH LTD on January 28, 2019 at 09:42:05 (UTC).
agricultural production, while minimizing environmental losses and optimizing P inputs.
It is well established that plant P uptake is limited by its diffusion and resupply from solid phase in soils.5The combined use of DGT and DIFS offer a unique opportunity to assess the basic principles of P movement through soil in previously unattainable detail.7,8Although the sorption/desorption of P has been studied on many model clays and soils, there is still limited knowledge of the P geochemical response to perturbations in natural conditions (e.g., mineral and organic fertilizer applica-tion, tillage systems, crop type, irrigaapplica-tion, etc.), including how soil properties may drive the variations in its response to these perturbations.
The specific aims of this study were (a) to evaluate the use of DGT and DET techniques, and the DIFS model, as tools to estimate the variability of P distribution coefficients, (de)sorption rate constants, depletion distance, and other parameters reflecting P resupply from soil solid phase across a range of 32 UK soils; and (b) to contrast the data obtained by DGT, DET, and DIFS to standard soil P tests, physical properties, % organic C, oxalate extractable Fe, Al, and pH in order to evaluate their relative contribution to P mobility in agricultural soils. More broadly, the work aimed to develop and apply this new approach of resolving and understanding soil phosphorus exchange and release kinetics.
Theory.The DGT device contains a binding layer (P sink) and a diffusive layer that modulates the diffusion of P from soil solution. The time-averaged P concentration (PDGT) in the soil solution at the outer surface of the DGT device is calculated from the P mass accumulated on the DGT biding layer using Ficḱs law of diffusion. The theory behind the calculation of DGT parameters can be found in Zhang et al. (1995).15Using PDGT, a soil effective concentration (PE) can be calculated, accounting for both the solution concentration and the adsorbed concentration that can be mobilized by depleting soil solution P. The PEis calculated from PDGTusing the Rdiff ratio, which is estimated using a numerical model of the DGT-soil system (DIFS model) by setting input parameters emulating diffusion supply only. The theory behind the PEcalculation has been previously discussed by Zhang et al. (2001; 2004).9,10In this study we are also interested in solving the DIFS model using empirically measured input parameters in order to estimate the variability of response time of the system, (de)sorption rate constants, P depletion distance and other parameters reflecting P resupply from solid to solution phase across a range of different soils.
■
MATERIAL AND METHODSSoil Samples and Characterization.Samples used in this study were collected from 32 representative UK soils and characterized by Stutter et al. (2015).11These had been pre-viously collected across UK sites comprising mostly arable, grassland and several moorland topsoils in a study of soil P speciation and cycling according to soil organic C, land use and assumed P fertilizer inputs. As part of this earlier study, characterization included soil pH, oxalate extractable Al and Fe, P saturation index (Psat) soil organic carbon, microbial biomass P, total P and inorganic P in Olsen, NaOH, citric acid and water extracts. This detailed characterization was used here to draw interrelations between DGT-based parameters and the phys-icochemical background properties studied by Stutter et al. (2015).11Please refer to the original paper for the methodo-logical details of the mentioned parameters.
Gel Preparation and Assembly of DGT and DET Devices.DGT cylindrical devices designed for soil deployment (DGT Research Ltd., Lancaster-UK) consisted of a binding and a diffusive gel layer tightly packed into a plastic support comprised of a backing plate and a front plate with an exposure window (A= 2.54 cm2). Diffusive gels (0.78 mm) were placed on top of a binding layer (gel containing ferrihydrite) and a 0.13 mm thick poly(ether sulfone) filter (0.45μm) was placed on top of the diffusive gel for physical protection. The filter layer has been shown to behave as an extension of the diffusive layer.12The DET devices contained only the diffusive gel (0.78 mm) and the membranefilter tightly packed into a plastic support with similar dimensions to the ones used for the DGTs.
The diffusive gels containing acrylamide cross-linker (DGT Research Ltd., Lancaster-UK) were prepared and cast according to published procedures.12To prepare the ferrihydrite gel for the binding layer, diffusive gels (0.78 mm) were incubated for 2 h in a 0.1 mM FeCl3aqueous solution to allow uniform distribution of Fe inside and outside of the gels.13Each gel was then placed in a freshly prepared 0.05 M 2-(N-Morpholino)ethanesulfonic acid (MES) pH 6.7 buffer for 30 min to allow the ferrihydrite to precipitate. The gels were then washed 3 times every 2 h with reagent grade water and stored at 4 °C in 0.01 M NaNO3 solution.
DGT Deployment. Soil samples (150 g air-dried) were adjusted to approximately 50% water holding capacity (WHC) with ultrapure water (18.2 MΩcm) 3 days before DGT and DET deployment. 24 h before deployment, the soil slurry was pre-pared by mixing and continuously adding ultrapure water until maximum retention (MR) was reached. A visual assessment of soil malleability and the glistening of water on the soil surface was used to determine MR. This subjective criteria of setting maximum water retention (or near maximum) in the slurry was verified in several pretests. In the cases where too much water was added, liquefying the sample or leaving afilm of water on the surface of the slurry, more soil was added to the mixture, and the whole procedure was repeated to those cases using the correct moisture content. These criteria were used for 30 of the 32 used soils; however, they were not suitable for Dartmoor and Tentsmuir soils. Dartmoor is a highly organic (44% organic C), low density (0.38 g cm−3), and very high porosity (0.87 v/v) leading to high water retention during the slurry preparation. Because soil glistening and plasticity were not obvious criteria for this soil, the optimum slurry retention was determined by pressing the organic matrix to check its saturation. Tentsmuir, on the other hand, is a sandy soil and optimum slurry retention was determined as the maximum moisture before a freefilm of water could be formed on the surface of the mixture. For each soil, three independent slurry preparations were made, and for each slurry preparation 2 independent DGT and DET deployments were performed.
In all cases, the soil pores are assumed to befilled with water and no air was trapped in the soil slurry, the final moisture concentration was used to determine the particle concentration (ratio between dry weight and soil solution), porosity (% of volume occupied by water) and tortuosity using the equation proposed by Boudreau (1996).7 Physical properties of the samples are displayed inTable 1. DGT devices were deployed after 24 h by gently pressing them against the soil slurry while ensuring complete surface contact. The air temperature was accurately monitored every hour and averaged for use in further calculation of diffusive coefficients.
After 24 h of deployment the DGT and DET devices were removed and rinsed with ultrapure water to remove any adhering soil particles. The ferrihydrite gels from the DGTs and the diffusive gels from the DETs were retrieved and eluted with 2 mL of 0.25 M H2SO4 solution overnight before analysis. Three nondeployed DGT and DET “blanks” were prepared concurrently with each deployment and treated identically to the devices deployed on the soil samples. The soil slurry was centrifuged at 5000 rpm for 15 min in 50 mL tubes in order to separate the pore water from solid matrix. The concentration of the molybdate-reactive P (inorganic P) in the DGT and DET eluents as well as in the pore water extract (Ppw) was measured colorimetrically as described by Murphy and Riley (1962).14The reaction volumes proportionally reduced to a
final 240μL in order to be developed in 96 wells microplates and were read on a Multiskan spectrophotometer (Thermo Fisher Scientific Inc., UK). Total phosphorus was measured by inductively coupled plasma mass spectrometry (XSERIES 2 ICP-MS, Thermo Fisher Scientific Inc., Hemel Hempstead, UK) and the molybdate-unreactive P in DGT and DET ex-tracts was estimated as the difference between the total P and the molybdate-reactive P (Pi); this solution molybdate unreactive P is hereby termed Po.
Calculation of PDGT, PE, Kd, Rdiff, Xsol, and Xads. The
concentration of solution P at the surface of the DGT device was calculated usingeq 1according to Zhang and Davison (1995) .12
= MΔ DAt
PDGT g
(1)
whereMis the accumulated P mass in the DGT binding layer,A
is the surface area of the DGT sampling window, t is the deployment time,Δg is the total thickness of the diffusive gel layer and thefilter membrane, andDis the diffusion coefficient of P in the diffusive gel. The DGT is a passive sampler and, therefore, results fromeq 1reflect a time-averaged concentration in the soil solution immediately adjacent to the outer surface of the DGT device.
PDGTwas converted to an effective concentration usingeq 2to represent the effectively available P from both soil solution and the solid-phase labile pool.10
= R
PE PDGT
diff (2)
Rdiffis the hypothetical ratio of the PDGTto the concentration in soil solution if no resupply from the solid phase occurred (only pore water P diffusion).Rdiffwas calculated using the DIFS
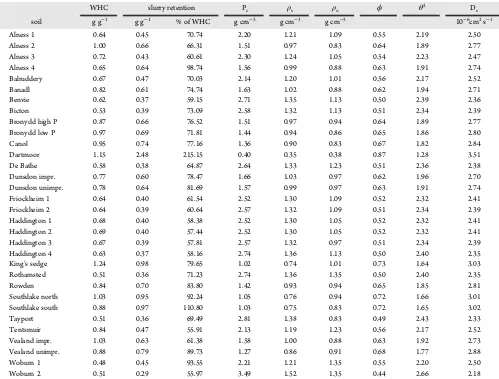
Table 1. Physical Properties from Dry Soils and Slurries Prepared for Diffusive Gradient in Thin Films Analysisa
WHC slurry retention Pc ρs ρo ϕ θ2 D s soil g g−1 g g−1 % of WHC g cm−3 g cm−3 g cm−3 10−6cm2s−1
Alness 1 0.64 0.45 70.74 2.20 1.21 1.09 0.55 2.19 2.50 Alness 2 1.00 0.66 66.31 1.51 0.97 0.83 0.64 1.89 2.77 Alness 3 0.72 0.43 60.61 2.30 1.24 1.05 0.54 2.23 2.47 Alness 4 0.65 0.64 98.74 1.56 0.99 0.88 0.63 1.91 2.74 Balruddery 0.67 0.47 70.03 2.14 1.20 1.01 0.56 2.17 2.52 Banadl 0.82 0.61 74.74 1.63 1.02 0.88 0.62 1.94 2.71 Benvie 0.62 0.37 59.15 2.71 1.35 1.13 0.50 2.39 2.36 Bicton 0.53 0.39 73.09 2.58 1.32 1.13 0.51 2.34 2.39 Bronydd high P 0.87 0.66 76.52 1.51 0.97 0.94 0.64 1.89 2.77 Bronydd low P 0.97 0.69 71.81 1.44 0.94 0.86 0.65 1.86 2.80 Canol 0.95 0.74 77.16 1.36 0.90 0.83 0.67 1.82 2.84 Dartmoor 1.15 2.48 215.15 0.40 0.35 0.38 0.87 1.28 3.51 De Bathe 0.58 0.38 64.87 2.64 1.33 1.23 0.51 2.36 2.38 Dunsdon impr. 0.77 0.60 78.47 1.66 1.03 0.97 0.62 1.96 2.70 Dunsdon unimpr. 0.78 0.64 81.69 1.57 0.99 0.97 0.63 1.91 2.74 Friockheim 1 0.64 0.40 61.54 2.52 1.30 1.09 0.52 2.32 2.41 Friockheim 2 0.64 0.39 60.64 2.57 1.32 1.09 0.51 2.34 2.39 Haddington 1 0.68 0.40 58.38 2.52 1.30 1.05 0.52 2.32 2.41 Haddington 2 0.69 0.40 57.44 2.52 1.30 1.05 0.52 2.32 2.41 Haddington 3 0.67 0.39 57.81 2.57 1.32 0.97 0.51 2.34 2.39 Haddington 4 0.63 0.37 58.16 2.74 1.36 1.13 0.50 2.40 2.35 King’s sedge 1.24 0.98 79.65 1.02 0.74 1.01 0.73 1.64 3.03 Rothamsted 0.51 0.36 71.23 2.74 1.36 1.35 0.50 2.40 2.35 Rowden 0.84 0.70 83.80 1.42 0.93 0.94 0.65 1.85 2.81 Southlake north 1.03 0.95 92.24 1.05 0.76 0.94 0.72 1.66 3.01 Southlake south 0.88 0.97 110.80 1.03 0.75 0.83 0.72 1.65 3.02 Tayport 0.51 0.36 69.49 2.81 1.38 0.83 0.49 2.43 2.33 Tentsmuir 0.84 0.47 55.91 2.13 1.19 1.23 0.56 2.17 2.52 Vealand impr. 1.03 0.63 61.38 1.58 1.00 0.88 0.63 1.92 2.73 Vealand unimpr. 0.88 0.79 89.73 1.27 0.86 0.91 0.68 1.77 2.88 Woburn 1 0.48 0.45 93.55 2.21 1.21 1.35 0.55 2.20 2.50 Woburn 2 0.51 0.29 55.97 3.49 1.52 1.35 0.44 2.66 2.18
aWHC, water holding capacity; P
c, particle concentrations: soil dry weight divided by the soil solution volume;ρs, bulk density of the soil slurry;ρo,
dynamic numerical model of the DGT-soil system.8 Input parameters of particle concentration (Pc; ratio between dry weight and volume of soil solution), soil porosity (ϕ), and the diffusion coefficient of P in the soil (Ds) were calculated according to Harper et al. (2000).7To simulate“diffusion only” conditions the system response time,Tc, was set to 1×10¹⁰s and Kdwas set as 0 cm3g−1. WhileRrepresents the empirical relative contribution of the system to dynamically maintain the solution concentration adjacent to the DGT device,Rdiffis the minimal possibleRvalue in the absence of solid phase resupply (diffusion only). The difference of R and Rdiff, R−Rdiff, was used as an estimation of expected dynamic contribution from desorption during the DGT deployment, relative to the original soil solution concentration.
The R ratio was calculated as the mean P concentration measured by DGT relative to the solution P concentration measured using DET (eq 3). Assuming that POlsen provides an estimate of the labile solid phase pool, the distribution coefficient between the solid and solution phases (Kd) was calculated as POlsen/PDGT. The value ofTcderived using DIFS corresponds to the time needed to bring the interfacial concentration of P, Pi, from 0 to 63% of its pseudo steady state value.7Assuming that the desorption rate constants are much lower than the sorption rate constant (k1≫k−1), the sorption rate constant can be estimated as ineq 4and the desorption rate constant can be calculated as in eq 5.7,15 The estimated desorption rates can therefore be calculated as ineq 6. The desorption rate constant is independent of DGT deployment time.
= R P P DGT DET (3) = k T 1 1 c (4) = − k k K P 1 1
d c (5)
= k−
Dspt rate POlsen cP 1 (6)
The distance from the DGT device to which the soil solution (xsol) or the adsorbed labile P (xads) are depleted after 24 h were also estimated by DIFS model.8 The limit to depletion was arbitrarily set on reduction of at least 5% of solution con-centration (xsol) or the 5% ofKd(xads) based on the resolution of the outcome data from the DIFS model, as a standard limit that could be used to compare all the studied soils. Similarly, the dependency of the output R values on time was used to calculate the maximumR(Rmax) and the time at whichRmaxwas reached (TRmax).
The output parameters from the DIFS model (Rdiff,Rmax,xads,
xsol,TcandTRmax) reflect both the model assumptions and the variation of all empirically determined input data used to run this model, including the DGT and DET measurements at 24h.
Statistical Methods.Pearson’s correlation was used between independent variables and the significance of correlations was judged using standard t test (significant atp ≤ 0.05 and very significant atp≤0.01). Where necessary, according to results of Andersen−Darling test for normality, data were ln transformed prior to correlation analyses. Nonlinear regression functions (exponential or logarithmic) were fitted to the selected plots in order to draw patterns of general interrelations between parameters. All statistical calculations were performed in Microsoft Excel.
■
RESULTSPhosphorus Availability Indices. The soils used in this study correspond to a wide range of P status as reflected in the parameters displayed inTable 2. Olsen P averaged 49.1 mg kg−1 and ranged from 5.6 (Tentsmuir site) to 184.4 (Haddington1) mg kg−1. Olsen P is related to a regulatory P index for crop nutrition used in the UK,16which ranges from 0 (insufficient P supply) to 7 (excessive availability). In the current study, half of the soils analyzed belong to indexes 3 and 4 (26 to 70 mg L−1), corresponding to“high”and“very high”available P. The phos-phorus effective concentration (PE) is calculated using the measured PDGT and calculated Rdiff. It accounts for both soil solution P and easily desorbable P. In our soils, PEaveraged 2.32±2.41 mg L−1. The organic soil Dartmoor had a moderate POlsen, but a very high iron oxide strip P (PFeO), PDGTand PE compared to the other soils in this study. Tentsmuir, the sandy soil, showed a similar pattern, but to a lesser degree, with very low POlsen(5.6 mg kg−1), average PFeO(11.4 mg kg−1), and a high PDGT(0.35 mg L−1) and PE(5.21 mg L−1). Other mineral soils with average physical properties and high POlsen, (e.g., Vealand improved, Bicton and Friockheim 1 and 2) contrastingly had low PDGTand PE. In these cases, as for Tentsmuir and Dartmoor soils, PFeOappears to be better explaining PDGTand PEvariation than POlsen.
Comparing with other common soil P parameters, PDGTwas better correlated with PFeO strips and several other P indexes (Pwater, PNaOH/EDTA, and Psat) than with POlsen(Table 3). Similarly, PDETwas better correlated with PFeOand Pwaterthan with other parameters.Kdwas poorly correlated with every tested parameter (Table 3). Differences between PDGTand P concentration in soil extracts (e.g., Pwaterand POlsen) certainly reflect the fact that DGT method includes dissimilarities in soil P diffusion and kinetics of P resupply from solid phase, while P extraction methods just consider equilibrium P at constant solid to solution ratio. The phosphorus effective concentration (PE) was better correlated with most P concentrations in soil extracts than PDGT(Table 3), indicating that this parameter may be a better representation of P availability than PDGTalone.
Organic P, Po,was estimated in the DGT and DET extracts as the difference between the total accumulated mass of P and the mass of molybdate-reactive P (Pi). The Po fraction that accumulated in the DGT binding layer averaged 38.9±12.4%, slightly less than the 43.7 ± 15.9% accumulated in the DET diffusive gel. Poeluted from the DET gel represents molecules capable of diffusing from soil solution through the filter membrane and the polyacrylamide gel. The proportion of Poin the DGT binding layer is based only on the accumulated mass, since the speciation of the numerous Poforms and their diffusive coefficients in the diffusive layer are unknown.
The difference betweenRandRdiffis a quantitative measurement of the ability of each soil to resupply Pi to the pore water in response to DGT-induced depletion. TheTcand desorption rate showed a tighterfit toR−Rdiff(Figure 1E and1F) than to theR ratio likely due to the variability of soil wetting parameters and their influence on theRdiffvalues.
The maximum distance of pore water depletion (Xsol) averaged 0.42±0.10 cm and for the desorbable Piconcentration the maximum distance of depletion (Xads) averaged 0.36 ± 0.07 cm. The distance of depletion represents the maxim distance where roots can influence soil P concentrations.
The Pi concentration at the surface of the DGT is time dependent and theRvalues peak atRmaxatTRmaxseconds after the deployment begins (Figure 1A). By analyzing the shape of
R-time dependency, two patterns emerge. The most common pattern is the case in which theRvalues peak (Rmax) atTRmax (between 20 and 50 min) and decrease to equilibrium near constant value after 10 h (Figure 1A). Alternatively, some soils do not display this peak and do not reach a constantRuntil after 24 h (e.g., Tentsmuir and Dartmoor;Figure 1A).Rmaxappears to be a function of porosity (and therefore Corg concentration), with the exception of the outliers Tentsmuir and Haddington 1.
The differenceRmax−Ris a direct negative proportion ofR−Rdiff, in other words, with increasing resupply capacity of the soil (R−Rdiff) the R curve in time will become less peak-shaped (lowRmax−R;Figure 1D). While the relative Piflux response in the first hour is mainly influenced by soil wetting properties, at longer time it tends to be a function of the resupply capacity (R−Rdiff) of the soil solid phase (Figure 1D and F). This behavior as well as the shape of the time series curves of theRratio reflects both the DIFS model assumptions7,8and the variability of input parameters, specific for the used soil samples. The system response time (Tc) is very sensitive to variations in the input values forRin the DIFS model. Therefore, absolute values must be interpreted with caution due to the effects of possible accu-mulated errors.Tcvalues showed a log-normal distribution and were found to be log−linear with respect to R−Rdiff, expo-nentially decaying with increasing R−Rdiff values (Figure 1E).
Tcvalues averaged 3.63 h (considering the log transformations), and ranged from 0.038 s in Tentsmuir to 88h in King’s sedge soils.
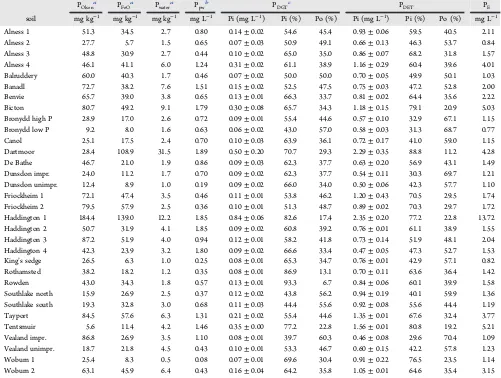
In the (de)sorption rate constant analysis, Tentsmuir was a clear outlier with lowTcand very highk1and k−1values, and was therefore excluded from the trend line analysis ofFigures 1 Table 2. Phosphorus Concentrations in POlsen, PFeO, Pwater, Soil Pore Water (Ppw), PDGT, PDET, and Calculated Effective P Concentration (PE) in Relation to the Following
POlsena PFeOa Pwatera Ppwb PDGTc PDET PE
soil mg kg−1 mg kg−1 mg kg−1 mg L−1 Pi (mg L−1) Pi (%) Po (%) Pi (mg L−1) Pi (%) Po (%) mg L−1
Alness 1 51.3 34.5 2.7 0.80 0.14±0.02 54.6 45.4 0.93±0.06 59.5 40.5 2.11 Alness 2 27.7 5.7 1.5 0.65 0.07±0.03 50.9 49.1 0.66±0.13 46.3 53.7 0.84 Alness 3 48.8 30.9 2.7 0.44 0.10±0.02 65.0 35.0 0.86±0.07 68.2 31.8 1.57 Alness 4 46.1 41.1 6.0 1.24 0.31±0.02 61.1 38.9 1.16±0.29 60.4 39.6 4.01 Balruddery 60.0 40.3 1.7 0.46 0.07±0.02 50.0 50.0 0.70±0.05 49.9 50.1 1.03 Banadl 72.7 38.2 7.6 1.51 0.15±0.02 52.5 47.5 0.75±0.03 47.2 52.8 2.00 Benvie 65.7 39.0 3.8 0.65 0.13±0.01 66.3 33.7 0.81±0.02 64.4 35.6 2.22 Bicton 80.7 49.2 9.1 1.79 0.30±0.08 65.7 34.3 1.18±0.15 79.1 20.9 5.03 Bronydd high P 28.9 17.0 2.6 0.72 0.09±0.01 55.4 44.6 0.57±0.10 32.9 67.1 1.15 Bronydd low P 9.2 8.0 1.6 0.63 0.06±0.02 43.0 57.0 0.58±0.03 31.3 68.7 0.77 Canol 25.1 17.5 2.4 0.70 0.10±0.03 63.9 36.1 0.72±0.17 41.0 59.0 1.15 Dartmoor 28.4 108.9 31.5 1.89 0.50±0.20 70.7 29.3 2.29±0.35 88.8 11.2 4.28 De Bathe 46.7 21.0 1.9 0.86 0.09±0.03 62.3 37.7 0.63±0.20 56.9 43.1 1.49 Dunsdon impr. 24.0 11.2 1.7 0.70 0.09±0.02 62.3 37.7 0.54±0.11 30.3 69.7 1.21 Dunsdon unimpr. 12.4 8.9 1.0 0.19 0.09±0.02 66.0 34.0 0.50±0.06 42.3 57.7 1.10 Friockheim 1 72.1 47.4 3.5 0.46 0.11±0.01 53.8 46.2 1.20±0.43 70.5 29.5 1.74 Friockheim 2 79.5 57.9 2.5 0.36 0.10±0.01 51.3 48.7 0.89±0.02 70.3 29.7 1.72 Haddington 1 184.4 139.0 12.2 1.85 0.84±0.06 82.6 17.4 2.35±0.20 77.2 22.8 13.72 Haddington 2 50.7 31.9 4.1 1.85 0.09±0.02 60.8 39.2 0.76±0.01 61.1 38.9 1.55 Haddington 3 87.2 51.9 4.0 0.94 0.12±0.01 58.2 41.8 0.73±0.14 51.9 48.1 2.04 Haddington 4 42.3 23.9 3.2 1.80 0.09±0.02 66.6 33.4 0.47±0.05 47.3 52.7 1.53 King’s sedge 26.5 6.3 1.0 0.25 0.08±0.01 65.3 34.7 0.76±0.01 42.9 57.1 0.82 Rothamsted 38.2 18.2 1.2 0.35 0.08±0.01 86.9 13.1 0.70±0.11 63.6 36.4 1.42 Rowden 43.0 34.3 1.8 0.57 0.13±0.01 93.3 6.7 0.84±0.06 60.1 39.9 1.58 Southlake north 15.9 26.9 2.5 0.37 0.12±0.02 43.8 56.2 0.94±0.19 40.1 59.9 1.36 Southlake south 19.3 32.8 3.0 0.68 0.11±0.03 44.4 55.6 0.92±0.08 55.6 44.4 1.19 Tayport 84.5 57.6 6.3 1.31 0.21±0.02 55.4 44.6 1.35±0.01 67.6 32.4 3.77 Tentsmuir 5.6 11.4 4.2 1.46 0.35±0.00 77.2 22.8 1.56±0.01 80.8 19.2 5.21 Vealand impr. 86.8 26.9 3.5 1.10 0.08±0.01 39.7 60.3 0.46±0.08 29.6 70.4 1.09 Vealand unimpr. 18.7 21.8 4.5 0.43 0.10±0.01 53.3 46.7 0.60±0.15 42.2 57.8 1.23 Woburn 1 25.4 8.3 0.5 0.08 0.07±0.01 69.6 30.4 0.91±0.22 76.5 23.5 1.14 Woburn 2 63.1 45.9 6.4 0.43 0.16±0.04 64.2 35.8 1.05±0.01 64.6 35.4 3.15
aPi in different extractants, data published in Stutter et al. (2015).bP concentration in soil pore water extracted by two cycles centrifugation of the
(C, D, E, and F). For the other soils, sorption rate constants (k1) averaged 1.07 × 10−04 s, whereas k
−1values averaged 1.29 × 10−06s,k1was, as expected, on average 83 fold greater thank−1. The estimated Pi desorption rates during depletion by DGTs averaged 4.71 nmol L−1 s−1, and was found to exponentially
increase with increasing resupply capacity of the soils (calculated asR−Rdiff;Figure 1F).
The maximum response (Rmax) is highly correlated toCOrgand other parameters influenced by COrg, which indicates that it affects the rate of desorption.COrgwas also strongly correlated
Table 3. Pearson Correlation Coefficient of Experimental Soil Parameters, DGT, DET, and DIFS Calculated Parametersa
Ppw PDGT PDET PE Kd R Rdiff R−Rdiff Rmax TRmax Ln Tc k1 k−1 Dspt rateb
surface area 0.10 0.05 −0.11 0.19 0.39 0.05 −0.49 0.16 −0.35 0.41 −0.28 0.41 −0.22 0.42 clay 0.18 0.13 −0.02 0.28 0.38 0.11 −0.57 0.24 −0.40 0.45 −0.35 0.46 −0.16 0.48 COrg 0.14 0.26 0.40 0.00 −0.24 0.06 0.83 −0.14 0.70 −0.07 0.23 −0.13 0.71 −0.09 POlsen 0.40 0.57 0.43 0.69 0.27 0.51 −0.48 0.61 −0.19 0.72 −0.64 0.78 0.10 0.76 PFeO 0.53 0.83 0.82 0.78 0.07 0.61 −0.02 0.60 0.21 0.69 −0.60 0.71 0.63 0.71 Pox 0.33 0.57 0.41 0.68 0.20 0.47 −0.30 0.53 0.02 0.82 −0.47 0.77 0.04 0.77 Psat 0.42 0.60 0.50 0.73 0.20 0.52 −0.58 0.64 −0.30 0.67 −0.65 0.73 0.09 0.71 PNaOH/EDTA 0.40 0.65 0.50 0.76 0.24 0.52 −0.38 0.60 −0.05 0.84 −0.55 0.81 0.13 0.81 Ptot‑fusion 0.39 0.57 0.39 0.59 0.02 0.49 0.03 0.46 0.30 0.76 −0.43 0.70 0.28 0.73 Pwater 0.61 0.69 0.77 0.51 −0.23 0.53 0.39 0.42 0.43 0.29 −0.42 0.35 0.93 0.37 Ppw 1.00 0.62 0.50 0.57 −0.51 0.70 −0.03 0.69 0.11 0.38 −0.67 0.56 0.64 0.59 aGray shade intensity is used as a visual aid that indicates how high r values are, ranging from white at 0.00 to maximum shade at 1.00 or−1.00. rvalues over 0.35 are significant (p≤0.05) and over 0.45 are very significant (p≤0.01) using Student’sttest. All parameters listed in the columns are original from this study, whereas surface area, clay, COrg, POlsen, PFeO, Pox, Psat, PNaOH/EDTA, Ptot‑fusion, and Pwaterwere determined by Stutter et al.
(2015)3.bDspt rate−desorption rate in mg of P per litter of soil solution per second.
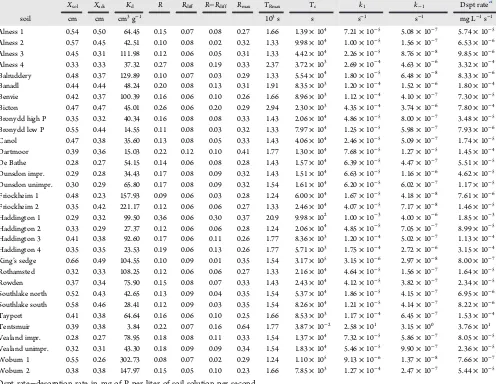
Table 4. DIFS Derived Parameters Reflecting P Depletion from Soil Pore Water by DGTs, Soil P Diffusion and Kinetics of P Resupply from Soil Solid Matrix
Xsol Xads Kd R Rdiff R−Rdiff Rmax TRmax Tc k1 k−1 Dspt ratea
soil cm cm cm3g−1 103s s s−1 s−1 mg L−1s−1
Alness 1 0.54 0.50 64.45 0.15 0.07 0.08 0.27 1.66 1.39×10⁴ 7.21×10⁻⁵ 5.08×10⁻⁷ 5.74×10⁻⁵ Alness 2 0.57 0.45 42.51 0.10 0.08 0.02 0.32 1.33 9.98×10⁴ 1.00×10⁻⁵ 1.56×10⁻⁷ 6.53×10⁻⁶ Alness 3 0.45 0.31 111.98 0.12 0.06 0.05 0.31 1.33 4.42×10⁴ 2.26×10⁻⁵ 8.76×10⁻⁸ 9.85×10⁻⁶ Alness 4 0.33 0.33 37.32 0.27 0.08 0.19 0.33 2.37 3.72×10³ 2.69×10⁻⁴ 4.63×10⁻⁶ 3.32×10⁻⁴ Balruddery 0.48 0.37 129.89 0.10 0.07 0.03 0.29 1.33 5.54×10⁴ 1.80×10⁻⁵ 6.48×10⁻⁸ 8.33×10⁻⁶ Banadl 0.44 0.44 48.24 0.20 0.08 0.13 0.31 1.91 8.35×10³ 1.20×10⁻⁴ 1.52×10⁻⁶ 1.80×10⁻⁴ Benvie 0.42 0.37 100.39 0.16 0.06 0.10 0.26 1.66 8.96×10³ 1.12×10⁻⁴ 4.10×10⁻⁷ 7.30×10⁻⁵ Bicton 0.47 0.47 45.01 0.26 0.06 0.20 0.29 2.94 2.30×10³ 4.35×10⁻⁴ 3.74×10⁻⁶ 7.80×10⁻⁴ Bronydd high P 0.35 0.32 40.34 0.16 0.08 0.08 0.33 1.43 2.06×10⁴ 4.86×10⁻⁵ 8.00×10⁻⁷ 3.48×10⁻⁵ Bronydd low P 0.55 0.44 14.55 0.11 0.08 0.03 0.32 1.33 7.97×10⁴ 1.25×10⁻⁵ 5.98×10⁻⁷ 7.93×10⁻⁶ Canol 0.47 0.38 35.60 0.13 0.08 0.05 0.33 1.43 4.06×10⁴ 2.46×10⁻⁵ 5.09×10⁻⁷ 1.74×10⁻⁵ Dartmoor 0.39 0.36 15.03 0.22 0.12 0.10 0.41 1.77 1.30×10⁴ 7.68×10⁻⁵ 1.27×10⁻⁵ 1.45×10⁻⁴ De Bathe 0.28 0.27 54.15 0.14 0.06 0.08 0.28 1.43 1.57×10⁴ 6.39×10⁻⁵ 4.47×10⁻⁷ 5.51×10⁻⁵ Dunsdon impr. 0.29 0.28 34.43 0.17 0.08 0.09 0.32 1.43 1.51×10⁴ 6.63×10⁻⁵ 1.16×10⁻⁶ 4.62×10⁻⁵ Dunsdon unimpr. 0.30 0.29 65.80 0.17 0.08 0.09 0.32 1.54 1.61×10⁴ 6.20×10⁻⁵ 6.02×10⁻⁷ 1.17×10⁻⁵ Friockheim 1 0.48 0.23 157.93 0.09 0.06 0.03 0.28 1.24 6.00×10⁴ 1.67×10⁻⁵ 4.18×10⁻⁸ 7.61×10⁻⁶ Friockheim 2 0.35 0.42 221.17 0.12 0.06 0.06 0.27 1.33 2.46×10⁴ 4.07×10⁻⁵ 7.17×10⁻⁸ 1.46×10⁻⁵ Haddington 1 0.29 0.32 99.50 0.36 0.06 0.30 0.37 20.9 9.98×10² 1.00×10⁻³ 4.00×10⁻⁶ 1.85×10⁻³ Haddington 2 0.33 0.29 27.37 0.12 0.06 0.06 0.28 1.24 2.06×10⁴ 4.85×10⁻⁵ 7.05×10⁻⁷ 8.99×10⁻⁵ Haddington 3 0.41 0.38 92.60 0.17 0.06 0.11 0.26 1.77 8.36×10³ 1.20×10⁻⁴ 5.02×10⁻⁷ 1.13×10⁻⁴ Haddington 4 0.35 0.35 23.53 0.19 0.06 0.13 0.26 1.77 5.71×10³ 1.75×10⁻⁴ 2.72×10⁻⁶ 3.15×10⁻⁴ King’s sedge 0.66 0.49 104.55 0.10 0.09 0.01 0.35 1.54 3.17×10⁵ 3.15×10⁻⁶ 2.97×10⁻⁸ 8.00×10⁻⁷ Rothamsted 0.32 0.33 108.25 0.12 0.06 0.06 0.27 1.33 2.16×10⁴ 4.64×10⁻⁵ 1.56×10⁻⁷ 1.64×10⁻⁵ Rowden 0.37 0.34 75.90 0.15 0.08 0.07 0.33 1.43 2.43×10⁴ 4.12×10⁻⁵ 3.82×10⁻⁷ 2.34×10⁻⁵ Southlake north 0.52 0.43 42.65 0.13 0.09 0.04 0.35 1.54 5.37×10⁴ 1.86×10⁻⁵ 4.15×10⁻⁷ 6.95×10⁻⁶ Southlake south 0.58 0.46 28.41 0.12 0.09 0.03 0.35 1.54 8.26×10⁴ 1.21×10⁻⁵ 4.14×10⁻⁷ 8.22×10⁻⁶ Tayport 0.41 0.38 64.64 0.16 0.06 0.10 0.25 1.66 8.53×10³ 1.17×10⁻⁴ 6.45×10⁻⁷ 1.53×10⁻⁴ Tentsmuir 0.39 0.38 3.84 0.22 0.07 0.16 0.64 1.77 3.87×10⁻² 2.58×101 3.15×100 3.76×101 Vealand impr. 0.28 0.27 78.95 0.18 0.08 0.11 0.33 1.54 1.37×10⁴ 7.32×10⁻⁵ 5.86×10⁻⁷ 8.05×10⁻⁵ Vealand unimpr. 0.32 0.31 43.30 0.18 0.09 0.09 0.34 1.54 1.83×10⁴ 5.46×10⁻⁵ 9.90×10⁻⁷ 2.36×10⁻⁵ Woburn 1 0.55 0.26 302.73 0.08 0.07 0.02 0.29 1.24 1.10×10⁵ 9.13×10⁻⁶ 1.37×10⁻⁸ 7.66×10⁻⁷ Woburn 2 0.38 0.38 147.97 0.15 0.05 0.10 0.23 1.66 7.85×10³ 1.27×10⁻⁴ 2.47×10⁻⁷ 5.44×10⁻⁵ aDspt rate−desorption rate in mg of P per liter of soil solution per second.
with all wetting parameters (data not shown) and their related soil P mobility parameters RdiffandRMax(Table 3). The effect of
COrgwas clearly greater than the effect of surface area and particle size distribution, which were not strongly correlated with any P related soil property.
The lnTc, k1, and the desorption rate showed similar patterns, showing good correlations with P concentration in soil extracts (except for Pwater). Desorption rate constant (k−1) was highly correlated with Pwater and moderately correlated with PFeO, Ppw, PDGT, PDET, and R(Table 3). In general, all correlation coefficients for the P mobility and resupply parameters were improved when the sandy soil Tentsmuir was removed from the data set. The organic soil Dartmoor also behaved as an outlier in a few cases.
■
DISCUSSIONThe DGT Methodological Approach: Advantages, Issues and Possible Improvements. The combined DGT
and DET techniques, and the DIFS model, have been previously applied to estimate the mobility and resupply parameters of soils for metal contaminants,10but has not yet been used to study soil phosphorus. The data set here presented is therefore a unique opportunity to discuss the methodological issues involved, along with the behavior and drivers of the variation of the evaluated parameters.
The effective concentration (PE) is a hypothetical concen-tration that represents the concenconcen-tration of P in the soil pore water if resupply was only dependent on diffusion. Under the assumption of diffusion only, there would be no resupply of P from the solid phase. This approach is useful for representing, in the same parameter, both the equilibrium soil solution concentration and the easily desorbable/soluble P forms.9,10 The conversion of PDGTto PEusingRdiffdepends solely on the amount of water that is added to the slurry preparation (and the
final porosity), which is set to a maximum for the soils used in this study. This maximum water retention in the slurry was shown to
Figure 1.Patterns and interrelations in Piresupply analysis using DIFS model: (A) Sample of different time dependency ofRshaped curves; (B)Rratio
as a function of PDGT; (C) Peak R (Rmax) as a function of soil porosityϕ; (D) Size of the peak R (Rmax−R) as a function of soil Piresupply capacity
(R−Rdiff); (E) Equilibration time (Tc) as a function of soil Piresupply capacity (R−Rdiff); (D) Desorption rates as a function of soil Piresupply capacity
be highly dependent on the organic matter content of the soils. The use of the DIFS model to estimate the soil specificRdiffis still useful, as illustrated by its strong variation and the higher correlation of most of the extractable P concentrations with PE than with PDGT(Table 3). Additionally to theRdiff, the wetting conditions and resulting porosity were clearly influencing the short-term (30−50 min) response in thefluxes into the DGT, reflected in the Rmax parameter (Figure 1C). Soil structure is completely lost during slurry preparation and in undisturbed conditions, aggregate size has been demonstrated to influence both wetting properties and P desorption.17 The effect of moisture content and soil structure onθ2,Ds,Rdiff,Tc, andK−1 needs to be further studied.
Differences between P concentrations in water extracts (1:4 w/v; Pwater), and in soil pore water (Ppw) in the equilibrated slurry can be explained by the huge differences in solid: liquid ratio, extraction time and the amount of color interference during the Pispectrophotometric determination. Methodologically, the DET preparation returned a much cleaner sample than pore water and water extracts and therefore a more accurate color-imetric determination of Pi. Additionally, the filter membrane and the polyacrylamide gel exert a size exclusion factor, which is likely to contribute to PDEThaving a different pattern of values than those observed for Pwaterand Ppw. The same size exclusion factor is present for the DGT, since the samefilter membrane and the diffusive gels are used. Therefore, we consider PDETto be the most appropriate measurement of soil pore water concentration when it is compared to DGT measurements and these values have been used to calculate the ratioRshown inTable 4. Further-more,PDGTshowed a higher correlation withPDETthan withPpw, which supports the previously stated (Table 3).
DGT and DET extracts maintain limited contamination from the soil matrix due to the size exclusion factor, and less interference is observed in color development by Murphy and Riley (1962)14 method, represented by smaller background levels in controls. Color development artifacts in wet chemistry P determination may be significantly large, especially for water based extracts (Pwaterand Ppw), where the concentrations are lower and therefore unsuitable for dilutions (Dr. Jane Hawkins, personal communication, December 3, 2014). For these extracts the total phosphorus measured by ICP-MS is a much more accurate parameter, but cannot be used in DGT calculations since organic P forms are abundantly present in soil extracts and in the eluates from the DGT ferrihydrite binding layer. Each one of the dozens of different organic P forms has its own unique diffusive coefficients in the DGT diffusive layer, needed to calcu-late their uniqueCDGTandCE. Enzyme hydrolysis and HPLC methods may be suitable for further studying the differential behavior of different organic P forms in soils using DGTs.
The use of DGT, DET, and the DIFS model are accurate and practical tools for the study of soil P mobility and resupply from solid phase. The theoretical basis of the DGT assay, which can be related to P uptake by plant roots, as well as the additional param-eter estimates gained through the method (e.g., PE,R−Rdiff,Rdiff) represent significant improvements to typical extract-based soil P tests (e.g., Olsen P). Namely we here propose the use of the
R−Rdiff value as the soil test parameter that best shows the P resupply from the soil solid phase.
More broadly, the holistic approach taken to resolve phos-phorus mobility in soils brings a better understanding and new insights into P exchange and release kinetics of P from solid phase to solution. The further use of this method for soils treated in controlled experimental conditions (e.g., use of amendments,
fertilizers and high salinity irrigation waters) or in particular sample sets (e.g., chronosequence, slope and other field gradients) will allow the re-examination of old assumptions under a new light and with increased detail.
Further work is needed in order tofit the DIFS model using repeated experimentalRvalues at increasing times of exposure, such as the studies performed by Ernstberger et al. (2002, 2005) for Cd, Cu, Ni, and Zn.18,19 This analysis will allow further verifying the accuracy of our estimation ofKdas the ratio of POlsen to PDET.
Implications for Plant Phosphorus Bioavailability.The P availability for plants depends on its speciation in soil. The P sorption on the soil solid phase is represented by the solid/liquid Pidistribution coefficient (Kd). In this studyKdwas calculated as the ratio between POlsenand Ppw, as the POlsenis currently the most used as the best accepted representation of labile adsorbed P in soils. Nevertheless there is not a consensus for the use of POlsen for estimating labile P even after decades of related research,20 and many other extracts have been proposed as P bioavailability indicators in soils such as, Mehlich 1, Bray 1, Mehlich 3, water, ammonium acetate, and DTPA.21Moreover, many P indices that employ a strong chemical extractant, were not introduced as a quantitative measure of P availability, but as availability indexes. For lack of better methods, these are often used as a quantitative measure of plant available P. In some cases the different extrac-tants have been theoretically designed to work with the dominant soil matrix and pH of specific geographical regions (e.g., alkaline calcareous soils), others are unspecific respect to type of soil matrix. Some of these P bioavailability methods are currently being used and recommended to soils with conditions funda-mentally different than the ones these methods were designed for. Ultimately, the greatest challenge for predicting the availability of soil P to plants will be the design of an easily implemented analytical tool, which best represents the P bio-availability regarding both the residual soil P and plant response to fertilization. In a critical P experiment (crop response to increasing P fertilizer doses) PDGTwas shown to be the best predictor of maize P uptake compared to POlsen,anion exchange membrane P, oxalate extractable P, Colwell, Bray-1, Mehlich-3 and CaCl2−P, but not as good at predicting rice P uptake.
22
The used two pool model (labile and nonlabile P) is an oversimplification, and many different adsorbed, precipitated and organic forms are more likely to occur. The separation of the labile pool into weak and strong binding sites has been proposed, nevertheless with the available data this is over parametrization.23 The majority of the P associated with the soil solid phase is nonlabile during the 24 h of the DGT deployment.6In this binary model approach,Kdshould account for the easily desorbable and readily soluble forms of inorganic P, assuming that no significant contributions of organic P mineralization would take place in this short period. Although in our study we did not have an accurate estimation of this labile pool, the actualKdcan be estimated by regression of a time series of DGT measurements.24This analysis would help to elucidate the real resupply potential of the soils and which extractant reflects more accurately the absolute values of the labile P forms therein. The estimation of Pi Kd using time series DGT analysis should be further studied in future experiments.
of organic acids, siderophores, enzymes, surfactants, and micro-bial growth stimulants.2,25,26It is expected that these exudates will change the balance between adsorbed and solution P, reducingKdand increasingTc, after the induced desorption of labile P has occurred. This effect should be dependent on the type (or combination of types) and dose of the exudate, as well as their indirect effect as microbial growth stimulants. Therefore, a realistic indicator of plant available P will depend both on the labile P concentration and the plant mechanisms involved in P mobilization, making the agronomical Kda crop dependent parameter. Future work on how plant exudates interfere with solid phase resupply using DGT and DET analysis would give quantitative information on active P mobilization by specific mechanisms.
In general, DGT and DET parameters are expressed in soil solution concentration (e.g., mg/L) while other P concentration in soils extracts are usually expressed per kg of soil dry weight. The lack of a constant solid to liquid ratio adds inaccuracies in back-calculating PDGT and PEconcentrations on a dry weight basis. When compared to adsorbed concentrations, the solution concentrations (as used from DGT related data) are expected to be more realistic to those experienced by the plant, but harder to compare between soils due to their different wetting properties. Moisture is set to a maximum during slurry preparation, therefore the DGT method naturally accounts for differences soil wetting properties, which in turn are shown here to have significant impact on short-term P mobility. This may be one of the factors why PDGT have shown in some cases stronger correlation with plant P uptake compared with POlsenand other soil extracts.22,27
Drivers of Phosphorus Lability. Except for the sandy Tentsmuir soil, resupply from solid phase was considered small compared to other elements such as Cd, Cu, Ni, and Zn.10,18For other elements,Tcusually ranged from 0.01 to 1000 s10while here the majority ofTcvalues were in the range of 1×10⁴to 1×10⁵s (20 samples,Table 4). Desorption rates are expected to be much slower than sorption rates and the P hysteretic behavior has been previously described by Okajima et al. (1983).28The majority of desorption rate constants were in the range of 1× 10⁻⁶to 1×10⁻⁷(18 samples,Table 4) averaging 1.29×10⁻⁶s−1. In previous studies the averagek−1values were 2.9×10⁻⁶s−1to 35 non calcareous soils29and 1.4×10⁻⁵s−1to 12 calcareous soils.30Although different methodologies may affect the results of desorption studies, the averagek−1values were similar between our data and previous research29,30indicating that DGT and DIFS based estimation are in the expected range of variation.
Although pH is expected to be positively correlated to P desorption,29for our soils pH was not correlated with P mobility parameters. No treatment was applied in our study to force pH shifts and observe its effect on P mobility parameters. The effect of natural pH values across different soils on P desorption, and the effect of pH changes within one specific soil (i.e., rhizosphere pH changes) are not necessarily the same. Similarly, particle size distribution was expected to significantly affect P desorption.31 Here, however, P resupply parameters were poorly correlated with particle size distribution. As our set of soil samples were very diverse in their intrinsic properties, the effects of pH and particle size distribution were probably overcome by other factors such as surface properties of clays and organic matter, and predomi-nantly the fertilization history and the resulting P saturation of the soil exchange complex. Nevertheless, the use of median diameter (representative of particle size distribution) as a second response variable in multiple regression analysis was shown to
significantly increase the explained variance for PDET, PDGT, and PEby 17%, 6.8%, and 4.1% respectively (data not shown). This may indicate that particle size distribution is a secondary driver of P mobility parameters.
The P resupply from solid phase (R−Rdiff) and the desorption rates during DGT deployment were well correlated with PE, PDGT, and most of the P concentrations in different tests. This was considered hard evidence that P status is the main driver of P resupply from soil solid phase into solution, and hence P lability and bioavailability. In general, the soils with extreme POlsenwere also extreme in P mobility and resupply parameters (Figures 1B, D, E, and F). Long-term P fertilization rates are directly pro-portional to the degree of soil saturation with P and the con-comitant reduction P-retention capacity.32Many European soils are excessively fertilized, accumulating soil P pools to environ-mentally unacceptable levels.33,34This is certainly reflected in our soil sample set as 81.25% of the samples belong to P fertility indexes over three corresponding to“high” and“very high” P availability. The wide range of soil types and P concentration of our sample set, gives strong support to the case that soil P status (and the assumed related saturation of the soil interchange complexes) is the main driver of P resupply from soil solid phase into solution, and hence P lability. More data from a bigger sample set including other soils types and conditions are required to further verify these conclusions.
Environmental Implications.The high P status in soils and the resulting nutrient pollution of receiving water courses are a major environmental concern. Considering both freshwaters and oceans, current planetary conditions exceed all limits for P discharges.35There is an urgent need to reduce total P in soils into environmentally acceptable levels, while maintaining optimal crop growth conditions.33The chemical exchange of P between soil solid and solution phase is expected to be the main mechanism influencing the bioavailability of P to crops. The present work has provided new insight and an alternative approach for studying the dynamics and mobility of P in soil. High levels of available P were found using the DGT method among soils that represented a wide range of P indices. This unexpected result indicates that extract-based methods for estim-ating P availability may vastly overestimate fertilizer require-ments and the risk of on-farm nutrient use and loss. The DGT method described herein could therefore be used to improve estimates of crop P requirements while minimizing the use of mineral fertilizers and the subsequent risks associated with surface water nutrient enrichment and eutrophication.
■
ASSOCIATED CONTENT*
S Supporting InformationThe Supporting Information is available free of charge on the
ACS Publications websiteat DOI:10.1021/acs.est.5b05395. Additional information as noted in the text (PDF)
■
AUTHOR INFORMATIONCorresponding Authors
*(D.M.-B.) E-mail:d.blackburn@lancaster.ac.uk. *(H.Z.) E-mail:h.zhang@lancaster.ac.uk.
Author Contributions
involved on the sample collection and characterization of P-related parameters. Courtney D. Giles, Tegan Darch, Catherine Wearing, and Lawrie Brown were involved in various laboratory analyses. All authors were involved in the conceptual planning, discussions and corrections of the manuscript.
Notes
The authors declare no competingfinancial interest. retired
■
ACKNOWLEDGMENTSThis work was performed as part of the Organic Phosphorus Utilisation in Soils (OPUS) project, funded by Biotechnology and Biological Sciences Research Council (BBSRC, BBSRC -BB/K018167/1) in the UK. We thank the Scottish Government Rural Environment Research and Analysis Directorate for funding aspects of this research. We gratefully acknowledge the assistance of C. Taylor, H. Taylor ,and S. Richards in soil collection and analysis, and the assistance of S. McGrath and J. Hernandez in data analysis.
■
ABBREVIATIONS AND SYMBOLS Piinorganic phosphorusPo oganic phosphorus measured as the difference between total and inorganic P
DGT diffusive gradients in thin films using a ferrihydrite containing gel as a P binding layer
DET diffusive equilibration in thinfilms (same DGT setup without the binding layer)
DIFS‘DGT inducedfluxes in soils and sediments’model PDET (mg l−1) pore water (dissolved) P concentration determined using DET
PDGT(mg l−1) DGT measured time averaged soil solution P concentration at the surface of DGT device
PEeffective P concentration−DGT estimated soil solution P + labile P concentration from the solid phase
POlsen (mg kg−1) phosphorus concentration (solid phase) measured using NaHCO3extraction
D0(cm2s−1) diffusion coefficient in diffusive layer of DGT device
Ds(cm2s−1) diffusion coefficient in soil
k−1(s−1) desorption rate constant
k1(s−1) sorption rate constant
Kd (cm3 g−1) equilibrium distribution coefficient between solid phase and soil solution
Pc(g cm−3) particle concentration−mass of particles in unit volume of soil solution
Rratio of PDGTto PDET
Rdiffratio of PDGTto PEin the case where there is no P resupply from the solid phase, estimated using DIFS for diffusion only case
Tc(s) response time of (de)sorption process
Xsol(cm) estimated distance to which DGT device depletes at least 5% of pore water P concentrations
Xads(cm) estimated distance to which DGT device depletes at least 5% of adsorbed P concentrations
WHC water holding capacity of the soil
MR maximum water retention in the soil prepared for DGT deployment
ρsbulk density of the soil at MR ρobulk density of the dry soil ϕsoil porosity
θ2diffusive tortuosity
■
REFERENCES(1) Batten, G. D. A review of phosphorus efficiency in wheat.Plant Soil
1992,146(1−2), 163−168.
(2) Vance, C. P.; Uhdeâ-Stone, C.; Allan, D. L. Phosphorus acquisition and use: critical adaptations by plants for securing a nonrenewable resource.New Phytol.2003,157(3), 423−447.
(3) Syers, J.; Johnston, A.; Curtin, D. Efficiency of soil and fertilizer phosphorus use. Reconciling changing concepts of soil phosphorus behaviour with agronomic information. FAO Fertilizer and Plant Nutrition Bulletin 18.Exp. Agric.2009,45, 128.
(4) Li, L.; Stanforth, R. Distinguishing adsorption and surface precipitation of phosphate on goethite (FeOOH).J. Colloid Interface Sci.2000,230(1), 12−21.
(5) Nye, P. The rate-limiting step in plant nutrient absorption from soil.Soil Sci.1977,123(5), 292−297.
(6) Degryse, F.; Smolders, E.; Zhang, H.; Davison, W. Predicting availability of mineral elements to plants with the DGT technique: a review of experimental data and interpretation by modelling.Environ.
Chem.2009,6(3), 198−218.
(7) Harper, M. P.; Davison, W.; Zhang, H.; Tych, W. Kinetics of metal exchange between solids and solutions in sediments and soils interpreted from DGT measured fluxes. Geochim. Cosmochim. Acta
1998,62(16), 2757−2770.
(8) Harper, M. P.; Davison, W.; Tych, W. DIFS - a modelling and simulation tool for DGT induced trace metal remobilisation in sediments and soils.Environ. Modell. Softw.2000,15(1), 55−66.
(9) Zhang, H.; Zhao, F.-J.; Sun, B.; Davison, W.; Mcgrath, S. P. A new method to measure effective soil solution concentration predicts copper availability to plants.Environ. Sci. Technol.2001,35(12), 2602−2607.
(10) Zhang, H.; Lombi, E.; Smolders, E.; McGrath, S. Kinetics of Zn release in soils and prediction of Zn concentration in plants using diffusive gradients in thin films.Environ. Sci. Technol.2004,38(13), 3608−3613.
(11) Stutter, M. I.; Shand, C. A.; George, T. S.; Blackwell, M. S. A.; Dixon, L.; Bol, R.; MacKay, R. L.; Richardson, A. E.; Condron, L. M.; Haygarth, P. M. Land use and soil factors affecting accumulation of phosphorus species in temperate soils.Geoderma2015,257-258, 257− 258.
(12) Zhang, H.; Davison, W. Performance characteristics of diffusion gradients in thin films for the in situ measurement of trace metals in aqueous solution.Anal. Chem.1995,67(19), 3391−3400.
(13) Santner, J.; Prohaska, T.; Luo, J.; Zhang, H. Ferrihydrite containing gel for chemical imaging of labile phosphate species in sediments and soils using diffusive gradients in thin films.Anal. Chem.
2010,82(18), 7668−7674.
(14) Murphy, J.; Riley, J. A modified single solution method for the determination of phosphate in natural waters.Anal. Chim. Acta1962,27, 31−36.
(15) Zhang, H.; Davison, W.; Knight, B.; McGrath, S. In situ measurements of solution concentrations and fluxes of trace metals in soils using DGT.Environ. Sci. Technol.1998,32(5), 704−710.
(16) DEFRA, D. f. E.Food and Rural Affairs, Fertiliser manual (RB209), 8th ed; The Stationery Office: London, 2010.
(17) Wang, X.; Yost, R.; Linquist, B. Soil aggregate size affects phosphorus desorption from highly weathered soils and plant growth.
Soil Sci. Soc. Am. J.2001,65(1), 139−146.
(18) Ernstberger, H.; Davison, W.; Zhang, H.; Tye, A.; Young, S. Measurement and dynamic modeling of trace metal mobilization in soils using DGT and DIFS.Environ. Sci. Technol.2002,36(3), 349−354.
(19) Ernstberger, H.; Zhang, H.; Tye, A.; Young, S.; Davison, W. Desorption kinetics of Cd, Zn, and Ni measured in soils by DGT.
Environ. Sci. Technol.2005,39(6), 1591−1597.
(20) Mallarino, A.; Blackmer, A. Comparison of methods for determining critical concentrations of soil test phosphorus for corn.
Agron. J.1992,84(5), 850−856.
(21) van Raij, B. Bioavailable tests: alternatives to standard soil extractions.Commun. Soil Sci. Plant Anal. 1998,29(11−14), 1553− 1570.
(22) Six, L.; Smolders, E.; Merckx, R. The performance of DGT versus conventional soil phosphorus tests in tropical soils - maize and rice responses to P application.Plant Soil2013,366(1−2), 49−66.
(23) Ciffroy, P.; Nia, Y.; Garnier, J. Probabilistic multicompartmental model for interpreting DGT kinetics in sediments.Environ. Sci. Technol.
2011,45(22), 9558−9565.
(24) Lehto, N.; Sochaczewski, Å.; Davison, W.; Tych, W.; Zhang, H. Quantitative assessment of soil parameter (KD and TC) estimation using DGT measurements and the 2D DIFS model.Chemosphere2008,
71(4), 795−801.
(25) Richardson, A. E.; Hocking, P. J.; Simpson, R. J.; George, T. S. Plant mechanisms to optimize access to soil phosphorus.Crop Pasture Sci.2009,60, 124−143.
(26) Hinsinger, P. Bioavailability of soil inorganic P in the rhizosphere as affected by root-induced chemical changes: a review.Plant Soil2001,
237(2), 173−195.
(27) Tandy, S.; Mundus, S.; Yngvesson, J.; de Bang, T. C.; Lombi, E.; Schjoerring, J. K.; Husted, S. r. The use of DGT for prediction of plant available copper, zinc and phosphorus in agricultural soils.Plant Soil
2011,346(1−2), 167−180.
(28) Okajima, H.; Kubota, H.; Sakuma, T. Hysteresis in the phosphorus sorption and desorption processes of soils.Soil Sci. Plant
Nutr.1983,29(3), 271−283.
(29) Smet, J. D.; Vanderdeelen, J.; Hofman, G. Effect of soil properties on the kinetics of phosphate release.Commun. Soil Sci. Plant Anal.1998,
29(11−14), 2135−2147.
(30) Shariatmadari, H.; Shirvani, M.; Jafari, A. Phosphorus release kinetics and availability in calcareous soils of selected arid and semiarid toposequences.Geoderma2006,132(3), 261−272.
(31) Barros, N. F.; Comerford, N. B. Phosphorus sorption, desorption and resorption by soils of the Brazilian Cerrado supporting eucalypt.
Biomass Bioenergy2005,28(2), 229−236.
(32) Hooda, P.; Truesdale, V.; Edwards, A.; Withers, P.; Aitken, M.; Miller, A.; Rendell, A. Manuring and fertilization effects on phosphorus accumulation in soils and potential environmental implications.Adv.
Environ. Res.2001,5(1), 13−21.
(33) Barberis, E.; Marsan, F. A.; Scalenghe, R.; Lammers, A.; Schwertmann, U.; Edwards, A.; Maguire, R.; Wilson, M.; Delgado, A.; Torrent, J. European soils overfertilized with phosphorus: Part 1. Basic properties.Fert. Res.1995,45(3), 199−207.
(34) Liu, Y.; Pan, X.; Li, J. A 1961−2010 record of fertilizer use, pesticide application and cereal yields: a review.Agron. Sustainable Dev.
2015,35(1), 83−93.