FOR BIOMEDICAL APPLICATIONS
by Ryan Stevenson
A thesis
submitted in partial fulfillment of the requirements for the degree of Master of Science in Mechanical Engineering
Boise State University
DEFENSE COMMITTEE AND FINAL READING APPROVALS
of the thesis submitted by
Ryan Stevenson
Thesis Title: Flexible Thermoelectric Generators for Biomedical Applications Date of Final Oral Examination: 22 June 2015
The following individuals read and discussed the thesis submitted by student Ryan Stevenson and they evaluated his presentation and response to questions during the final oral examination. They found that the student passed the final oral examination.
Donald Plumlee, Ph.D. Chair, Supervisory Committee
Yanliang Zhang, Ph.D. Member, Supervisory Committee
Michelle Sabick, Ph.D. Member, Supervisory Committee
iv
ACKNOWLEDGEMENTS
v ABSTRACT
The market for implantable medical devices is growing rapidly. Research and Markets predicts that by the end of 2015 the market for pacemakers will be 5.1 billion dollars, and a projected growth of 13.82% between 2013 and 2018. The average lifespan of an implantable medical device’s battery is only 5 years, while the projected lifespan of the device itself is 10 years. There is an excess of invasive surgeries occurring to replace these batteries, costing the healthcare system millions of dollars and also causing patients a large degree of discomfort and pain.
Thermoelectric generators have the potential to supplement and eventually replace these battery systems, allowing devices to reach their full lifespan. The process for developing thin film, and flexible thermoelectric generators was explored in this study with the intent of designing for biomedical applications. Screen-printing was used as the manufacturing method and several pastes were formulated and tested to compare their thermoelectric potential.
A new breed of thermoelectric materials that were built from a bottom-up
perspective was the precedent for this research. While they have shown great potential for creating bulk pellets, their application in thin films was still relatively unexplored. The most promising sample created had an electrical conductivity of 6775 S/m, a Seebeck of -125 μV/m, and a power factor of 105 μW/m-K2
vi
TABLE OF CONTENTS
ACKNOWLEDGEMENTS ... iv
ABSTRACT ... v
LIST OF TABLES ... ix
LIST OF FIGURES ... x
LIST OF ABBREVIATIONS ... xiii
CHAPTER ONE: INTRODUCTION ... 1
1.1 The Implantable Medical Devices Landscape ... 1
1.2 Power Delivery to Implantable Devices ... 2
CHAPTER TWO: BACKGROUND ... 6
2.1 Overview of Thermoelectric Materials ... 6
2.2 Thermoelectric Material Selection ... 9
2.2.1 Nanoscale Heat Conduction and Nanobulk Materials ... 10
2.3 Potential of TEGs in the Human Body ... 12
2.4 Current Landscape of Flexible TEG Designs ... 14
2.5 Screen Printing ... 18
2.5.1 Rheology, Surface Tension, and Surface Energy ... 20
CHAPTER THREE: EXPERIMENTAL METHODS ... 24
3.1 Manufacturing Overview ... 24
vii
3.3 Paste Synthesis ... 28
3.3.1 Screen Printing Binders and Solvents ... 28
3.3.2 Processing and Mixing ... 32
3.4 Printing ... 35
3.4.1 Printing Parameters, Substrates and Print Evaluation... 35
3.4.2 Cold Pressing ... 40
3.5 Annealing ... 40
3.5.1 Atmospheres, Temperatures, and Durations ... 40
3.6 Measuring Thermoelectric Properties ... 41
3.6.1 Van Der Pauw Method and Seebeck Measurement ... 41
CHAPTER 4: RESULTS AND DISCUSSION ... 43
4.1 Paste Formulations and Printing Trials ... 43
4.2 ThermoAura Nanobulk Pastes ... 48
4.2.1 Preliminary Samples Using QPAC Binder and ThermoAura Powders . 48 4.2.2 Cold Pressed Samples ... 52
4.2.3 ThermoAura Powders and ESL 400 ... 56
4.3 Sigma Aldrich Pastes ... 59
CHAPTER 5: CONCLUSIONS AND FUTURE WORK ... 62
5.1 Conclusions ... 62
5.2 Future Work ... 65
5.2.1 Electrical Conductivity Optimization ... 65
5.2.2 Design of Thermoelectric Devices... 66
viii
APPENDIX ... 74 Data for Electrical Conductivity, Seebeck Coefficient and Power Factor
ix
LIST OF TABLES
Table 1. Power generation of the human body under different physiological
states and activities [44] ... 12
Table 2. Powder loading ranges for different powder types ... 34
Table 3. Spreadsheet used for print evaluation ... 39
Table 4. Table for assessing printability of different ink formulations ... 43
Table 5. Comparison of printability of different paste compositions ... 44
Table 6. Samples of the QPAC pastes with ThermoAura powder annealed between 450 and 500 oC for 1 to 2 hours ... 49
Table 7. Atomic percentage of elements in a ThermoAura sample annealed at 450 oC for 1 hr. ... 52
Table 8. Results of second batch of Sigma Aldrich powder mixed with ESL 400 and annealed at 300 oC in a vacuum. ... 61
Table A.1 Data for Cold Pressed ThermoAura samples annealed between 250 to 350 oC in a vacuum atmosphere ... 75
Table A.2 Data for ThermoAura paste formulated with ESL 400 as the binder and solvent combo ... 76
Table A.3 Electrical conductivity, Seebeck coefficient and power factor of May, 2015 batch of ThermoAura powder mixed with ESL 400 and annealed between 250 and 400 oC in a vacuum atmosphere ... 77
x
LIST OF FIGURES
Figure 1. Future applications of TEG devices ... 3
Figure 2. Examples of electromagnetic kinetic energy harvesters for use in implantable medical devices [11] ... 3
Figure 3. Example of a material deformation creating a piezoelectric voltage [15] ... 4
Figure 4. Diagram showing the properties of TEGs being electrically connected in series and thermally connected in parallel [20] ... 7
Figure 5. Simple TEG design printed onto a PET substrate with gold conducting traces [23]... 7
Figure 6. Figure of merit for nanobulk materials as a function of temperature [34] ... 10
Figure 7. Schematic of in vitro experiment to test voltage output capabilities of a commercially available TEG using a piece of pork [19] ... 14
Figure 8. Heat exchanger design for micro-TEGs to enhance power output of the device [53] ... 16
Figure 9. Ink-jet printed thermoelectric device on Kapton [54] ... 17
Figure 10. Screen-printed thermoelectric device on Kapton [56] ... 17
Figure 11. TEG screen printed onto a glass fabric [22] ... 18
Figure 12. Visual example of how screen printers distribute inks onto substrates .... 19
Figure 13. MPM SPM screen printer ... 20
Figure 14. Newtonian and non-newtonian fluid response to varying shear rates [59] ... 21
xi
Figure 16. Manufacturing overview for developing thin film thermoelectric
devices... 25 Figure 17. Tool used to align height of laser to surface of screen ... 27 Figure 18. Processed screen with patterns rastered out for screen-printing ... 28 Figure 19. Thermo gravimetric analysis results of QPAC 40 binder in hydrogen,
nitrogen, air, and vacuum atmospheres [61] ... 30 Figure 20. Thermo gravimetric analysis of QPAC 40, ethyl cellulose (EC)
and polyvinyl butryal (AC) in air [62] ... 31 Figure 21. Vacuum chuck and alignment cameras on the SPM MPM screen
printer ... 36 Figure 22. Power per mass of a thermoelectric device vs. its fill factor at
different substrate thicknesses [70] ... 37 Figure 23. Example of bleed out and pinholes occurring in a print ... 38 Figure 24. High-level overview of measurement setup for Van Der Pauw
method... 42 Figure 25. High-level overview of measurement setup for Seebeck coefficient ... 42 Figure 26. Print of thermoelectric powder using ethylene glycol as the solvent ... 45 Figure 27. Print of 25% QPAC paste. Note the pulling off of material across
the face of the print ... 46 Figure 28. Example of wave patterns and cracking in samples with less than
10% QPAC binder content... 47 Figure 29. Comparison of prints from pastes formulated with (a) 20% QPAC
and (b) ESL 400 ... 48 Figure 30. ThermoAura sample annealed at 450 oC for 1 hour, with a 20%
QPAC binder ... 50 Figure 31. EDS scan of ThermoAura sample annealed at 450 oC for 1 hr,
formulated with a 20% QPAC binder ... 51 Figure 32. Mesh patterns evident in thicker screen printed samples using
xii
Figure 33. Cold pressed ThermoAura samples resulting (a) electrical conductivity, (b) Seebeck coefficient, and (c) power factor ... 54 Figure 34. SEM image of sample annealed at 250C for 1 hour. Note the “hills”
that formed during the printing process ... 55 Figure 35. SEM image of sample annealed at 300 oC for 1 hour. Note the increase
in cracking from the 250 oC sample ... 55 Figure 36. SEM image of sample annealed at 350 oC for 1 hour. Even more
cracking is evidenced than the 300 oC sample. ... 56 Figure 37. Electrical conductivity, Seebeck coefficient and power factor of
ThermoAura paste consisting of ESL 400 as the binder and solvent combo ... 57 Figure 38. Electrical conductivity, Seebeck coefficient, and power factor of May
2015 batch of ThermoAura powder with ESL 400 as the binder and solvent combo ... 58 Figure 39. Electrical conductivity, Seebeck coefficient and power factor of samples
formulated using Sigma Adlrich Bi2Te3 and ESL 400 as the binder and
solvent combo ... 60 Figure 40. Comparison between prints made with (a) Sigma Aldrich powder
and (b) ThermoAura powder ... 65 Figure 41. Example thermoelectric leg area utilizing Equation 9 [24] ... 66 Figure 42. Manufacturing process and basic design for (a) cross-plane TEGs
xiii
LIST OF ABBREVIATIONS TEG Thermoelectric Generator
WSN Wireless Sensor Networ
PET Polyethylene Terephthalate
BAT Bismuth Antimony Telluride
PEDOT:PSS Poly(3,4-ethylenedioxythiophene) Polystyrene Sulfonate
SPS Spark Plasma Sintering
MEMS Micro Electrical Mechanical Systems
CNC Computer Numeric Control
FEM Finite Element Method
AC Acrylic
PVB Polyvinyl Butyral
ESL Electro Science Labratories
CHAPTER ONE: INTRODUCTION
1.1 The Implantable Medical Devices Landscape
Implantable medical devices have become a mainstay in today’s medical landscape. Devices such as pacemakers, defibrillator, and cochlear implants are becoming smaller, more robust, and more powerful as technology in the medical field develops. With this advancement, there is a need for power delivery to these devices to become smaller, more robust, and more powerful.
Each of these devices has a unique purpose, but are all small implantable devices operating within the human body. A pacemaker is a device planted in the chest cavity that controls for abnormal heart rhythms. According to Research and Markets, the global market for the pacemaker will be $5.1 billion by 2015, with the United States and Europe controlling 40% and 30% of the market, respectively [1]. The market for pacemakers is projected to grow by 13.82% between 2013 and 2018 [2]. This is most likely due to the influx of elderly citizens needing implantable cardiac medical devices. Between 2000 and 2050, it is projected that the population of the world over 65 years of age will increase from 6.8% to 16.2% [3]. Furthermore, between 2004 and 2009, there were 737,840 new pacemaker implants worldwide, as well as 264,824 replacement implants [4]. Of those replacements, the United States had 225,567 new implants, the largest number
worldwide.
the heart to control for ventricular fibrillation, which has the potential to cause sudden cardiac arrest [5]. According to Research and Markets, the market for implantable cardioverter defibrillators (ICDs) is projected to be $6.2 billion by 2015 [6]. This is due to the rising incidence of heart disease worldwide.
1.2 Power Delivery to Implantable Devices
Current implantable medical devices all have the same inherent drawback: they all require a battery with a lifespan less than the device itself. This inherent drawback requires that the patients have surgery to replace the battery, or possibly the entire device, before the actual device needs to be replaced. For example, the average lifespan of an implantable defibrillator is 10 years, but the device has to be replaced every 4.7 years due to the lifespan of the battery [7]. Even though batteries have a limited lifespan, they are still the only source reliable enough to be used in implantable medical devices. These devices require a very consistent, continuous, and safe power source due to the nature of their application as a life-saving device.
Batteries have a long history with implantable medical devices and many advances are still being made today in battery technology. Early devices used nickel-cadmium based batteries, but with the introduction of lithium-ion technology the
Figure 1. Future applications of TEG devices
The end goal of a thermoelectric device is to harvest a freely available and existing energy (body heat in this case) for use in powering medical devices. Several other devices have gained traction in research for use as an energy harvester to power medical devices. These devices include electromagnetic, electrostatic, and piezoelectric energy harvesters [9]. Electromagnetic devices operate on the principal of the Faraday-Neumann-Lenz law, in that as a coil moves through a magnetic field, a voltage is generated proportional to the strength of the magnetic flux between the coil and field [10]. This basic principle has led to the development of several devices that use the motion of the body to move magnetic objects between one another to generate a voltage, as seen in Figure 2.
Electrostatic devices use a variable capacitor where the electrodes of the capacitor can shift. When implanted in a human, the motion of the human causes the electrodes to shift relative to the stationary position of the capacitor, and thus, causes the capacitance of the device to change [10, 12]. This change in capacitance causes a change in the stored energy, creating a voltage for use in various devices.
Piezoelectricity is the phenomenon that occurs when a voltage is created by a deformed material. The deformation of the material is caused by various forces, forcing the magnetic ions within the structure closer or further from one another, and thus creating a voltage due to the relative charges of the ions in the material [13, 14]. An example of this phenomenon is displayed in Figure 3. Due to the nature of piezoelectric devices, it is ideal to place them in areas of the human body where there are high forces, such as the knees and in the hips [9, 13].
Figure 3. Example of a material deformation creating a piezoelectric voltage [15]
pacemaker is 8 μW [16], while the range of power requirements for a cardioverter defibrillator is between 145 μW to 5.16 mW [17, 18]. Other values for cardioverter defibrillators and pacemakers are reported as low as 30 μW [19]. This power requirement continues to fluctuate as the technology for implantable devices becomes more advanced, as well as with the advent of wireless sensor networks (WSN) designed to monitor biomedical signals in real time [12].
There is an obvious need in the market place for energy harvesting technologies such as thermoelectric devices. Even though the increasing technology and sophistication of microelectronics is decreasing the power draw of modern devices, the modern battery still does not match the lifespan of these devices, nor does any current energy harvester match the required power draw. An energy harvester that can supply power in the μW to mW range, consistently and continuously, would revolutionize the current implantable medical device landscape by drastically reducing the amount of invasive procedures needed to replace batteries in the devices.
CHAPTER TWO: BACKGROUND 2.1 Overview of Thermoelectric Materials
Electromagnetic, electrostatic, and piezoelectric energy harvesters all require some degree of human movement or pressure within the body to create a voltage for implantable usage. Thermoelectric generators (TEGs) are the alternative energy
harvesters that have become quite ubiquitous in research fields for powering biomedical devices. TEGs operate on the basic principle of the Seebeck effect, where a voltage is generated due to a temperature gradient across a semiconductor or conductor material [20]. The Peltier effect is also important in analyzing thermoelectric devices, whereby an electrical current causes a heat pumping effect at the site of the thermoelectric junctions. The Seebeck effect is shown mathematically in Equation 1 [21].
𝑉0 = 𝑁𝛼∆𝑇 (1)
where V0 is the output voltage of the device, N is the number of thermoelectric couples in the design, α is the Seebeck coefficient, and ΔT is the temperature gradient across the device.
Figure 4. Diagram showing the properties of TEGs being electrically connected in series and thermally connected in parallel [20]
Figure 5. Simple TEG design printed onto a PET substrate with gold conducting traces [23]
With the addition of an N and P-type material into the design, Equation 1 must be modified to account for the two separate materials used to create a voltage, as seen in Equation 2 [24-26].
𝑉0 = 𝑁(𝛼𝑎− 𝛼𝑏)∆𝑇= 𝑁𝛼𝑎𝑏∆𝑇 (2)
where αab represents the difference between the Seebeck coefficients of the P-type and
While Equation 2 allows for an analysis of the voltage output for a given thermoelectric device, a dimensionless quantity known as the Figure of merit is used to characterize the performance of a given thermoelectric device. A larger Figure of merit represents a more efficient device and the objective of TEG design is to maximize this quantity. The Figure of merit is calculated using Equation 3 [27, 28].
𝑍𝑇 = 𝛼2𝑘𝜎T (3)
where ZT represents the Figure of merit, σ is the electrical conductivity of the device, and k is the thermal conductivity of the device. α2σ is also known as the power factor of the device, and is used in cases where ZT cannot be calculated due to not being able to measure the thermal conductivity of the device.
From Equation 3, it is clear that to obtain a larger Figure of merit it is necessary to maximize electrical conductivity while also minimizing the thermal conductivity. This represents a design constraint, as these two variables tend to be proportional to one another in materials [29]. While Figure of merit allows for an objective measure of device performance, it is also important to evaluate the maximum output power of the device. Maximum power generation for a TEG occurs when the internal resistance of the TEG equals the load resistance [30]. The maximum power output for a TEG is
represented by Equation 4 [31, 32].
𝑃𝑚𝑎𝑥 =𝑁
2𝛼2∆𝑇2
𝑅𝑇𝐸𝐺 (4)
where Pmax represents the maximum power output and RTEG represents the internal
2.2 Thermoelectric Material Selection
Material selection is extremely important in the design of TEGs. The most
common compounds in TEGs operating at room temperature are N-type bismuth telluride (Bi2Te3) and P-type antimony telluride (Sb2Te3) compounds. Alternative materials used
in TEG design range are lead-based compounds, silicon-germanium (SiGe) based
compounds, half-heusler, and skutterudites [20, 33]. These materials have a wide range of temperature applications; however, for the purposes of this research, bismuth, antimony, and tellurium-based compounds were the focus of this research due to their ZT being the highest of all thermoelectric compounds at room temperature.
A major area of focus for bismuth, antimony, and tellurium-based compounds (henceforth, referred to as BAT materials) has been on reducing the thermal conductivity of bulk materials to enhance the Figure of merit of TEG devices. This has largely been accomplished through understanding the nanostructures of materials and also
constructing materials from a “bottom-up” perspective to craft the atomic structures in a way that maximizes the power factor and minimizes the thermal conductivity [34, 35]. A common method for creating BAT powders is to take pure BAT elements and combine them in a ball-mill to create Bi2Te3 and Sb2Te3 [23, 36, 37]. A new process developed by
Mehta et al. (2012) allows for nano-structured BAT materials to be crafted in bulk quantities, overcoming previous constraints to allow for designs using higher ZT values and power generation [34].
that they do not use heavy metals, are much more flexible than BAT materials, and they are more cost effective [24, 38]. The main drawback of organic-based TEG materials is their small Figure of merit compared to inorganic types, such as BAT materials.
A lot of research has been focused on BAT materials in recents years, specifically with the goal of crafting materials from a bottom-up perspective to craft materials with lower thermal conductivities. These materials do not follow the classical laws of heat transfer via diffusion, and thus, nanoscale heat conduction must be understood to properly understand the advantages of these materials.
2.2.1 Nanoscale Heat Conduction and Nanobulk Materials
Materials created from a bottom-up perspective have gained a lot of attention in recent years due to the potential to increase material efficiency by decreasing thermal conductivity of the material.
Nanobulk materials do not follow Fourier’s law of diffusion based heat transfer. Nanoscale conduction follows the laws of quantum physics, where electron transfer and lattice vibrations (phonons) are the main drivers of heat transfer. Phonons are the main energy transport medium in semi-conductors, whereas electrons are responsible for energy transfer in metals. Key characteristics of nanoscale conduction include mean free path, carrier relaxation time, and boundary scattering [39, 40]. Mean free path is the distance that particles travel between boundaries within the material, colliding with a physical piece of the material. When the distance between the material collisions is less than the mean free path particle, boundary scattering causes deflection of energy in different directions depending on the structure of the material at the interaction point. The relaxation time is the time between collisions with particles or the material itself.
At the nanoscale, heat transferring particles can no longer travel the distance of their mean free path without interacting with physical boundaries. The boundary scattering that occurs causes a reduction in the thermal conductivity of the material. Superlattices were developed specifically with this goal in mind [41].
Nanostructuring techniques allow for the reduction in phonon thermal
2.3 Potential of TEGs in the Human Body
All of the development and enhancement of thermoelectric devices is futile unless the human body is capable of creating a thermal gradient large enough to be harvested. Table 1 illustrates the potential that the entire human body has for generating power to be harvested. While this information is idealized and encompasses the entire body, it still shows a large amount of power is generated, even while sleeping.
Table 1. Power generation of the human body under different physiological states and activities [44]
PEDOT:PSS based fabrics for thermoelectric energy harvesting [45]. Their analysis of the human body in a non-active state showed that a maximum Carnot efficiency of 7.10% and a max power of 6.17 W are available for harvesting at an ambient temperature of 288 K (~ 60 Fahrenheit). This is assuming the human body temperature is constant at 310 K.
All of this information applies to the entire body. For a thermoelectric device to be effective, there must be a proper amount of power and thermal gradient generated in small, localized areas. Although TEGs have many uses, there was still ambiguity as to whether the human body was capable of producing the heat gradients necessary to power implantable devices until it was explored further [19]. The analysis by Yang et al. used numerical simulations as well as an in vitro experiment using a piece of pork (Figure 7) and an in vivo experiment using a live rabbit. Utilizing the 3D Pennes bioheat transfer Equation shown in Equation 5, their numerical analysis revealed that a typical heat gradient under the skin surface was on average .482 K, but could be as high as 5 K depending on ambient conditions.
𝜌𝑐𝜕𝑇𝜕𝑡(𝑋,𝑡) =∇k(X)∇[T(X, t)] +𝑄𝑏+𝑄𝑚 (5)
where ρ is the density of tissue, c is the specific heat of tissue, T(X,t) is the temperature distribution throughout the tissue, X represents a 3D vector consisting of the x, y, and z directions, k(X) is the thermal conductivity in the tissue in three dimensions, Qb is the
Figure 7. Schematic of in vitro experiment to test voltage output capabilities of a commercially available TEG using a piece of pork [19]
When implanting a TEG into the pork, and creating a thermal gradient within the pork of .5 K using a copper plate and ambient temperatures, the reported output voltage of the commercially available TEG was 3.3 mV. In vivo experiments with the rabbit revealed a temperature gradient of 1.3 K with a respective output voltage of 5 mV. Their analysis compared the output voltage to the minimum requirement of an implantable bio-fuel cell of .52 V. Under ideal conditions of a 1.2 V output and a thermal gradient of 5 K, the researchers calculated a potential power output of 14.4 μW, with the admission that future advancements would yield greater power outputs. Although voltage is not a direct comparison to power, the researchers show through their theoretical analysis that
exploration of thermoelectric devices in the human body has high potential. 2.4 Current Landscape of Flexible TEG Designs
amplifiers [46, 47]. Another popular research area is the utilization of thermoelectrics to recover waste heat from the exhaust of vehicles to recycle energy back into the drive train, and thus enhance vehicle efficiency [48, 49].
Many other designs have come about over time to attempt to maximize the power output of thermoelectric designs; some have been more effective than others. A design consisting of a coiled up strip of thermoelectric legs, with an effective diameter of 35 mm and a temperature gradient of 5K achieved a power output of 2 μW [26]. A flexible thermoelectric generator consisting of 100 bismuth telluride and antimony telluride thermoelectric legs, co-sputtered onto a kapton substrate, obtained a power output of 32 nW at a 40K temperature gradient [24]. Another flexible design consisted of nano-structure BAT materials printed to a kapton substrate using a technique called Spark Plasma Sintering (SPS). They achieved a maximum power output of 14.3 nW at a ΔT of 14.3 K and 17 thermocouples [50].
Figure 8. Heat exchanger design for micro-TEGs to enhance power output of the device [53]
Using ink-jet printing as the main printing method, several research groups have achieved success printing devices onto Kapton substrates. Of them, one created a device capable of generating 1 mV of voltage at room temperature with a maximum power factor of 77 μW/m-K-2
[54], shown in Figure 9. A research group at Berkeley
Figure 9. Ink-jet printed thermoelectric device on Kapton [54]
Screen-printing has been explored and also shown to be an efficient and successful way to print thermoelectric devices. The device displayed in Figure 10 was able to achieve a maximum power output of 40.3 nW with a 20 K temperature difference and 8 thermocouples [56].
Figure 10. Screen-printed thermoelectric device on Kapton [56]
materials onto an alumina substrate achieved a power output density of 2 mW/g under the same conditions.
Figure 11. TEG screen printed onto a glass fabric [22]
The above devices all operate by printing alternating N-type and P-type materials and connecting them with a conductive material, such as silver. A thermal gradient is then applied between the two ends of the device, creating power that can be harvested. Printing two different materials to a substrate requires an economical and simple method for mass production. The most common methods to accomplish this are screen-printing and ink-jet printing. Although similar, ink compositions are different for both methods and require different pieces of equipment. Ink-jet printing uses a pump to dispense ink through a pen-shaped head into specific patterns that can be controlled using Computer Numeric Control (CNC) programs. Screen-printing uses a porous screen to push ink through into specific patterns
2.5 Screen Printing
There are many methods for printing thermoelectric materials to their respective substrates, including flash evaporation, electrochemical deposition, laser deposition, co-sputtering, and molecular beam epitaxy [57]. Other researchers have attempted using surface micromachining techniques as well using bulk materials [25].
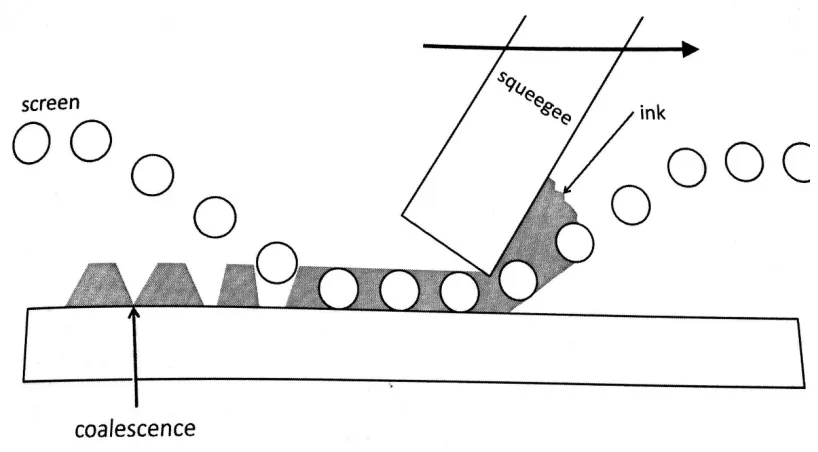
compared to more complex methods [21, 23]. The screen-printing technique consists of taking a special screen, designed for printing electrical conductors onto printed circuit boards, and utilizing thermoelectric pastes to print the material onto the specified substrate. The screen has a metal or plastic wire mesh where the paste is able to flow through. The screen is generally placed about 1 mm from the substrate while the paste is then placed on top of the screen. A squeegee then goes across the surface of the screen, forcing the screen down onto the substrate and pushing the paste onto the substrate. When the squeegee finishes passing over the screen, the screen then returns to its original shape, shown visually in Figure 12. Ideal viscosities for screen-printing are in the range of 10-20 Pa-s (10000-20000 cP) and produce a thickness of 10 – 30 μm depending on the density of the mesh, as well as the emulsion thickness of the screen [58]. This research will be using the MPM SPM (Figure 13) screen printer to print thermoelectric pastes onto specified substrates.
Figure 13. MPM SPM screen printer
2.5.1 Rheology, Surface Tension, and Surface Energy
While viscosity is an important characteristic of TEG paste that must be
considered when developing the paste for printability, there are several other factors that must be taken into consideration when developing pastes. Chief among these
characteristics is the rheology of the ink when designing for screen-printing. The rheology of an ink or fluid determines how that fluid will respond to shear rate and different forces. While many common fluids exhibit Newtonian behavior, meaning they will deform elastically when a force is applied to them, inks and various other fluids will behave pseudoplastically under identical circumstances. Figure 14 displays a
Figure 14. Newtonian and non-newtonian fluid response to varying shear rates [59]
Pseudoplastic fluids will decrease in viscosity when shear stress is applied to it. With respect to a screen printing ink, this is a desired characteristic when the ink is being forced through the mesh. As the fluid moves through the screen, very high shear forces are being applied to the ink, allowing it to flow with a low viscosity through the mesh. When the mesh is removed, the ink will settle back into its original viscosity. This shear-thinning behavior allows the ink to not have a mesh imprint in the print when the screen is removed. Screen printing inks are not only pseudoplastic, but also thixotropic, meaning the inks exhibit a time dependent relationship with shear stress [60]. As shown in Figure 15, thixotropic inks will exhibit shear-thinning behavior at constant shear rates, and over time will settle back into their original viscosity when these forces are applied. The time and rate at which the ink will return to its original viscosity are dependent on the
Figure 15. Time dependent viscosity properties of thixotropic fluids [60]
Other important characteristics of ink printability lie in the ink’s interaction with the substrate. The surface tension of the ink and the surface energy of the substrate directly affect how much the ink will adhere to the surface of the substrate. The
interaction between surface tension and surface energy will directly determine how well the ink will adhere to the substrate after annealing. Surface tension and surface energy are directly proportional characteristics, where generally the surface tension of the ink must be lower than the surface energy of the substrate for the ink to properly adhere to the substrate when printed [60]. A higher surface energy on a substrate’s surface will result in a better print resolution as well as a stronger adhesion to the substrate itself.
Conversely, an ink with too high of a surface tension will result in poor adhesion to the substrate and make printing with any sort of accepTable resolution virtually impossible.
CHAPTER THREE: EXPERIMENTAL METHODS 3.1 Manufacturing Overview
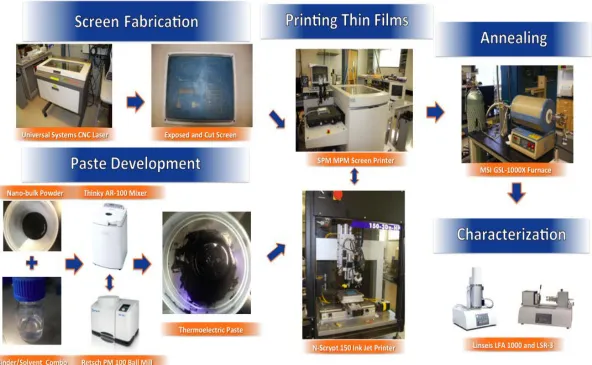
The focus of this work was to design a process for manufacturing and evaluating thin film thermoelectric devices. The process through which this is completed was broken down into five major categories, as shown in Figure 16. Each of these segments was then broken down into individual steps for completion.
25
3.2 Screen Fabrication
Solidworks and CorelDRAW 12 were used to design the patterns for screen-printing. The patterns were drawn up in Solidworks and saved as a DXF file to be exported to CorelDRAW 12 for processing.
Screen-printing requires a specialty screen comprising of stainless steel or polyester wires tensioned between a metal frame. These wires are then coated in an emulsion that is exposed via ultraviolet light for several days. Once the screen is exposed, it can then be processed for printing purposes.
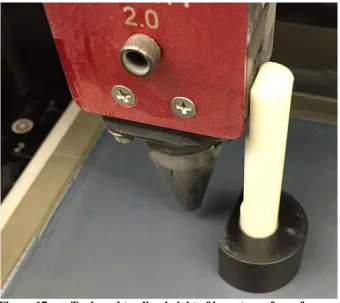
Figure 17. Tool used to align height of laser to surface of screen
Using CorelDRAW, the designed pattern was sent to the laser printer, where the settings were adjusted for rastering the screen. The laser system would then raster the pattern out of the screen, as shown in Figure 18. Once the cutting was completed, the area around the cutout pattern was cleaned using isopropyl alcohol to remove potential
Figure 18. Processed screen with patterns rastered out for screen-printing
3.3 Paste Synthesis
3.3.1 Screen Printing Binders and Solvents
A thermoelectric paste consists of three main ingredients when being designed for screen-printing: thermoelectric material powder, a polymer binder, and a solvent to combine the ingredients. The purpose of the polymer binder is to modify the rheology of the thermoelectric paste so that it exhibits thixotropic properties. This thixotropy allows the ink to flow through the screen and create a high-resolution print with a uniform surface once the screen is removed. The solvent is for adjusting the viscosity of the final paste.
Solvent choice is equally as critical in the ink-forming process. Each of these binders exhibit different chemical properties and are only compatible with certain types of solvents. QPAC 40 is compatible with di-polar aprotic solvents such as acetone and propylene carbonate. Ethyl cellulose and polyvinyl butryal, however, are compatible with both di-polar aprotic solvents and polar protic solvents such as isopropyl alcohol. Beyond their compatibility with the binders, solvents must also meet certain criteria with respect to surface tension and boiling point. Solvent for screen-printing should have a low surface tension so that the print can have strong adhesion to the substrate. A surface tension value below 40 dynes/cm is accepTable for screen-printing, and surfactants are regularly employed in ink formulations to help with this cause [60]. Boiling point values cannot be too low or the ink will evaporate too rapidly during the printing process and cause issues with sticking and low resolution prints. Too high of a boiling point will result in an ink that will have difficulty drying.
There are several advantages to the different binder and solvent combos employed in screen-printing. Ethyl cellulose and polyvinyl butyral both require the presence of oxygen for complete burnout while annealing and typically leave more ash residues. QPAC 40 holds the advantage of being able to be removed in an inert or vacuum
Figure 20. Thermo gravimetric analysis of QPAC 40, ethyl cellulose (EC) and polyvinyl butryal (AC) in air [62]
Based on these rheological properties, any thermoelectric paste designed from screen-printing must be thixotropic, have a viscosity between 10000-20000 cP
(consistency of honey) for proper printing resolution, and ideally have a binder that can be burned out in inert atmospheres to avoid oxidation of the sample. The ink should minimize the porosity in the final print, while having a uniform surfaced and minimal bleed out outside of the print area.
powders. A fine glass powder designed to soften and melt at around 450 – 500 oC acts as a densification aid in the final portion of firing the prints. The glass powder also increases the bonding between the paste and the substrate itself. The molten glass in the paste opens up diffusion pathways within the paste body. This allows the paste to rearrange itself, decreasing its surface area and also decreasing the open spacing between grains (grain boundary). This process is essentially a transformation of the surface energy and grain boundary energy into bulk energy, compacting the paste in the process.
The above criteria left QPAC 40, a rheological modifier from Empower Materials, and ESL 400, a specialty ink vehicle purchased from Electro Sciences Laboratory, for developing proper screen printing inks. Earlier stages of the ink development strictly used ethylene glycol as the solvent mixed with thermoelectric powder. Formulations using ethyl cellulose were not explored in this study due to the need of ambient atmosphere to remove the binder and the occurrence of leftover ash residue from the binder. Using QPAC 40 and ESL 400 as the main ingredients in forming ink vehicles, formulations were developed to test the printability of these binder and solvent combinations.
3.3.2 Processing and Mixing
agitation, so generally the ink vehicles were mixed every couple of hours for 15 minutes at a time for several days until no bead agglomerates were left. An overhead mixer was the recommended tool for continuous agitation of the vehicles, but was unavailable for this work.
Nanobulk Bi2Te2.7Se.3 N-type powders were supplied by ThermoAura inc. for the
purposes of this work. Bi2Te3 powders were purchased from Sigma Aldrich to perform
comparison tests between the two materials. Multiple batches of powder were supplied by ThermoAura and were tested as individual specimens. ThermoAura powders came equipped with a capping agent that prevents the material from being oxidized in ambient atmosphere. Sigma Aldrich powders were sealed in an argon atmosphere prior to
shipment.
BAT materials in transport eventually become conglomerated due to vibrations and Brownian motion, and require mechanical milling to break down chunks of particles. Powders were either mechanically ground using a mortar and pestle or suspended in acetone and probe sonicated for 15 minutes and then dried on a hotplate. Powders supplied by Sigma Aldrich were already milled prior to shipment and required no more mechanical milling.
The ink making process required the pre-made binder/solvent combo to be mixed with the powder and evenly dispersed. The weight percentage of powder that can be used in any ink batch is highly dependent on the size of the particles in the powder, the
binder/solvent combo. The molecular weight of the QPAC 40 supplied by Empower Materials for this work was 279,000.
Each ink should have the maximum amount of powder mixed in to maximize the amount of thermoelectric material being printed. Too much powder in the ink would result in an ink that was too viscous and more of a slurry consistency. Too little powder in the ink would result in ink without enough viscosity and would cause bleed out of the print and non-uniform surfaces. Regardless of the material composition, every powder has a different powder-loading dependent on the particle size and must be tested to determine the correct amount of powder.
To achieve ideal powder loading, powders were added to ink vehicles and printed using a 1x1 cm square. It was noticed that below the recommended weight percentage for the powder loading that the inks would bead up and bleed out throughout the printing pattern. Above the maximum range for powder loading, inks would become a viscous slurry and weren’t printable due to the adhesion to the screen. Ideal viscosities were achieved at the powder loading shown in Table 2, and generally were the consistency of honey.
Table 2. Powder loading ranges for different powder types
Powder
Powder Loading Range
(Weight %) ThermoAura
Nanobulk 45-55
Sigma
Aldrich 70-75
the use of a ball mill to create pastes by mixing raw tellurium and bismuth together along with other ingredients [55, 63-69]. Another popular option is the use of a three roll mill, which combines the ingredients and simultaneously breaks up chunks of particles by continuous rollers crushing the particles in the ink [56].
3.4 Printing
3.4.1 Printing Parameters, Substrates and Print Evaluation
To print thermoelectric inks, a bead of ink is placed around one edge of the cutout pattern in a processed screen, and then the ink is pressed through the screen using a squeegee onto a substrate. The simplicity of this process allows for screen-printing to have a high degree of scalability and cost efficiency. The MPM SPM screen printer allows for adjustment of many variables that have a direct effect on the quality of prints. These include squeegee force, squeegee speed, squeegee material, snap-off distance, and snap-off delay time. Typical squeegee blade materials include a polymer blade or a metal blade, each chosen specifically based on the wire material in the screen. Each of these variables can be adjusted to obtain higher quality prints.
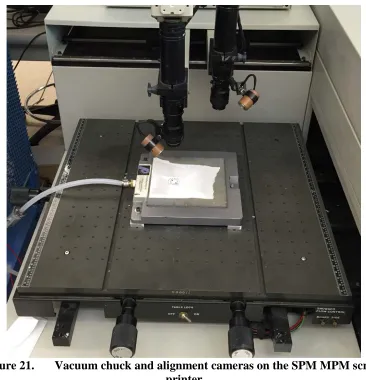
can then be setup using the onboard computer. The vacuum chuck and alignment cameras are shown in Figure 21.
Figure 21. Vacuum chuck and alignment cameras on the SPM MPM screen printer
The screens used in this study were 325-mesh screens, which gave a print thickness between 10 and 20 microns, as well as an 80-mesh screen, which was strictly used for cold pressing due to the thicker print size of roughly 70 microns. Substrates used for this study include glass, low temperature co-fired ceramic (LTCC), Kapton
primary substrate due to its ability to withstand temperatures up to 450 oC as well as its inherent flexibility. Substrate selection has a direct effect on the thermal efficiency of the device. Thickness of the substrate should be kept to a minimum as well to help maintain the thermal gradient within the device. Figure 22 describes the power output of a device when different thicknesses were used for substrates [70]. The fill-factor variable on the x-axis is defined as the ratio of the area of the thermoelectric module to the area of the substrate. From Figure 22 it is clear that as the substrate thickness increases, the power output per mass of the device decreases. All of the substrates were batch sonicated in acetone for 15 min and wiped with acetone prior to printing to clean the surface. The samples were dried for 15 min at 70 oC after printing. Too high of a drying temperature would result in porosity in the sample due to rapid evaporation of the solvent. A high drying temperature also exposes the films to the risk of oxidation.
Evaluation of prints comes down to several factors that attempt to quantify the resolution of the printing edges, the porosity of the print, as well as the surface uniformity of the print on its top surface. Prints were judged on bleed-out, surface uniformity,
occurrence of pinholes, edge notching, and edge thickening. Bleed-out is an excess of ink printing beyond the edges of the screen pattern, surface uniformity is the relative flatness of the surface of the print, pinholes are pores that occur in the print all the way down to the surface of the substrate, and edge notching and thickening are non-uniform patterns occurring at the edges of prints. Figure 23 gives visual examples of a few of these judging criteria.
Figure 23. Example of bleed out and pinholes occurring in a print
39
Table 3. Spreadsheet used for print evaluation Sample
Number Force Print (lbs) Print Speed (in/s) Snap-off Delay (s) Snap-off Distance (in) Bleed out
(yes/no) Notches Edge (yes/no) Edge Thickening (yes/no) Visible Screen Pattern (yes/no) Pin Holes
3.4.2 Cold Pressing
The potential of cold pressing samples after printing was also explored in this study. Samples were placed in the cold press machine with either silicon or kapton on top of them to prevent delamination of the film. The cold pressing force was increased until either cracking of the substrate occurred for rigid substrates, or delamination became a prominent issue. The pressure at which substrate cracking or sample delamination became an issue was above 89 MPa. This pressure was maintained during cold pressing trials as a safe pressure to use when comparing samples that weren’t cold pressed.
3.5 Annealing
3.5.1 Atmospheres, Temperatures, and Durations
Annealing is one of the most critical steps in the development of thermoelectric devices. The purpose of annealing is to remove the non-conductive solvent and binder systems from the samples. Annealing also sinters the thermoelectric materials and increases the thermoelectric properties of the device. A vacuum atmosphere of 80 Torr and an argon atmosphere were used in this study. The samples were placed in the center of the tube furnace and sealed. The furnace was then purged three times using argon and vacuum atmospheres. Once purging was completed, either argon gas or a vacuum atmosphere was left on for the duration of the annealing.
Annealing temperatures ranged between 250 oC up to 500 oC. The ramping rate for Kapton was 3 oC per minute due its large coefficient of thermal expansion compared to BAT materials. The duration of the annealing times was varied between 30 minutes up to 4 hours with the intention of maximizing thermoelectric properties at different
non-conductive due to the binder still being present in the samples. Generally, only three or four samples were placed in the furnace at a single time due to the small area available for annealing in the tube furnace. A complete printing and annealing process took upwards of eight hours per batch and many of the annealing conditions were not retested because of this limitation.
3.6 Measuring Thermoelectric Properties
3.6.1 Van Der Pauw Method and Seebeck Measurement
Measuring electrical conductivity was done using the Van Der Pauw method [71]. To use this method, the sample must have uniform thickness and the sample thickness must be less than the width and length of the sample. Four contacts were placed at the four corners of the sample, labeled 1, 2, 3, and 4. The resistance of the sample was measured in multiple directions using a Labview program. The sheet resistance was calculated by utilizing the Van Der Pauw Equation (7). Electrical conductivity was then calculated by measuring the thickness of the sample and using Equation 8.
𝑒(−𝑝𝑖∗𝑅1234𝑅𝑠 )+ 𝑒(−𝑝𝑖∗𝑅4123𝑅𝑠 ) = 1 (7)
σ =𝑅1
𝑠∗𝑡 (8)
where R1234 and R4123 are the different direction of current flow in the sample across the
sample, Rs is the sheet resistance of the sample, and t is the thickness of the sample.
Seebeck coefficient is extracted by taking the slope of the voltage vs. ΔT. A high level overview of the measurement process for Van Der Pauw and Seebeck measurements are shown in Figure 24 and 25.
Figure 24. High-level overview of measurement setup for Van Der Pauw method
CHAPTER 4: RESULTS AND DISCUSSION 4.1 Paste Formulations and Printing Trials
The performance of each paste was evaluated using Table 3 from a printability standpoint and eventually compared to one another. Table 4 gives more details as to how each category was assessed for each print, rated on a plus and minus score system. Table 4. Table for assessing printability of different ink formulations
Test
Score Bleed-Out Pinholes Surface Uniformity Green Strength Stickiness
++
Minimal to no runoff outside the print area of the material
No noticable holes or surface divots
formed
Surface appears flat to the eye
Material does not come off after repeated bending Material does not stick to screen +
Some runoff to outside of print
area, but nothing of concern Minimal surface divots formed, no holes through to the substrate Slight abberations in surface that are localized and not present throughout
the surface
Small amount of material dust
comes off during repeated
bending. No flakes form and
come off.
N/A
-
Obvious runoff outside of print area. Would make printing in small areas more difficult.
Noticable small holes or
divots that affect surface uniformity Aberration or pattern present throughout entire
surface of print. Degree of surface height difference is
not discernable by eye.
Large amount of dust comes off the prints with repeated bending. Flaking
and cracking begins to occur.
N/A - - Extreme runout. Practically unusable in device design.
Many holes in the print, or
large holes present in the
The plus and minus symbols represent a relative positive or negative aspect of that particular paste composition. Green strength represents the resistance of the film to damage pre and post annealing and also its adherence to substrates after annealing. Stickiness is the propensity of the paste formula to stick to the screen and drag material after removing the screen. The results of the different print formulations printability are summarized in Table 5. A new ink vehicle and ink were made for each composition by first creating the ink vehicle with the desired binder weight percentage, and then adding powder to it.
Table 5. Comparison of printability of different paste compositions
Paste
Composition Bleed-Out Pinholes Uniformity Surface Strength Green Stickiness
ESL 400 ++ ++ ++ ++ ++
QPAC 25% + N/A - - N/A - -
QPAC 20% ++ ++ ++ - ++
QPAC 15% + ++ + - ++
QPAC 10% + + - - ++
QPAC 5% + + - - ++
QPAC 1% + + - - ++
Ethylene
Glycol - - - - - - N/A ++
Figure 26. Print of thermoelectric powder using ethylene glycol as the solvent
Prints using ethylene glycol were characterized by extreme unpredictability, bleed out, and very non-uniform surfaces. Overall the prints using ethylene glycol were
unusable, even after many modifications to the ratio of solvent to powder.
Drastic improvements were noticed when a binder was introduced into the paste formula when screen-printing. Different formulations of QPAC binder were tested to produce the best print quality using thermoelectric powders. Since epoxy binders are not conductive, the goal of the paste formulations was to use a binder that would exit the films when annealed in an anaerobic atmosphere to prevent oxidation; QPAC is one of the few binders that do exhibit this ability. Furthermore, reducing the amount of binder in the paste formulations would theoretically decrease the amount of material exiting the film during the annealing process, and thus improving the porosity and electrical
Figure 27. Print of 25% QPAC paste. Note the pulling off of material across the face of the print
As the binder content was decreased from 20% down to 1%, several
characteristics of the paste changed. With decreasing binder content, the stickiness that was exhibited by the 25% QPAC formulation no longer was an issue, while the tendency of pinholes and bleed out to occur stayed relatively consistent throughout different formulations. Surface uniformity noticeably decreased in quality as binder content decreased, as less rheological modifier was available to help stabilize the leveling
Figure 28. Example of wave patterns and cracking in samples with less than 10% QPAC binder content
Figure 29. Comparison of prints from pastes formulated with (a) 20% QPAC and (b) ESL 400
The largest difference between the ESL 400 paste and the 20% QPAC paste is due to the difference in green strength between the two formulations. The 20% QPAC paste proved to be very fragile post annealing, causing delamination and material to come off as dust when repeated bending occurred. The ESL 400 formulations stayed sTable in repeated bending tests and proved to be much more resistant to damage. QPAC formulations were continuously tested, though, due to their hypothesized advantage of binder burnout in inert and vacuum atmospheres.
4.2 ThermoAura Nanobulk Pastes
4.2.1 Preliminary Samples Using QPAC Binder and ThermoAura Powders
Nanobulk materials from ThermoAura were explored extensively throughout this study. ThermoAura had achieved conductivities in the range of 100,000 S/m, creating bulk pellets of nanobulk material and the potential for thin film applications was explored. Based on similar research, a goal of 10,000 S/m was set for electrical conductivity of the material in a thin film form. A variety of testing conditions were attempted to achieve these results, ranging in the annealing temperature ranges of 450 oC to 500 oC from 1 to 2 hours. The samples were tested on Kapton, LTCC, and SiO2
Table 6. Samples of the QPAC pastes with ThermoAura powder annealed between 450 and 500 oC for 1 to 2 hours
Powder loading (%
weight) Binder Substrate Annealing Temp (0C)
Annealing Duration
(hours) Atmosphere
Electrical Conductivity
(S/m)
50 QPAC 20% Kapton 450 1 Argon 110.75
50 QPAC 15% Kapton 450 2 Argon 0
50 QPAC 15% LTCC 450 2 Argon 0
50 QPAC 15% LTCC 500 2 Argon 0
50 QPAC 15% LTCC 450 1.5 Argon 0
50 QPAC 15% LTCC 500 2 Argon 0
50 QPAC 15% SiO2 450 1.5 Argon 0
50 QPAC 15% Kapton 450 1.5 Argon 6
remove the capping agent from the samples, as the majority of the samples turned out black, with a few spots of ash color dispersed around the center of the sample. The ash colored portions were always more conductive than the black portions, and thus the goal of the increased annealing durations was to facilitate this process of capping agent exit. The trials proved to be fruitless, as the black coloring was not removed and conductivity of any kind was not achieved.
The Kapton sample in Table 6 that achieved conductivity was analyzed using SEM, shown in Figure 30. The image displays a large amount of porosity in the sample, with every black area representing where the scan went down to the substrate. The large grey objects are pieces of bismuth telluride, and around every piece there is an apparent black crack on the edge. With this degree of porosity, it is difficult to maintain electrical conductivity between particles.
EDS scans were accompanied by the SEM scans, shown in Figure 31. The scans confirm that the majority of the elements in the annealed print are bismuth, telluride, and selenium, with trace amounts of carbon, oxygen, and sulfur (a doping agent for the powder). The x-axis displays the intensity of electron radiation being aimed at the sample. The y-axis displays the relative intensity of the materials present in the sample. Table 7 gives a quantitative breakdown of the percentage of material in the sample. It should be noted, however, that smaller atomic particles, such as oxygen, are not
calculated accurately by EDS due to their small size. It is shown that 91% of the sample is comprised of Bi, Te, and Se.
Table 7. Atomic percentage of elements in a ThermoAura sample annealed at 450 oC for 1 hr.
Spectrum 3 Atomic %
O 7.51
S 1.31
Se 6.36
Te 48.3
Bi 36.52
Total 100
4.2.2 Cold Pressed Samples
Once the initial trials with the QPAC binder were completed, several changes were implemented to try and increase the electrical conductivity of the samples. The atmosphere of the furnace was switched from argon to vacuum since the binder and powder had never been tested in argon from their respective manufacturers. Vacuum atmospheres had all been used previously, though. Cold pressing was implemented as an option to increase the thermoelectric properties of the ThermoAura pastes by decreasing the porosity of the samples. Samples were printed onto WillowTM glass to test its
Figure 32. Mesh patterns evident in thicker screen printed samples using an 80-mesh screen
The thicker samples were pressed using a hydraulic cold press with 89 MPa of pressure. Cracking of the WillowTM substrates was noticed past that point. The samples were annealed between 250 and 350 oC for 1 hour in a vacuum atmosphere. The Seebeck, electrical conductivity, and power factor measurements are shown in Figure 33. The electrical conductivity used an assumed thickness of 20 microns for the calculations.
Figure 33. Cold pressed ThermoAura samples resulting (a) electrical conductivity, (b) Seebeck coefficient, and (c) power factor
The highest average power factor of .15 μW/m-K2 achieved was at 300 oC, with an accompanying average electrical conductivity of 20.35 S/m (Table A.1). Electrical conductivity increased between 250 and 300 oC but decreased between 300 and 350 oC. Seebeck Coefficient increased linearly between 250 and 350 oC with the highest value of -138 μV/K at 350 oC.
SEM scans were taken of the samples annealed at 250, 300, and 350 oC, shown in Figures 34-36. Another group of samples was annealed at 450 oC, but were highly
Figure 34. SEM image of sample annealed at 250C for 1 hour. Note the “hills” that formed during the printing process
Figure 36. SEM image of sample annealed at 350 oC for 1 hour. Even more cracking is evidenced than the 300 oC sample.
It is clear that as the annealing temperature increased, the occurrence and severity of cracking increased. This can be attributed to the mesh pattern shown in Figure 32; as the annealing temperature increased, the thermal stresses continuously grew and were concentrated in the large column formations that were caused by the mesh pattern. These thermal stresses caused the cracking shown in Figures 34-36. This is not an issue with more dense mesh patterns, such as 325-mesh, because of the smaller spacing between the threads. To avoid this issue, the 325-mesh screen was used throughout the rest of the trials, Kapton became the primary substrate, and cold pressing was put on hold for future tests.
4.2.3 ThermoAura Powders and ESL 400
power factor are displayed in Figure 37. The electrical conductivity was calculated using an assumed thickness of 15 microns, which is the average thickness of prints made with a 325-mesh screen.
Figure 37. Electrical conductivity, Seebeck coefficient and power factor of ThermoAura paste consisting of ESL 400 as the binder and solvent combo
The highest average power factor of 4.01 μW/m-K2 was achieved at 350 oC, 26 times the power factor of the samples made with QPAC and cold pressed. The
To compare between batches of ThermoAura powder, a recent batch (May, 2015) of the N-type powder was sent by ThermoAura for analysis. The powder was used to make a paste consisting of an ESL 400 binder and solvent combo, printed, and then annealed under identical conditions to the previous batch of pastes. The results of the annealed samples are shown in Figure 38.
Figure 38. Electrical conductivity, Seebeck coefficient, and power factor of May 2015 batch of ThermoAura powder with ESL 400 as the binder and solvent combo
from 250 to 350 oC, then decreased until 400 oC. Seebeck was maximized at 350 oC with a value of -76.5 μV/K.
The low electrical conductivity values were the main contributor to the low power factor of the samples. This led to purchasing powders from Sigma Aldrich for the
purpose of comparing samples of pastes made with ThermoAura powders. Batches of paste were made with QPAC and ESL 400.
4.3 Sigma Aldrich Pastes
Bi2Te3 powder was purchase from Sigma Aldrich to compare to the nanobulk
powders from ThermoAura. The powders were formed into pastes using both ESL 400 and a 20% QPAC solution. The 20% QPAC samples were annealed under identical conditions to the ESL 400 paste for comparison efforts. The QPAC samples proved to be too fragile and non-conductive enough for the measurement setup to consider it
Figure 39. Electrical conductivity, Seebeck coefficient and power factor of samples formulated using Sigma Adlrich Bi2Te3 and ESL 400 as the binder and
solvent combo
The highest average power factor of 8.9 μW/m-K2 was achieved at 250 oC, a 225% increase from the ThermoAura samples. A maximum electrical conductivity of 2500 S/m (625% increase) was achieved at 250 oC and decreased until 350 oC. The Seebeck coefficient decreased from 250 oC to 300 oC, but then increased to 350 oC, with a maximum of -100 μV/K at 300 oC (Table A.4).
An outlier sample in the batch annealed at 300 oC achieved an electrical
conductivity of 6775.3 S/m, a Seebeck coefficient of -125 μV/K, and a power factor of 105 μW/m-K2
prior. The same sample was measured the following day and displayed an electrical conductivity of 12.6 S/m. Another sample in the same batch was measured and only displayed an electrical conductivity of 223.6 S/m, roughly half of its original value of 467.5 S/m. Another batch of samples was made with the same powder and ESL 400 and annealed at 300 oC to test the repeatability. The results of the electrical conductivity measurements are shown in Table 8.
Table 8. Results of second batch of Sigma Aldrich powder mixed with ESL 400 and annealed at 300 oC in a vacuum.
Sample Average Electrical Conductivity
(S/m)
A 505.035201
B 243.6264281
C 525.0873614
D 444.8032524
Average 429.6380607
CHAPTER 5: CONCLUSIONS AND FUTURE WORK 5.1 Conclusions
From a printability standpoint, green strength and even thermoelectric property standpoint, ESL 400 is the best binder and solvent combo to use for creating screen printing inks that were explored in this study. The samples that were annealed with ESL 400 displayed much higher thermoelectric properties, particularly with respect to Sigma Aldrich powders, which were un-measurable with QPAC binder formulations.
The QPAC formulations performed best when 20% by weight of the binder was used in the ink vehicle. As the binder percentage began to decrease, the print resolution became gradually poorer. Once below 10% by weight, the prints became noticeably non-uniform, with a wave pattern developing in the surface of the print. At 25% by weight, the paste became too sticky and would adhere to the screen, ruining prints. If QPAC were to be used in the future for making the thermoelectric inks, a 20% by weight formulation should be used when making the ink vehicle. The fragility of the QPAC prints may be because of all of the binder leaving the sample, causing a large degree of porosity and minimal adherence to the substrate. The use of additives such as a plasticizer, a dispersant, changing the solvent, and using a glass sintering aid may improve the conductivity and adhesion of the QPAC binder samples.
pressing these samples, the hypothesis was that the pattern formed in the sample would dissipate. Unfortunately, the pattern forms a series of hills and non-uniformities in the surface after pressing, which in turn causes stress risers through the annealing process. For cold pressing to be more successful, it is suggested that a 325-mesh screen be used, due to it superior print resolution and surface uniformity. If a thicker print is desired, then multiple prints can be piled on top of one another. Delamination is a prime concern when printing another layer onto a substrate. Snap-off distance, squeegee speed, and squeegee pressure must all be optimized in the printing process to prevent pulling off of the original print.
Flexibility was of prime concern throughout this process. WillowTM glass only had a bending radius of 23 mm, which was quickly apparent when multiple samples were shattered due to over bending. Bending tests done on Kapton were much simpler due to the polymer makeup of the substrate. After repeated bending tests, samples made using a QPAC binder began to flake and crack readily, primarily attributed to the absence of the binder after annealing. ESL 400 samples did not show such degradation due to repeated bending tests, although bending cycles were minimal (roughly 10-20 cycles). Further exploration of the samples resistance to bending after a life-cycle testing regime would be of use in future manufacturing preparations. Creep, fatigue, delamination, and
thermoelectric property degradation are all properties that could be explored more in depth.
temperature and duration that will work best is highly dependent on the material
properties of the powder itself. In particular, the 300 to 350 oC range appears to have the highest potential for both the Sigma Aldrich and ThermoAura powders, if the outlier sample in the Sigma Aldrich batch is taken into account. Anything past 350 oC for one hour results in a high degree of material evaporation, which is usually very evident on the sidewalls of the furnace. Argon was explored for early samples, but the affects of argon gas on ThermoAura powder and QPAC 40 binder had never been fully explored by their respective manufacturers.
The Sigma Aldrich powder held a clear advantage over the ThermAura powder with respect to thermoelectric properties. Even after several weeks of oxidation affecting the samples, the Sigma Aldrich samples still had electrical conductivities and power factors that were at least a magnitude higher than their ThermoAura counterpart. The ThermoAura powders also held inconsistencies between batches, with the May, 2015 batch having superior thermoelectric properties under identical production conditions. Although the nanobulk materials have the highest potential by far for optimizing
Figure 40. Comparison between prints made with (a) Sigma Aldrich powder and (b) ThermoAura powder
5.2 Future Work
5.2.1 Electrical Conductivity Optimization
Electrical conductivity is the most difficult thermoelectric property to optimize. Oxidation, porosity, and contamination all affect the conductivity of the film and are difficult to avoid. Working in a glove box with an inert atmosphere will help with the oxidation of films, which will help greatly increase the electrical properties of the materials. A device that can press the materials while annealing would help reduce porosity in the final film and also increase electrical conductivity.
With respect to the annealing process, there are still many things that can be attempted to increase the thermoelectric properties of the films, as this study has really only touched the potential and range of annealing conditions. Annealing at high temperatures between 450 and 500 oC for 0 to 10 minutes is a common way for
![Table 1. Power generation of the human body under different physiological states and activities [44]](https://thumb-us.123doks.com/thumbv2/123dok_us/8921861.1842295/25.612.155.485.263.604/table-power-generation-human-different-physiological-states-activities.webp)
![Figure 7. Schematic of in vitro experiment to test voltage output capabilities of a commercially available TEG using a piece of pork [19]](https://thumb-us.123doks.com/thumbv2/123dok_us/8921861.1842295/27.612.168.483.80.300/figure-schematic-experiment-voltage-output-capabilities-commercially-available.webp)
![Figure 8. Heat exchanger design for micro-TEGs to enhance power output of the device [53]](https://thumb-us.123doks.com/thumbv2/123dok_us/8921861.1842295/29.612.134.507.81.440/figure-heat-exchanger-design-micro-enhance-output-device.webp)
![Figure 15. Time dependent viscosity properties of thixotropic fluids [60]](https://thumb-us.123doks.com/thumbv2/123dok_us/8921861.1842295/35.612.159.491.72.326/figure-time-dependent-viscosity-properties-thixotropic-fluids.webp)
![Figure 20. Thermo gravimetric analysis of QPAC 40, ethyl cellulose (EC) and polyvinyl butryal (AC) in air [62]](https://thumb-us.123doks.com/thumbv2/123dok_us/8921861.1842295/44.612.106.536.66.366/figure-thermo-gravimetric-analysis-qpac-cellulose-polyvinyl-butryal.webp)