R E S E A R C H A R T I C L E
Open Access
Is resistant hypertension an independent
predictor of all-cause mortality in
individuals with type 2 diabetes?
A prospective cohort study
Anna Solini
1, Giuseppe Penno
2, Emanuela Orsi
3, Enzo Bonora
4, Cecilia Fondelli
5, Roberto Trevisan
6,
Monica Vedovato
7, Franco Cavalot
8, Olga Lamacchia
9, Marco G. Baroni
10,13, Antonio Nicolucci
11,
Giuseppe Pugliese
12*and for the Renal Insufficiency And Cardiovascular Events (RIACE) Study Group
Abstract
Background:Resistant hypertension is independently associated with an increased risk of death in the general hypertensive population. We assessed whether resistant hypertension is an independent predictor of all-cause mortality in individuals with type 2 diabetes from the Renal Insufficiency And Cardiovascular Events (RIACE) Italian Multicentre Study.
Methods:On 31 October 2015, vital status information was retrieved for 15,656 of the 15,773 participants enrolled in 2006–2008. Based on baseline blood pressure (BP) values and treatment, participants were categorized as normotensive, untreated hypertensive, controlled hypertensive (i.e., on-target with < 3 drugs), uncontrolled hypertensive (i.e., not on-target with 1–2 drugs), or resistant hypertensive (i.e., uncontrolled with > 3 drugs or controlled with > 4 drugs). Kaplan–Meier and Cox proportional hazards regression analyses were used to assess the association with all-cause mortality.
Results:Using the 130/80 mmHg targets for categorization, crude mortality rates and Kaplan–Meier estimates were highest among resistant hypertension participants, especially those with controlled resistant hypertension. As compared with resistant hypertension, risk for all-cause mortality was significantly lower for all the other groups, including individuals with controlled hypertension (hazard ratio 0.81 [95% confidence interval 0.74–0.89],P< 0.0001), but became progressively similar between resistant and controlled hypertension after adjustment for cardiovascular risk factors and complications/ comorbidities. Also when compared with controlled resistant hypertension, mortality risk was significantly lower for all the other groups, including controlled hypertension, even after adjusting for cardiovascular risk factors (0.77 [0.63–0.95], P= 0.012), but not for complications/comorbidities (0.88 [0.72–1.08],P= 0.216). BP was well below target in the controlled hypertensive groups (resistant and non-resistant) and values < 120/70 mmHg were associated with an increased mortality risk. Results changed only partly when using the 140/90 mmHg targets for categorization.
Conclusions:In the RIACE cohort, at variance with the general hypertensive population, resistant hypertension did not predict death beyond target organ damage. Our findings may be explained by the high mortality risk conferred by type 2 diabetes and the low BP values observed in controlled hypertensive patients, which may mask risk associated with resistant hypertension. Less stringent BP goals may be preferable in high-risk patients with type 2 diabetes.
Trial registration:ClinicalTrials.gov,NCT00715481, retrospectively registered 15 July, 2008.
Keywords:Resistant hypertension, Type 2 diabetes, All-cause mortality, Cardiovascular disease, Chronic kidney disease
© The Author(s). 2019Open AccessThis article is distributed under the terms of the Creative Commons Attribution 4.0 International License (http://creativecommons.org/licenses/by/4.0/), which permits unrestricted use, distribution, and reproduction in any medium, provided you give appropriate credit to the original author(s) and the source, provide a link to the Creative Commons license, and indicate if changes were made. The Creative Commons Public Domain Dedication waiver (http://creativecommons.org/publicdomain/zero/1.0/) applies to the data made available in this article, unless otherwise stated.
* Correspondence:giuseppe.pugliese@uniroma1.it
12Department of Clinical and Molecular Medicine,“La Sapienza”University, Via di Grottarossa, 1035-1039, 00189 Rome, Italy
Background
Type 2 diabetes is associated with excess mortality mainly, though not exclusively attributable to cardiovascular dis-ease (CVD) [1]. The increased risk for CVD morbidity and mortality associated with type 2 diabetes requires a prompt recognition and management of the other comor-bidities clustering with hyperglycemia and contributing to this high-risk profile, as demonstrated by the efficacy of multifactorial intervention in the Steno-2 study [2,3]. In particular, control of hypertension represents a major issue, even though blood pressure (BP) targets are still a matter of debate, with recommended values ranging from < 130 to < 140 mmHg for systolic BP and from < 80 to < 90 mmHg for diastolic BP [4]. Unfortunately, though awareness and control of hypertension have improved in the last decades, a high percentage of diabetic hyperten-sive patients does not reach target BP levels [5,6].
According to the 2008 Scientific Statement from the American Heart Association (AHA) [7], resistant hyper-tension is defined as uncontrolled BP despite the use of≥ 3 anti-hypertensive medication classes or controlled BP while treated with≥4 anti-hypertensive medication clas-ses, with all agents prescribed at optimal dose amounts; ideally, one of these classes should be a diuretic. A recent revision of the AHA Scientific Statement has established that, in addition to a diuretic, the anti-hypertensive regi-men should include also a long-acting calcium channel blocker (CCB) and a blocker of the renin-angiotensin sys-tem (RAS) [8]. Pooled data from North America and Europe indicated that 14.8% of treated hypertensive pa-tients and 12.5% of all hypertensive individuals have resistant hypertension [9]. However, these prevalence estimates refer to “apparent resistant hypertension,” as population-based studies are unable to distinguish cases of“true resistant hypertension”from those of “pseudo-re-sistant hypertension,” i.e., individuals with “white coat” hypertension, non-adherence to medications, inappropri-ately prescribed anti-hypertensive regimen, and incorrect BP measurement due to cuff-related artifacts [10]. It has been estimated that individuals with pseudo-resistant hypertension are as many as those with true resistant hypertension [10], who however should include also pa-tients with BP uncontrolled with < 2 drugs who would fail to achieve BP goal if treated with three drugs [11]. Sub-jects with resistant hypertension are usually older, more frequently obese and diabetic, and those with a higher prevalence of target organ damage, including CVD and chronic kidney disease (CKD), whereas data on gender and ethnicity are contrasting [7,10–23].
A few longitudinal studies demonstrated that resistant hypertension is an independent predictor of all-cause and CVD mortality, CVD morbidity, and end-stage renal disease in the general hypertensive population, though different definitions of resistant and non-resistant
hypertension were used [13–15, 18]. The increased risk remained after adjustment for several confounders, includ-ing CVD risk factors and target organ damage [13–15,18]. In addition, some of these studies reported a worse prog-nosis in uncontrolled resistant hypertension (i.e., BP not on-target with ≥3 drugs) than in controlled resistant hypertension (i.e., BP on-target with≥4 drugs) [13,14,18]. An independent association between resistant sion and adverse outcomes was also reported in hyperten-sive individuals with CVD [19–21] or CKD [22,23].
Although the presence of diabetes has been invariably reported among predictors of adverse outcomes in hypertensive individuals [12–15, 18–22], only one study has reported a subgroup analysis in diabetic patients [18] and, so far, no study has evaluated the risk of death associated with resistant hypertension in a type 2 dia-betes population. We have previously reported that prevalence of resistant hypertension was 17.4% among hypertensive individuals and 21.2% among treated hyper-tensive patients with type 2 diabetes from the Renal In-sufficiency And Cardiovascular Events (RIACE) Italian Multicentre Study [24].
The present analysis aimed at assessing whether resist-ant hypertension at baseline is an independent predictor of subsequent death from any cause in individuals with type 2 diabetes from the RIACE cohort. To this end, in-dividuals without hypertension or with non-resistant hypertension were compared with patients with resistant hypertension as reference group.
Methods
Design
The RIACE Italian Multicentre Study is an observa-tional, prospective, cohort study on the impact of esti-mated glomerular filtration rate (eGFR) on morbidity and mortality in individuals with type 2 diabetes [25].
Study population
The study population included 15,773 Caucasian patients (after excluding 160 individuals with missing or implaus-ible values), consecutively attending 19 hospital-based, tertiary referral Diabetes Clinics of the National Health Service throughout Italy in the years 2006–2008. Exclusion criteria were dialysis or renal transplantation.
The vital status of the participants on 31 October 2015 was verified by interrogating the Italian Health Card database (http://sistemats1.sanita.finanze.it/wps/ portal/), which provides updated and reliable informa-tion on all current Italian residents.
Measurements
age, smoking status, known diabetes duration, comor-bidities, and current treatments.
Body mass index (BMI) was computed from weight and height, whereas waist circumference was calculated from log-transformed BMI values using sex-specific linear re-gression equations derived from waist measurements ob-tained in 4618 individuals. BP was measured with a sphygmomanometer after a 5-min rest. Two consecutive readings were taken 10 min apart by a trained observer with the patients seated with the arm at the heart level and the cuff correctly placed on the arm circumference. Standard adult cuffs were used (9–13 in.), except for severely obese patients, where large cuffs (13–17 in.) were employed. The second readings were used for the analysis [24]. Pulse pres-sure, a surrogate measure of arterial stiffness, was then cal-culated from systolic and diastolic BP values.
Triglycerides and total and HDL cholesterol were mea-sured in fasting blood samples by colorimetric enzymatic method, and LDL cholesterol was calculated by the Friedewald formula. Hemoglobin (Hb) A1c was measured
by high-performance liquid chromatography using DCCT-aligned methods.
Diabetic kidney disease (DKD) was assessed based on albuminuria and eGFR. Albumin excretion rate (AER) was measured from 24-h urine collections or estimated from albumin-to-creatinine ratio in early-morning, first-voided urine samples, using a conversion formula developed in patients with type 1 diabetes [25,26]. Albu-minuria was measured in fresh urine samples by
immu-nonephelometry or immunoturbidimetry. For each
individual, one to three measurements were obtained; in cases of multiple measurements, the geometric mean was used for analysis. In subjects with multiple measure-ments (4062 with at least two and 2310 with three values), concordance rate between the first value and the geometric mean was > 90% for all albuminuria classes [26]. Serum (and urine) creatinine was measured by the modified Jaffe method, traceable to IDMS, and estimated eGFR was calculated by the CKD Epidemiology Collab-oration equation [25]. Patients were then classified into the Kidney Disease: Improving Global Outcomes A1–A3 and G1–G5 categories and further stratified into the following DKD phenotypes, as previously reported [25]:
no DKD (i.e., G1A1–G2A1), albuminuria alone
(albuminuric DKD with preserved eGFR, i.e., G1A2– G2A2–G1A3–G2A3), reduced eGFR alone (nonalbumi-nuric DKD, i.e., G3A1–G4A1–G5A1), or albuminuria and reduced eGFR (albuminuric DKD with reduced eGFR, i.e., G3A2–G4A2–G5A2–G3A3–G4A3–G5A3).
In each center, presence of diabetic retinopathy (DR) was evaluated by an expert ophthalmologist by dilated fundoscopy. Based on the worst eye, individuals with mild or moderate non-proliferative DR were classified as having non-advanced DR, whereas those with severe
non-proliferative DR, proliferative DR, or maculopathy were grouped into the advanced DR category, as previ-ously reported [27].
Previous major acute CVD events (myocardial infarc-tion, stroke, foot ulcer/gangrene/amputainfarc-tion, coronary, carotid, lower limb revascularization, and surgery for aortic aneurysm) were adjudicated based on hospital dis-charge records [28].
Categorization of patients
Patients were stratified according to either the BP targets of < 130/80 mmHg, recommended for diabetic individ-uals at the time BP measures were obtained [29] and re-cently confirmed by the American College of Cardiology and AHA guidelines [30], or to the less stringent BP tar-gets of < 140/90 mmHg, which are currently established by the American Diabetes Association, except for high-risk individuals [31]. The following groups were identified [24]: normotensive (NT); untreated hyperten-sive (UTHT); hypertenhyperten-sive on-target with 1, 2, or 3 drugs (controlled hypertension; CHT); hypertensive not on-target with 1 or 2 drugs (uncontrolled hypertension; UCHT); and hypertensive not on-target with > 3 drugs or on-target with > 4 drugs (resistant hypertension; RHT). The RHT group was further divided into two sub-groups, based on whether patients were on-target with > 4 drugs (controlled resistant hypertension; CRHT) or were not on-target with > 3 drugs (uncontrolled resistant hypertension; UCRHT).
Statistical analysis
Data are expressed as mean ± SD or median (interquar-tile range) for continuous variables, and number of cases and percentage for categorical variables. Comparisons among groups were performed by one-way ANOVA or Kruskal–Wallis test, according to the parametric or non-parametric distribution of continuous variables, followed by Bonferroni correction or Mann–Whitney test, respectively, for post hoc comparisons. The Pear-son’sχ2
test was used for categorical variables.
Crude mortality rates were described as events per 1000 patient years, with 95% exact Poisson confidence intervals (CIs); death rates were also adjusted for age and gender by a Poisson regression model. Kaplan– Meier survival probabilities for all-cause mortality were estimated according to the above categorizations and differences were analyzed using the log-rank statistic. The hazard ratios (HRs) and their 95% CIs were esti-mated by Cox proportional hazards regression, un-adjusted and un-adjusted for baseline age and gender (model 1); age, gender, and CVD risk factors, i.e., smoking status, diabetes duration, HbA1c, BMI, waist
(model 2); and age, gender, CVD risk factors, and com-plications/comorbidities, i.e., DKD phenotypes, DR grade, any CVD, and any cancer (model 3). In separate analyses, models were further adjusted for either BP or pulse pressure values at baseline to assess whether the excess risk associated with RHT was attributable to the higher levels of these parameters detected in RHT versus CHT participants. All the above analyses were repeated by including in the RHT group only patients on a diur-etic or a CCB/RAS blocker/diurdiur-etic combination, ac-cording to the 2008 [7] and 2018 [8] definition of resistant hypertension, respectively. Finally, additional analyses, adjusted for age and gender, were performed to explore the relation between categories of on-treatment BP values and mortality. In all the above analyses, the RHT (or CRHT) group was used as reference to allow comparison with all other groups, i.e., NT and the vari-ous non-RHT groups (and UCRHT), thus distinguishing patients with CHT from those with UTHT or UCHT, who might include RHT individuals.
Results
Overall mortality in the study population
Valid information on vital status was retrieved for 15,656 participants (99.3% of the cohort). At the time of the cen-sus, 12,054 (77.0%) patients were alive, whereas 3602 (23.0%) individuals had died; death rate was 31.0 per 1000 person years (95% CI 30.0, 32.0) over a median follow-up of 8.0 years (interquartile range 7.5–8.5) [32,33].
Clinical features of the study population (based on the 130/80 mmHg BP targets)
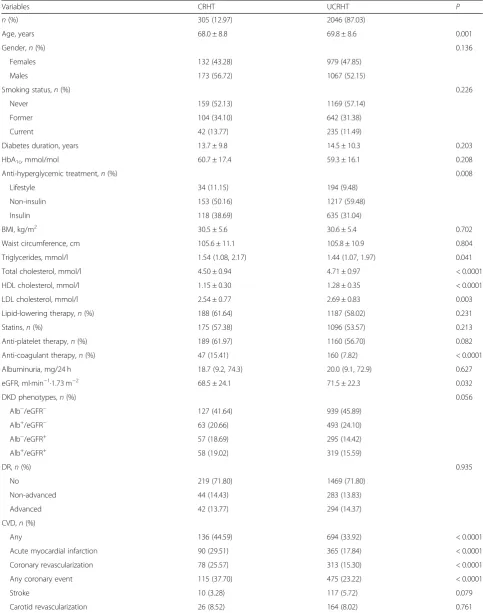
The RIACE participants with RHT were 15.0% of the whole cohort (17.5% of all hypertensive individuals); of them, 13.5% were on-target with > 4 drugs (CRHT) and 86.5% were not on-target with > 3 drugs (UCRHT). As previously reported [24], RHT individuals were older, more often females and former smokers, and more fre-quently on insulin, lipid-lowering, anti-platelet, and anti-coagulant treatment, as compared to patients classi-fied into the other groups. In addition, they had longer diabetes duration (except versus UCHT), lower eGFR, and higher BMI, waist circumference, triglycerides, albu-minuria, and prevalence of DKD, advanced DR, and CVD (any and by vascular bed) (Table1). Among RHT patients, CRHT participants had lower eGFR and HDL cholesterol and higher triglycerides and prevalence of CVD, driven by coronary events, and were more often on insulin and anti-coagulant therapy than UCRHT indi-viduals, who were older and had higher total and LDL cholesterol (Additional file1: Table S1).
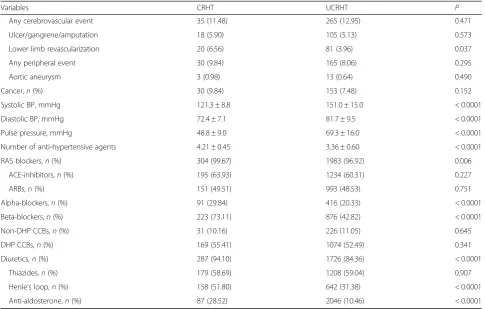
By definition, BP levels were higher in UTHT, UCHT, RHT, and UCRHT than in NT, CHT, and CRHT partici-pants (Tables2 and 3). Interestingly, values in CHT and
CRHT individuals were well below 130/80 mmHg. Use of antihypertensive agents was significantly higher in RHT versus the other treated hypertensive groups for any class as well as in CRHT versus UCRHT individuals for RAS,
α-, and β-blockers and diuretics (Henle’s loop and anti-aldosterone). Of note, pulse pressure was higher in UCHT, RHT, and, to a lesser extent, UTHT individuals versus the other groups and, within the RHT group, in UCRHT versus CRHT participants, as for BP values.
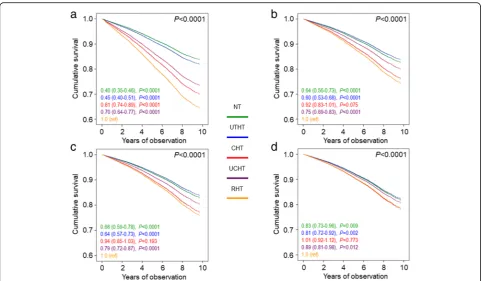
Association between resistant hypertension and mortality (based on the 130/80 mmHg BP targets)
Crude mortality rates and Kaplan–Meier estimates were highest for RHT, intermediate for CHT and UCHT, and
lowest for NT and UTHT participants (Table 4 and
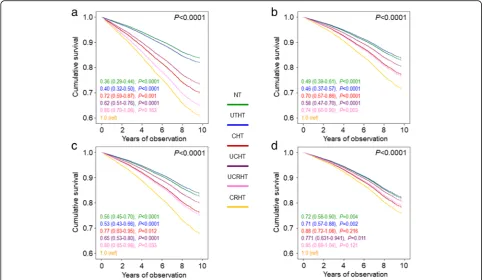
Additional file 2: Figure S1A). Differences in mortality rates (Table 4) were reduced after adjustment for age and gender. When compared to RHT, CHT was associated with a significantly lower risk of death only in the unadjusted analysis (HR 0.81 [95% CI 0.81–0.89], P< 0.0001) (Fig.1a), whereas no difference was observed after adjustment for age and gender (model 1; Fig.1b) and further adjustment for CVD risk factors (model 2; Fig.1c) and complications/comorbidities (model 3; Fig.1d). Inter-estingly, crude mortality rates (Table4) and Kaplan–Meier
estimates (not shown) were highest for CRHT. Differences in mortality rates were attenuated after adjustment for age and gender (Table 4). As compared with CRHT individ-uals, unadjusted HRs (Fig.2a) were significantly lower in all other groups (except UCRHT), including CHT partici-pants (0.72 [0.59–0.87], P= 0.001). Differences between RHT and CHT were maintained after adjustment for age and gender (0.70 [0.57–0.86], P< 0.0001) (Fig. 2b), were attenuated when adjusting also for CVD risk factors (0.77 [0.63–0.95], P= 0.012) (Fig. 2c), and disappeared when accounting for complications/comorbidities (0.88 [0.72– 1.08],P= 0.216) (Fig.2d). No change was observed when further adjusting for BP or pulse pressure values or when only RHT individuals on a diuretic or a CCB/RAS blocker/diuretic combination were included in the analysis (not shown).
Clinical features of the study population (based on the 140/90 mmHg BP targets)
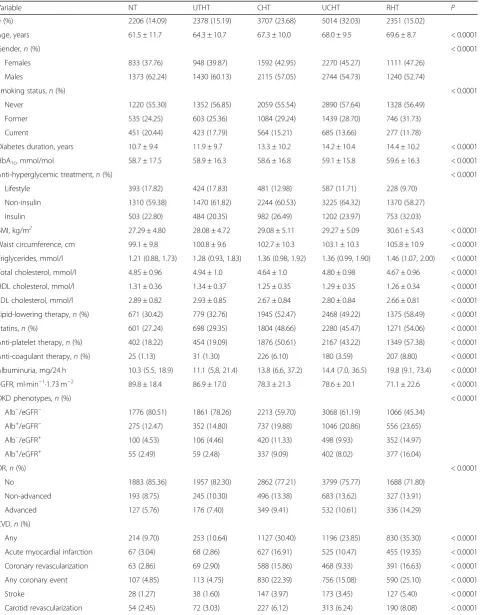
Table 1Baseline clinical features in the RIACE participants with valid information on vital status, stratified by BP status according to the 130/80 mmHg BP targets
Variable NT UTHT CHT UCHT RHT P
n(%) 2206 (14.09) 2378 (15.19) 3707 (23.68) 5014 (32.03) 2351 (15.02)
Age, years 61.5 ± 11.7 64.3 ± 10.7 67.3 ± 10.0 68.0 ± 9.5 69.6 ± 8.7 < 0.0001
Gender,n(%) < 0.0001
Females 833 (37.76) 948 (39.87) 1592 (42.95) 2270 (45.27) 1111 (47.26)
Males 1373 (62.24) 1430 (60.13) 2115 (57.05) 2744 (54.73) 1240 (52.74)
Smoking status,n(%) < 0.0001
Never 1220 (55.30) 1352 (56.85) 2059 (55.54) 2890 (57.64) 1328 (56.49)
Former 535 (24.25) 603 (25.36) 1084 (29.24) 1439 (28.70) 746 (31.73)
Current 451 (20.44) 423 (17.79) 564 (15.21) 685 (13.66) 277 (11.78)
Diabetes duration, years 10.7 ± 9.4 11.9 ± 9.7 13.3 ± 10.2 14.2 ± 10.4 14.4 ± 10.2 < 0.0001
HbA1c, mmol/mol 58.7 ± 17.5 58.9 ± 16.3 58.6 ± 16.8 59.1 ± 15.8 59.6 ± 16.3 < 0.0001
Anti-hyperglycemic treatment,n(%) < 0.0001
Lifestyle 393 (17.82) 424 (17.83) 481 (12.98) 587 (11.71) 228 (9.70)
Non-insulin 1310 (59.38) 1470 (61.82) 2244 (60.53) 3225 (64.32) 1370 (58.27)
Insulin 503 (22.80) 484 (20.35) 982 (26.49) 1202 (23.97) 753 (32.03)
BMI, kg/m2 27.29 ± 4.80 28.08 ± 4.72 29.08 ± 5.11 29.27 ± 5.09 30.61 ± 5.43 < 0.0001
Waist circumference, cm 99.1 ± 9.8 100.8 ± 9.6 102.7 ± 10.3 103.1 ± 10.3 105.8 ± 10.9 < 0.0001
Triglycerides, mmol/l 1.21 (0.88, 1.73) 1.28 (0.93, 1.83) 1.36 (0.98, 1.92) 1.36 (0.99, 1.90) 1.46 (1.07, 2.00) < 0.0001
Total cholesterol, mmol/l 4.85 ± 0.96 4.94 ± 1.0 4.64 ± 1.0 4.80 ± 0.98 4.67 ± 0.96 < 0.0001
HDL cholesterol, mmol/l 1.31 ± 0.36 1.34 ± 0.37 1.25 ± 0.35 1.29 ± 0.35 1.26 ± 0.34 < 0.0001
LDL cholesterol, mmol/l 2.89 ± 0.82 2.93 ± 0.85 2.67 ± 0.84 2.80 ± 0.84 2.66 ± 0.81 < 0.0001
Lipid-lowering therapy,n(%) 671 (30.42) 779 (32.76) 1945 (52.47) 2468 (49.22) 1375 (58.49) < 0.0001
Statins,n(%) 601 (27.24) 698 (29.35) 1804 (48.66) 2280 (45.47) 1271 (54.06) < 0.0001
Anti-platelet therapy,n(%) 402 (18.22) 454 (19.09) 1876 (50.61) 2167 (43.22) 1349 (57.38) < 0.0001
Anti-coagulant therapy,n(%) 25 (1.13) 31 (1.30) 226 (6.10) 180 (3.59) 207 (8.80) < 0.0001
Albuminuria, mg/24 h 10.3 (5.5, 18.9) 11.1 (5,8, 21.4) 13.8 (6.6, 37.2) 14.4 (7.0, 36.5) 19.8 (9.1, 73.4) < 0.0001
eGFR, ml·min−1·1.73 m−2 89.8 ± 18.4 86.9 ± 17.0 78.3 ± 21.3 78.6 ± 20.1 71.1 ± 22.6 < 0.0001
DKD phenotypes,n(%) < 0.0001
Alb−/eGFR− 1776 (80.51) 1861 (78.26) 2213 (59.70) 3068 (61.19) 1066 (45.34)
Alb+/eGFR− 275 (12.47) 352 (14.80) 737 (19.88) 1046 (20.86) 556 (23.65)
Alb−/eGFR+ 100 (4.53) 106 (4.46) 420 (11.33) 498 (9.93) 352 (14.97)
Alb+/eGFR+ 55 (2.49) 59 (2.48) 337 (9.09) 402 (8.02) 377 (16.04)
DR,n(%) < 0.0001
No 1883 (85.36) 1957 (82.30) 2862 (77.21) 3799 (75.77) 1688 (71.80)
Non-advanced 193 (8.75) 245 (10.30) 496 (13.38) 683 (13.62) 327 (13.91)
Advanced 127 (5.76) 176 (7.40) 349 (9.41) 532 (10.61) 336 (14.29)
CVD,n(%)
Any 214 (9.70) 253 (10.64) 1127 (30.40) 1196 (23.85) 830 (35.30) < 0.0001
Acute myocardial infarction 67 (3.04) 68 (2.86) 627 (16.91) 525 (10.47) 455 (19.35) < 0.0001
Coronary revascularization 63 (2.86) 69 (2.90) 588 (15.86) 468 (9.33) 391 (16.63) < 0.0001
Any coronary event 107 (4.85) 113 (4.75) 830 (22.39) 756 (15.08) 590 (25.10) < 0.0001
Stroke 28 (1.27) 38 (1.60) 147 (3.97) 173 (3.45) 127 (5.40) < 0.0001
with values between 130 and 139 and/or 80–89 mmHg, formerly assigned to the UCHT and UCRHT categories, respectively, were included in these groups.
Association between resistant hypertension and mortality (based on the 140/90 mmHg BP targets)
Crude and age- and gender-adjusted mortality rates, Kaplan–Meier estimates, and HRs were similar to those observed when participants were stratified according to the more stringent BP targets (Table 4, Additional file2: Figure S1B and Additional file4: Figure S2), except that (a) CHT was associated with a significantly lower risk of death than RHT both in the unadjusted (0.78 [0.71–
0.86], P< 0.0001) and the adjusted (model 1: 0.86 [0.78–0.94], P= 0.001, and model 2: 0.90 [0.81–0.98], P= 0.022, but not model 3: 0.99 [0.90–1. 08],P= 0.755) analysis; and (b) the HRs for the CRHT and UCRHT subgroups did not diverge appreciably (Additional file5: Figure S3).
Association between on-treatment BP values and mortality
There was a U-shape association between on-treatment BP values and all-cause mortality. In particular, using the 130–139 mmHg category of systolic BP and the 80–89 mmHg category of diastolic BP as reference, risk
Table 1Baseline clinical features in the RIACE participants with valid information on vital status, stratified by BP status according to the 130/80 mmHg BP targets(Continued)
Variable NT UTHT CHT UCHT RHT P
Any cerebrovascular event 79 (3.58) 109 (4.58) 346 (9.33) 458 (9.13) 300 (12.76) < 0.0001
Ulcer/gangrene/amputation 50 (2.67) 54 (2.27) 154 (4.15) 175 (3.49) 123 (5.23) < 0.0001
Lower limb revascularization 23 (1.04) 26 (1.09) 145 (3.91) 155 (3.09) 101 (4.30) < 0.0001
Any peripheral event 67 (3.04) 75 (3.15) 258 (6.96) 288 (5.74) 195 (8.29) < 0.0001
Aortic aneurysm 6 (0.27) 5 (0.21) 15 (0.40) 16 (0.32) 16 (0.68) 0.065
Cancer,n(%) 118 (5.35) 127 (5.34) 277 (7.47) 326 (6.50) 183 (7.78) < 0.0001
Values are mean ± SD or median (interquartile range) for continuous variables, and number of cases (percentage) for categorical variables.RIACERenal Insufficiency And Cardiovascular Events,BPblood pressure,NTnormotension,UTHTuntreated hypertension,CHTcontrolled hypertension (on-target with 1, 2, or 3 drugs),UCHT uncontrolled hypertension (not on-target with 1 or 2 drugs),RHTresistant hypertension (on-target with > 4 drugs or not on-target with > 3 drugs),HbA1chemoglobin
A1c,BMIbody mass index,eGFRestimated glomerular filtration rate,DKDdiabetic kidney disease,Alb−/eGFR−no DKD,Alb+/eGFR−albuminuric DKD with preserved eGFR, Alb−/eGFR+nonalbuminuric DKD,Alb+/eGFR+albuminuric DKD with reduced eGFR,DRdiabetic retinopathy,CVDcardiovascular disease
Table 2BP values and anti-hypertensive treatment in the RIACE participants with valid information on vital status, stratified by BP status according to the 130/80 mmHg BP targets
Variable NT UTHT CHT UCHT RHT P
n, (%) 2206 (14.09) 2378 (15.19) 3707 (23.68) 5014 (32.03) 2351 (15.02)
Systolic BP, mmHg 121.2 ± 8.4 145.6 ± 12.7 122.1 ± 8.4 149.4 ± 14.2 147.2 ± 17.5 < 0.0001
Diastolic BP, mmHg 73.7 ± 6.7 82.4 ± 8.4 73.1 ± 7.3 82.6 ± 9.2 80.5 ± 9.7 < 0.0001
Pulse pressure, mmHg 47.5 ± 8.5 63.2 ± 14.4 49.0 ± 8.8 66.8 ± 14.9 66.7 ± 16.7 < 0.0001
Number of anti-hypertensive agents 0 ± 0 0 ± 0 1.80 ± 0.77 1.48 ± 0.50 3.47 ± 0.65 < 0.0001
RAS blockers,n(%) 0 (0) 0 (0) 3064 (82.65) 3989 (79.56) 2287 (97.28) < 0.0001
ACE-inhibitors,n(%) 0 (0) 0 (0) 2000 (53.95) 2651 (52.87) 1429 (60.78) < 0.0001
ARBs,n(%) 0 (0) 0 (0) 1085 (29.27) 1346 (26.84) 1144 (48.66) < 0.0001
Alpha-blockers,n(%) 0 (0) 0 (0) 200 (5.40) 240 (4.79) 507 (21.57) < 0.0001
Beta-blockers,n(%) 0 (0) 0 (0) 871 (23.50) 749 (14.94) 1099 (46.75) < 0.0001
Non-DHP CCBs,n(%) 0 (0) 0 (0) 247 (6.66) 285 (5.68) 257 (10.93) < 0.0001
DHP CCBs,n(%) 0 (0) 0 (0) 707 (19.07) 870 (17.35) 1243 (52.87) < 0.0001
Diuretics,n(%) 0 (0) 0 (0) 1410 (38.04) 1239 (23.71) 2013 (85.62) < 0.0001
Thiazides,n(%) 0 (0) 0 (0) 826 (22.28) 795 (15.86) 1387 (59.00) < 0.0001
Henle’s loop,n(%) 0 (0) 0 (0) 552 (14.89) 379 (7.56) 800 (34.03) < 0.0001
Anti-aldosterone,n(%) 0 (0) 0 (0) 172 (4.64) 100 (1.99) 301 (12.8) < 0.0001
Table 3Baseline clinical features in the RIACE participants with valid information on vital status and resistant hypertension on-target with > 4 drugs or not on-target with > 3 drugs according to the 130/80 mmHg BP targets
Variables CRHT UCRHT P
n(%) 305 (12.97) 2046 (87.03)
Age, years 68.0 ± 8.8 69.8 ± 8.6 0.001
Gender,n(%) 0.136
Females 132 (43.28) 979 (47.85)
Males 173 (56.72) 1067 (52.15)
Smoking status,n(%) 0.226
Never 159 (52.13) 1169 (57.14)
Former 104 (34.10) 642 (31.38)
Current 42 (13.77) 235 (11.49)
Diabetes duration, years 13.7 ± 9.8 14.5 ± 10.3 0.203
HbA1c, mmol/mol 60.7 ± 17.4 59.3 ± 16.1 0.208
Anti-hyperglycemic treatment,n(%) 0.008
Lifestyle 34 (11.15) 194 (9.48)
Non-insulin 153 (50.16) 1217 (59.48)
Insulin 118 (38.69) 635 (31.04)
BMI, kg/m2 30.5 ± 5.6 30.6 ± 5.4 0.702
Waist circumference, cm 105.6 ± 11.1 105.8 ± 10.9 0.804
Triglycerides, mmol/l 1.54 (1.08, 2.17) 1.44 (1.07, 1.97) 0.041
Total cholesterol, mmol/l 4.50 ± 0.94 4.71 ± 0.97 < 0.0001
HDL cholesterol, mmol/l 1.15 ± 0.30 1.28 ± 0.35 < 0.0001
LDL cholesterol, mmol/l 2.54 ± 0.77 2.69 ± 0.83 0.003
Lipid-lowering therapy,n(%) 188 (61.64) 1187 (58.02) 0.231
Statins,n(%) 175 (57.38) 1096 (53.57) 0.213
Anti-platelet therapy,n(%) 189 (61.97) 1160 (56.70) 0.082
Anti-coagulant therapy,n(%) 47 (15.41) 160 (7.82) < 0.0001
Albuminuria, mg/24 h 18.7 (9.2, 74.3) 20.0 (9.1, 72.9) 0.627
eGFR, ml·min−1·1.73 m−2 68.5 ± 24.1 71.5 ± 22.3 0.032
DKD phenotypes,n(%) 0.056
Alb−/eGFR− 127 (41.64) 939 (45.89)
Alb+/eGFR− 63 (20.66) 493 (24.10)
Alb−/eGFR+ 57 (18.69) 295 (14.42)
Alb+/eGFR+ 58 (19.02) 319 (15.59)
DR,n(%) 0.935
No 219 (71.80) 1469 (71.80)
Non-advanced 44 (14.43) 283 (13.83)
Advanced 42 (13.77) 294 (14.37)
CVD,n(%)
Any 136 (44.59) 694 (33.92) < 0.0001
Acute myocardial infarction 90 (29.51) 365 (17.84) < 0.0001
Coronary revascularization 78 (25.57) 313 (15.30) < 0.0001
Any coronary event 115 (37.70) 475 (23.22) < 0.0001
Stroke 10 (3.28) 117 (5.72) 0.079
of death increased for systolic BP < 120 mmHg and dia-stolic BP < 70 mmHg, but not for values above 140 and 90 mmHg, respectively, consistent with the previously reported inverse association of mortality with systolic and diastolic BP in this cohort (Fig.3) [32].
Discussion
This analysis of the RIACE cohort of patients with type 2 diabetes shows that resistant hypertension was associ-ated with an increased risk of all-cause mortality, which however was progressively attenuated after adjustment for confounders. In particular, using the 130/80 mmHg targets, an increased risk of death in individuals with re-sistant versus controlled hypertension was observed only in the unadjusted analysis, whereas, using the 140/90 mmHg targets, it was maintained also in the adjusted analysis, except when accounting for complications/co-morbidities. These observations indicate that CVD risk profile and particularly complications (indicating target organ damage) and comorbidities, which are significantly worse in individuals with resistant hypertension, drive the increased risk of death associated with this condition
compared to controlled hypertension. However, our finding that, in type 2 diabetes, resistant hypertension does not predict death beyond target organ damage is at odds with data from the general hypertensive population [12–15, 18–21] and hypertensive individuals with CVD [19, 20] or CKD [22, 23]. Indeed, in these studies, diabetes was found to be an independent correlate of ad-verse outcomes, suggesting that it poses a significantly greater risk of death masking that associated with resistant hypertension. This interpretation is consistent with a sub-group analysis of the Antihypertensive and Lipid-Lowering Treatment to Prevent Heart Attack Trial (ALLHAT) co-hort, showing a significant association of resistant hyper-tension with all-cause mortality in non-diabetic, but not in diabetic individuals [18].
Another intriguing observation coming from our data is that, among resistant hypertensive patients, those on-target with > 4 drugs showed a higher mortality risk than individuals not on-target with > 3 drugs. Again, this finding is at variance with data from the general hyper-tensive population [13, 14] and also with a retrospective analysis of a group of US Veterans with resistant
Table 3Baseline clinical features in the RIACE participants with valid information on vital status and resistant hypertension on-target with > 4 drugs or not on-target with > 3 drugs according to the 130/80 mmHg BP targets(Continued)
Variables CRHT UCRHT P
Any cerebrovascular event 35 (11.48) 265 (12.95) 0.471
Ulcer/gangrene/amputation 18 (5.90) 105 (5.13) 0.573
Lower limb revascularization 20 (6.56) 81 (3.96) 0.037
Any peripheral event 30 (9.84) 165 (8.06) 0.295
Aortic aneurysm 3 (0.98) 13 (0.64) 0.490
Cancer,n(%) 30 (9.84) 153 (7.48) 0.152
Systolic BP, mmHg 121.3 ± 8.8 151.0 ± 15.0 < 0.0001
Diastolic BP, mmHg 72.4 ± 7.1 81.7 ± 9.5 < 0.0001
Pulse pressure, mmHg 48.8 ± 9.0 69.3 ± 16.0 < 0.0001
Number of anti-hypertensive agents 4.21 ± 0.45 3.36 ± 0.60 < 0.0001
RAS blockers,n(%) 304 (99.67) 1983 (96.92) 0.006
ACE-inhibitors,n(%) 195 (63.93) 1234 (60.31) 0.227
ARBs,n(%) 151 (49.51) 993 (48.53) 0.751
Alpha-blockers,n(%) 91 (29.84) 416 (20.33) < 0.0001
Beta-blockers,n(%) 223 (73.11) 876 (42.82) < 0.0001
Non-DHP CCBs,n(%) 31 (10.16) 226 (11.05) 0.645
DHP CCBs,n(%) 169 (55.41) 1074 (52.49) 0.341
Diuretics,n(%) 287 (94.10) 1726 (84.36) < 0.0001
Thiazides,n(%) 179 (58.69) 1208 (59.04) 0.907
Henle’s loop,n(%) 158 (51.80) 642 (31.38) < 0.0001
Anti-aldosterone,n(%) 87 (28.52) 2046 (10.46) < 0.0001
Values are mean ± SD or median (interquartile range) for continuous variables, and number of cases (percentage) for categorical variables.RIACERenal Insufficiency And Cardiovascular Events,CRHTcontrolled resistant hypertension (on-target with > 4 drugs),UCRHTuncontrolled resistant hypertension (not on-target with > 3 drugs), HbA1chemoglobin A1c,BMIbody mass index,eGFRestimated glomerular filtration rate,DKDdiabetic kidney disease,Alb−/eGFR−no DKD,Alb+/eGFR−albuminuric DKD
with preserved eGFR,Alb−/eGFR+nonalbuminuric DKD,Alb+/eGFR+albuminuric DKD with reduced eGFR,DRdiabetic retinopathy,CVDcardiovascular disease,BPblood
hypertension, showing that controlling BP values re-sulted in lower mortality compared with individuals who remained uncontrolled over a 6-year follow-up [34]. However, in these studies, the BP values in participants with controlled resistant hypertension were higher than in our cohort, at least when the RIACE participants were categorized using the 130/80 mmHg targets, i.e., when differences in mortality between the two resistant hyper-tensive subgroups were actually observed. This suggests that our unexpected finding may be explained, at least partly, by the quite low BP levels observed in controlled resistant hypertensive individuals. Indeed, also patients with non-resistant controlled hypertension showed BP values well below target when using the 130/80 mmHg goals for categorization, thus suggesting that low BP levels might also contribute to explain the observation that risk of death in these individuals was not signifi-cantly lower than in patients with resistant hypertension in the adjusted analyses. This interpretation is supported by the higher mortality risk associated with lower BP values regardless of group assignment, which is consist-ent with the J-curve phenomenon occurring in high-risk patients, such as those with established CVD, CKD, and/ or diabetes. In these individuals, an impaired blood flow auto-regulation would elevate the BP threshold below which organ perfusion is reduced [35]. This J-curve ef-fect has been described in several post hoc analyses of
intervention trials in which however reverse causality could not be excluded and was indeed suggested by the evidence of a similar phenomenon in the placebo-treated groups that calls into question its clinical relevance [35]. Data from the Taipei City Geriatric Health Examination Database [36], the CLARIFY registry [37], and a cohort of US Veterans [38] showed that low BP values are indeed associated with increased mortality in community-dwell-ing older adults and in individuals with CVD and CKD. A previous study on hypertensive individuals with manifest vascular disease reported a somewhat higher increase in all-cause and CVD mortality risk versus controlled hyper-tension in subjects with controlled resistant hyperhyper-tension than in those with uncontrolled resistant hypertension [21] and another survey in hypertensive patients with atherothrombosis showed that those poorly controlled on ≥3 agents had an increased risk of stroke and
congestive heart failure, whereas those on ≥4
anti-hypertensive agents (irrespective of BP control) had an increased risk of all adverse outcomes, includ-ing all-cause mortality, except stroke [39]. Though not originally designed to address this issue, our study provides further support to the existence of a clinic-ally meaningful J-curve effect, which may have
in-creased mortality risk among individuals with
controlled hypertension, thus masking the excess risk associated with resistant hypertension.
Table 4Mortality rates in the RIACE participants with valid information on vital status, stratified by BP status according to the 130/80 mmHg or 140/90 mmHg BP targets
N Events Percent events Events per 1000 patient-years (95% CI) unadjusted
P Events per 1000 patient-years (95% CI) age- and gender-adjusted
P
Study groups
130/80 mmHg BP targets < 0.0001 < 0.0001
NT 2206 316 14.32 18.36 (16.33–20.38) 10.15 (8.64–11.92)
UTHT 2378 380 15.98 20.65 (18.57–22.73) 9.52 (8.17–11.10)
CHT 3707 980 26.44 36.67 (34.37–38.96) 14.39 (12.61–16.41)
UCHT 5014 1180 23.53 31.76 (29.94–33.57) 11.93 (10.50–13.55)
RHT 2351 746 31.73 44.94 (41.72–48.17) 15.68 (13.70–17.94)
CRHT 305 107 35.08 50.93 (41.28–60.58) 20.36 (16.34–25.38)
UCRHT 2046 639 31.23 44.08 (40.66–47.49) 15.07 (13.13–17.30)
140/90 mmHg BP targets < 0.0001 < 0.0001
NT 3445 492 14.28 18.31 (16.69–19.93) 9.72 (8.39–11.26)
UTHT 1139 204 17.91 23.31 (20.11–26.51) 9.86 (8.24–11.80)
CHT 6298 1619 25.71 35.44 (33.72–37.17) 13.61 (12.01–15.43)
UCHT 2952 707 23.95 32.26 (29.88–34.64) 11.82 (10.32–13.53)
RHT 1882 580 31.83 43.56 (40.01–47.10) 15.82 (13.76–18.18)
CRHT 559 173 30.95 43.93 (37.38–50.47) 17.15 (14.23–20.67)
UCRHT 1263 407 32.22 45.46 (41.04–49.88) 15.31 (13.18–17.77)
A major strength of this study is that it is the first ana-lyzing a type 2 diabetes population. Other strengths in-clude the large sample size, the long-term follow-up, the low number of participants lost to follow-up, and the sep-aration of individuals with untreated or uncontrolled hypertension from those with controlled hypertension among participants without resistant hypertension. In fact, patients with untreated or uncontrolled hypertension were likely those with a recent diagnosis of hypertension or not adequately treated, respectively. Presumably, they have subsequently received a treatment or a more aggressive one, thus experiencing a reduction of BP levels, though some of them may have fallen into the resistant hyperten-sive category. This would explain the relatively low mor-tality rate in the untreated and, to a lesser extent, uncontrolled hypertensive individuals, despite BP levels being similar to those of patients with resistant hyperten-sion, and also the finding that mortality risk did not in-crease significantly with higher BP levels.
Among the limitations, lack of availability of multiple BP measurements over time may have resulted in a misclassifi-cation bias, as also some of the normotensive, controlled hypertensive, and resistant hypertensive participants may have switched to another BP status category during the
follow-up. Moreover, we acknowledge that true
according to the 130/80 and 140/90 mmHg BP targets, respectively), despite evidence that spironolactone is ef-fective in reducing BP in resistant hypertensive individ-uals [42], including those with diabetes [43]. Our finding that use of anti-aldosterone agents was signifi-cantly more frequent in controlled than uncontrolled individuals with resistant hypertension militates in
favor of this interpretation. A further limitation is that our main finding that resistant hypertension is not an independent predictor of death beyond target organ damage cannot be generalized until validated in at least one independent type 2 diabetes population. Finally, the observational design of the study makes causal in-terpretation impossible.
Fig. 2Cox proportional hazards regression, unadjusted (a) and adjusted for age and gender (b) plus CVD risk factors (c) plus complications/ comorbidities (d), according to BP status (based on the 130/80 mmHg BP targets). HRs (95% CI) for mortality are shown for each group. BP = blood pressure; HR = hazard ratio; CI = confidence interval; NT = normotension (green); UTHT = untreated hypertension (blue); CHT = controlled hypertension (on-target with 1, 2, or 3 drugs, red); UCHT = uncontrolled hypertension (not on-target with 1 or 2 drugs, purple); UCRHT = uncontrolled resistant hypertension (not on-target with > 3 drugs, pink); CRHT = controlled resistant hypertension (on-target with > 4 drugs, orange, reference)
Conclusions
In individuals with type 2 diabetes from the RIACE co-hort, resistant hypertension did not predict death beyond the increased burden of target organ damage characteriz-ing this condition. In addition, risk of death was higher in individuals with controlled resistant hypertension than in those with uncontrolled resistant hypertension.
Both these findings are at variance with data from the general hypertensive population and require confirmation in other cohorts of patients with type 2 diabetes. They may be related to the high mortality risk conferred by type 2 diabetes as well as to the detrimental effect of the low BP values detected in individuals with controlled hyper-tension (resistant and non-resistant), which may have masked the increased risk associated with resistant hypertension per se. The demonstration of a J-curve phenomenon in our cohort further supports the concept that less stringent BP goals may be preferable in individ-uals with type 2 diabetes, especially in those at high CVD and renal risk, though this issue is still a matter of debate.
Additional files
Additional file 1:Table S1.Baseline clinical features in the RIACE participants with valid information on vital status, stratified by BP status according to the 140/90 mmHg BP targets. (DOCX 17 kb)
Additional file 2:Figure S1.Cumulative survival by Kaplan Meier analysis according to BP status, based on the 130/80 mmHg (A) and 140/90 mmHg (B) BP targets. Numbers (percentages) of death are shown for each group. NT = normotension; UTHT = untreated hypertension; CHT = controlled hypertension; UCHT = uncontrolled hypertension; RHT = resistant hypertension. (DOC 824 kb)
Additional file 3:Table S2.Baseline clinical features in the RIACE participants with valid information on vital status and resistant hypertension on-target with > 4 drugs or not on-target with > 3 drugs according to the 140/90 mmHg BP targets. (DOCX 16 kb)
Additional file 4:Figure S2.Cox proportional hazards regression, unadjusted (A) and adjusted for age and gender (B) plus CVD risk factors (C) plus complications/comorbidities (D), according to BP status (based on the 140/90 mmHg BP targets). HRs (95% CI) for mortality are shown for each group. NT = normotension; UTHT = untreated hypertension; CHT = controlled hypertension; UCHT = uncontrolled hypertension; RHT = resistant hypertension. (DOC 809 kb)
Additional file 5:Figure S3.Cox proportional hazards regression, unadjusted (A) and adjusted for age and gender (B) plus CVD risk factors (C) plus complications/comorbidities (D), according to BP status (based on the 140/90 mmHg BP targets). HRs (95% CI) for mortality are shown for each group. NT = normotension; UTHT = untreated hypertension; CHT = controlled hypertension; UCHT = uncontrolled hypertension; CRHT = controlled resistant hypertension; UCRHT = uncontrolled resistant hypertension. (DOC 1012 kb)
Abbreviations
AER:Albumin excretion rate; AHA: American Heart Association;
ALLHAT: Antihypertensive and Lipid-Lowering Treatment to Prevent Heart At-tack Trial; BMI: Body mass index; BP: Blood pressure; CCB: Calcium channel blocker; CHT: Controlled hypertension; CIs: Confidence intervals; CKD: Chronic kidney disease; CRHT: Controlled resistant hypertension; CVD: Cardiovascular disease; DKD: Diabetic kidney disease; DR: Diabetic retinopathy;
eGFR: Estimated glomerular filtration rate; HbA1c: Hemoglobin A1c;
HRs: Hazard ratios; NT: Normotensive; RAS: Renin-angiotensin system; RHT: Resistant hypertension; RIACE: Renal Insufficiency And Cardiovascular
Events; UCHT: Uncontrolled hypertension; UCRHT: Uncontrolled resistant hypertension; UTHT: Untreated hypertensive
Acknowledgements
The Authors thank the patients and the RIACE Investigators for participating in this study.
The RIACE Study Group Steering Committee
Giuseppe Pugliese (Coordinator), Giuseppe Penno (Secretary), Anna Solini, Enzo Bonora, Emanuela Orsi, Roberto Trevisan, Luigi Laviola, Antonio Nicolucci.
Participating Diabetes Centres
1. Azienda Ospedaliera Sant'Andrea, Roma (Coordinating Center): Giuseppe Pugliese, Lucilla Bollanti, Elena Alessi, Martina Vitale, and Tiziana Cirrito. 2. Ospedale Le Molinette, Torino: Paolo Cavallo-Perin, Gabriella Gruden, and
Bartolomeo Lorenzati.
3. Ospedale San Luigi Gonzaga, Orbassano: Franco Cavalot, Mariella Trovati, Leonardo Di Martino, and Fabio Mazzaglia.
4. Ospedale San Raffaele, Milano: Giampaolo Zerbini, Valentina Martina, Silvia Maestroni, and Valentina Capuano.
5. IRCCS“Cà Granda–Ospedale Maggiore Policlinico”, Milano: Emanuela Orsi, Eva Palmieri, Elena Lunati, Valeria Grancini, and Veronica Resi.
6. Ospedale San Paolo, Milano: Antonio Pontiroli, Annamaria Veronelli, and Barbara Zecchini.
7. Ospedale San Giuseppe, Milano: Maura Arosio, Laura Montefusco, Antonio Rossi, and Guido Adda.
8. ASST - Ospedale Papa Giovanni XXIII, Bergamo: Roberto Trevisan, Anna Corsi, and Mascia Albizzi.
9. Ospedale Maggiore, Verona: Enzo Bonora, and Giacomo Zoppini. 10. Policlinico Universitario, Padova: Angelo Avogaro, and Monica Vedovato. 11. Ospedale Cisanello, Azienda Ospedaliero-Universitaria Pisana, Pisa:
Giuseppe Penno, Laura Pucci, Daniela Lucchesi, Eleonora Russo, and Monia Garofolo.
12. Ospedale Santa Chiara, Azienda Ospedaliero-Universitaria Pisana, Pisa: Anna Solini.
13. Ospedale Le Scotte, Siena: Francesco Dotta, Cecilia Fondelli, and Laura Nigi.
14. Policlinico Umberto I, Roma: Susanna Morano, Tiziana Filardi, Irene Turinese, and Marco Rossetti.
15. Ospedale S. Maria Goretti, Latina: Raffaella Buzzetti and Chiara Foffi. 16. Ospedali Riuniti, Foggia: Mauro Cignarelli, Olga Lamacchia, Sabina
Pinnelli, and Lucia Monaco.
17. Policlinico Universitario, Bari: Francesco Giorgino, Luigi Laviola, and Annalisa Natalicchio.
18. Policlinico Mater Domini, Catanzaro: Giorgio Sesti and Francesco Andreozzi.
19. Policlinico Monserrato, Cagliari: Marco Giorgio Baroni, Giuseppina Frau, and Alessandra Boi.
Funding
This research was supported by the Research Foundation of the Italian Diabetes Society (Diabete Ricerca) and the Diabetes, Endocrinology and Metabolism (DEM) Foundation, and by unconditional grants from Eli Lilly, Sigma-Tau, Takeda, Chiesi Farmaceutici, and Boehringer-Ingelheim. The funding sources had no role in the study’s design, conduct, and reporting.
Availability of data and materials
The datasets analyzed during the current study are available from the corresponding author on reasonable request.
Authors’contributions
Ethics approval and consent to participate
The study was conducted in accordance with the Declaration of Helsinki. The research protocol was approved by the ethics committee of the coordinating centre (Sant’Andrea Hospital, Rome Italy) on 25 September, 2006 (n. 43/2006) and subsequently by the ethics committee of each participating centre. Participants provided an informed consent.
Consent for publication Not applicable.
Competing interests
AS: consulting fees from Astra-Zeneca, Boehringer–Ingelheim, Eli Lilly; lecture fees from Boehringer–Ingelheim, Eli Lilly, Sanofi-Aventis; grant support from Astra-Zeneca. GPe: consulting fees from Astra-Zeneca, Boehringer–Ingelheim, Eli Lilly; lecture fees from Astra-Zeneca, Boehringer–Ingelheim, Eli Lilly, Merck-Sharp&Dohme, Novo Nordisk. EO: consulting fees from Boehringer– Ingelheim, Eli Lilly, Novo Nordisk, Sanofi-Aventis; lecture fees from Abbot, Astra-Zeneca, Eli Lilly, Lifescan, Sanofi-Aventis, Takeda. EB: consulting fees from Abbott, Astra-Zeneca, Boehringer–Ingelheim, Bruno Farmaceutici, Eli Lilly; lecture fees from Bristol-Myers Squibb, Eli Lilly, Janssen, Merck-Sharp&Dohme, Novartis, Novo Nordisk, Roche, Sanofi-Aventis, Servier, Takeda; grant support from Astra-Zeneca, Genzyme, Menarini Diagnostics, Novo Nordisk, Roche, Takeda. CF: none reported. RT: consulting fees from Boehringer–Ingelheim, Sanofi-Aventis; lecture fees from Astra-Zeneca, Boehringer–Ingelheim, Eli Lilly, Janssen, Medtronic, Novartis, Novo Nordisk, Sanofi-Aventis; grant support from Astra-Zeneca, Boehringer–Ingelheim, Eli Lilly, Janssen, Novo Nordisk, Sanofi-Aventis. MV: none reported. FC: lecture fees from Astra-Zeneca, Boehringer–Ingelheim, Merck-Sharp&Dohme, Sanofi-Aventis, Takeda. OL: consulting fees from Astra-Zeneca, Boehringer– Ingelheim; lecture fees from Astra-Zeneca, Eli Lilly, Merck-Sharp&Dohme, Sigma-Tau, Sanofi-Aventis, Takeda; grant support from Astra-Zeneca. MB: lecture fees from Abbot, Astra-Zeneca, Mundi Pharma, Novo Nordisk, Sanofi-Aventis; grant support from Sanofi-Aventis. AN: consulting fees from Eli Lilly, Novo Nordisk; lecture fees from Eli Lilly, Novo Nordisk; grant support from AlfaSigma, Artsana, Astra-Zeneca, Eli Lilly, Novo Nordisk, Sanofi-Aventis. GPu: lecture fees from Astra-Zeneca, Eli Lilly, Sigma-Tau, Takeda.
Publisher’s Note
Springer Nature remains neutral with regard to jurisdictional claims in published maps and institutional affiliations.
Author details
1Department of Surgical, Medical, Molecular and Critical Area Pathology,
University of Pisa, Pisa, Italy.2Department of Clinical and Experimental Medicine, University of Pisa, Pisa, Italy.3Diabetes Unit, IRCCS“Cà Granda -Ospedale Maggiore Policlinico”Foundation, Milan, Italy.4Division of Endocrinology, Diabetes and Metabolism, University and Hospital Trust of Verona, Verona, Italy.5Diabetes Unit, University of Siena, Siena, Italy. 6Endocrinology and Diabetes Unit, Azienda Ospedaliera Papa Giovanni XXIII,
Bergamo, Italy.7Department of Clinical and Experimental Medicine, University of Padua, Padua, Italy.8Department of Clinical and Biological Sciences, University of Turin, Orbassano, Italy.9Department of Medical Sciences, University of Foggia, Foggia, Italy.10Unit of Endocrinology and Diabetes, Department of Medical Sciences, University of Cagliari, Cagliari, Italy.11Centre for Outcomes Research and Clinical Epidemiology (CORESEARCH), Pescara, Italy.12Department of Clinical and Molecular Medicine,“La Sapienza”University, Via di Grottarossa, 1035-1039, 00189 Rome, Italy.13Present Address: Department of Experimental Medicine,“La Sapienza”University, Rome, Italy.
Received: 3 November 2018 Accepted: 25 March 2019
References
1. Emerging Risk Factors Collaboration, Seshasai SR, Kaptoge S, Thompson A, Di Angelantonio E, Gao P, et al. Diabetes mellitus, fasting glucose, and risk of cause-specific death. N Engl J Med. 2011;364:829–41.
2. Gaede P, Vedel P, Larsen N, Jensen GV, Parving HH, Pedersen O. Blood pressure targets in patients with type 2 diabetes. Multifactorial intervention and cardiovascular disease in patients with type 2 diabetes. N Engl J Med. 2003;348:383–93.
3. Gaede P, Lund-Andersen H, Parving HH, Pedersen O. Effect of a multifactorial intervention on mortality in type 2 diabetes. N Engl J Med. 2008;358:580–91.
4. de Boer IH, Bakris G, Cannon CP. Individualizing blood pressure targets for people with diabetes and hypertension: comparing the ADA and the ACC/ AHA Recommendations. JAMA. 2018;319:1319–20.
5. Pagidipati NJ, Navar AM, Pieper KS, Green JB, Bethel MA, Armstrong PW, et al. Secondary prevention of cardiovascular disease in patients with type 2 diabetes mellitus: international insights from the TECOS Trial (Trial Evaluating Cardiovascular Outcomes With Sitagliptin). Circulation. 2017;136: 1193–203.
6. Mengden T, Ligges U, Mielke J, Bramlage P, Korzinek A, Sehnert W. Blood pressure control and cardiovascular risk in hypertensive patients with type 2 diabetes: the German T2Target registry. J Clin Hypertens (Greenwich). 2017; 19:757–63.
7. Calhoun DA, Jones D, Textor S, Goff DC, Murphy TP, Toto RD, et al. Resistant hypertension: diagnosis, evaluation, and treatment. A scientific statement from the American Heart Association Professional Education Committee of the Council for High Blood Pressure Research. Hypertension. 2008;51:1403–19. 8. Carey RM, Calhoun DA, Bakris GL, Brook RD, Daugherty SL,
Dennison-Himmelfarb CR, et al. Resistant hypertension: detection, evaluation, and management. A scientific statement from the American Heart Association. Hypertension. 2018;72:e53–90.
9. Judd E, Calhoun DA. Apparent and true resistant hypertension: definition, prevalence and outcomes. J Hum Hypertens. 2014;28:463–8.
10. Carey RM. Resistant hypertension. Hypertension. 2013;61:746–50. 11. Pimenta E, Calhoun DA. Resistant hypertension: incidence, prevalence, and
prognosis. Circulation. 2012;125:1594–6.
12. Daugherty SL, Powers JD, Magid DJ, Tavel HM, Masoudi FA, Margolis KL, et al. Incidence and prognosis of resistant hypertension in hypertensive patients. Circulation. 2012;125:1635–42.
13. Irvin MR, Booth JN 3rd, Shimbo D, Lackland DT, Oparil S, Howard G, et al. Apparent treatment-resistant hypertension and risk for stroke, coronary heart disease, and all-cause mortality. J Am Soc Hypertens. 2014;8:405–13. 14. Sim JJ, Bhandari SK, Shi J, Reynolds K, Calhoun DA, Kalantar-Zadeh K, et al.
Comparative risk of renal, cardiovascular, and mortality outcomes in controlled, uncontrolled resistant, and nonresistant hypertension. Kidney Int. 2015;88:622–32.
15. Holmqvist L, Boström KB, Kahan T, Schiöler L, Hasselström J, Hjerpe P, et al. Cardiovascular outcome in treatment-resistant hypertension: results from the Swedish Primary Care Cardiovascular Database (SPCCD). J Hypertens. 2018;36:402–9.
16. Persell SD. Prevalence of resistant hypertension in the United States, 2003-2008. Hypertension. 2011;57:1076–80.
17. McAdam-Marx C, Ye X, Sung JC, Brixner DI, Kahler KH. Results of a retrospective, observational pilot study using electronic medical records to assess the prevalence and characteristics of patients with resistant hypertension in an ambulatory care setting. Clin Ther. 2009;31:1116–23. 18. Muntner P, Davis BR, Cushman WC, Bangalore S, Calhoun DA, Pressel SL, et
al. Treatment-resistant hypertension and the incidence of cardiovascular disease and end-stage renal disease: results from the Antihypertensive and Lipid-Lowering Treatment to Prevent Heart Attack Trial (ALLHAT). Hypertension. 2014;64:1012–21.
19. Smith SM, Gong Y, Handberg E, Messerli FH, Bakris GL, Ahmed A, et al. Predictors and outcomes of resistant hypertension among patients with coronary artery disease and hypertension. J Hypertens. 2014;32:635–43. 20. Bangalore S, Fayyad R, Laskey R, Demicco DA, Deedwania P, Kostis JB, et al.
Prevalence, predictors, and outcomes in treatment-resistant hypertension in patients with coronary disease. Am J Med. 2014;127:71–81.e1.
21. van der Sande NGC, de Beus E, Bots ML, Voskuil M, Blankestijn PJ, Visseren F, et al. Apparent resistant hypertension and the risk of vascular events and mortality in patients with manifest vascular disease. J Hypertens. 2018;36:143–50.
22. de Beus E, Bots ML, van Zuilen AD, Wetzels JF, Blankestijn PJ. MASTERPLAN Study Group. Prevalence of apparent therapy-resistant hypertension and its effect on outcome in patients with chronic kidney disease. Hypertension. 2015;66:998–1005.
24. Solini A, Zoppini G, Orsi E, Fondelli C, Trevisan R, Vedovato M, et al. Resistant hypertension in patients with type 2 diabetes: clinical correlates and association with complications. J Hypertens. 2014;32:2401–10. 25. Penno G, Solini A, Bonora E, Fondelli C, Orsi E, Zerbini G, et al. Clinical
significance of nonalbuminuric renal impairment in type 2 diabetes. J Hypertens. 2011;29:1802–9.
26. Pugliese G, Solini A, Fondelli C, Trevisan R, Vedovato M, Nicolucci A, et al. Reproducibility of albuminuria in type 2 diabetic subjects. Findings from the Renal Insufficiency And Cardiovascular Events (RIACE) study. Nephrol Dial Transpl. 2011;26:3950–4.
27. Penno G, Solini A, Zoppini G, Orsi E, Zerbini G, Trevisan R, et al. Rate and determinants of association between advanced retinopathy and chronic kidney disease in patients with type 2 diabetes: the Renal Insufficiency And Cardiovascular Events (RIACE) Italian multicenter study. Diabetes Care. 2012;35:2317–123. 28. Solini A, Penno G, Bonora E, Fondelli C, Orsi E, Arosio M, et al. Diverging
association of reduced glomerular filtration rate and albuminuria with coronary and noncoronary events in patients with type 2 diabetes: the Renal Insufficiency And Cardiovascular Events (RIACE) Italian multicenter study. Diabetes Care. 2012;35:143–9.
29. Chobanian AV, Bakris GL, Black HR, Cushman WC, Green LA, Izzo JL Jr, et al. Seventh report of the Joint National Committee on Prevention, Detection, Evaluation, and Treatment of High Blood Pressure. Hypertension. 2003;42:1206–52. 30. Whelton PK, Carey RM, Aronow WS, Casey DE Jr, Collins KJ, Dennison
Himmelfarb C, et al. 2017 ACC/AHA/AAPA/ABC/ACPM/AGS/APhA/ASH/ ASPC/NMA/PCNA Guideline for the prevention, detection, evaluation, and management of high blood pressure in adults: executive summary: a report of the American College of Cardiology/American Heart Association task force on clinical practice guidelines. Hypertension. 2018;71:1269–324. 31. de Boer IH, Bangalore S, Benetos A, Davis AM, Michos ED, Muntner P, et al.
Diabetes and hypertension: a position statement by the American Diabetes Association. Diabetes Care. 2017;40:1273–84.
32. Penno G, Solini A, Orsi E, Bonora E, Fondelli C, Trevisan R, et al. Non-albuminuric renal impairment is a strong predictor of mortality in individuals with type 2 diabetes: the Renal Insufficiency And Cardiovascular Events (RIACE) Italian multicentre study. Diabetologia. 2018;61:2277–89. 33. Penno G, Solini A, Bonora E, Orsi E, Fondelli C, Zerbini G, et al. Defining the
contribution of chronic kidney disease to all-cause mortality in patients with type 2 diabetes: the Renal Insufficiency And Cardiovascular Events (RIACE) Italian Multicenter Study. Acta Diabetol. 2018;55:603–12.
34. Fatemi O, Goa C, Faselis C, Kokkinos P, Papademetriou V. Improvement in all-cause mortality with blood pressure control in a group of US veterans with drug-resistant hypertension. J Clin Hypertens (Greenwich). 2016;18:33–9. 35. Mancia G, Grassi G. Aggressive blood pressure lowering is dangerous: the
J-curve. Pro side of the argument. Hypertension. 2014;63:29–36.
36. Wu CY, Hu HY, Chou YJ, Huang N, Chou YC, Li CP. High blood pressure and all-cause and cardiovascular disease mortalities in community-dwelling older adults. Medicine (Baltimore). 2015;94:e2160.
37. Vidal-Petiot E, Ford I, Greenlaw N, Ferrari R, Fox KM, Tardif JC, et al. Cardiovascular event rates and mortality according to achieved systolic and diastolic blood pressure in patients with stable coronary artery disease: an international cohort study. Lancet. 2016;388:2142–52.
38. Kovesdy CP, Bleyer AJ, Molnar MZ, Ma JZ, Sim JJ, Cushman WC, et al. Blood pressure and mortality in US veterans with chronic kidney disease. Ann Intern Med. 2013;159:233–42.
39. Kumbhani DJ, Steg PG, Cannon CP, Eagle KA, Smith SC Jr, Crowley K, et al. Resistant hypertension: a frequent and ominous finding among hypertensive patients with atherothrombosis. Eur Heart J. 2013;34:1204–14. 40. de la Sierra A, Segura J, Banegas JR, Gorostidi M, de la Cruz JJ, Armario P, et
al. Clinical features of 8295 patients with resistant hypertension classified on the basis of ambulatory blood pressure monitoring. Hypertension. 2011;57: 898–902.
41. Bangalore S, Davis BR, Cushman WC, Pressel SL, Muntner PM, Calhoun DA, et al. Treatment-resistant hypertension and outcomes based on randomized treatment group in ALLHAT. Am J Med. 2017;130:439–448.e9.
42. Rosa J, Zelinka T, Petrák O,Štrauch B, Holaj R, Widimský J Jr. Should all patients with resistant hypertension receive spironolactone? Curr Hypertens Rep. 2016;18:81.