Vol.7 (2017) No. 4
ISSN: 2088-5334
Multi-Objective Sensitivity Analyses for Power Generation Mix:
Malaysia Case Study
Siti Mariam Mohd Shokri
#, Nofri Yenita Dahlan
#, Hasmaini Mohamad
# #Faculty of Electrical Engineering, Universiti Teknologi MARA (UiTM), Shah Alam, Malaysia E-mail: [email protected], [email protected], [email protected]
Abstract— This paper presents an optimization framework to determine long-term optimal generation mix for Malaysia Power Sector using Dynamic Programming (DP) technique. Several new candidate units with a pre-defined MW capacity were included in the model for generation expansion planning from coal, natural gas, hydro and renewable energy (RE). Four objective cases were considered, 1) economic cost, 2) environmental, 3) reliability and 4) multi-objectives that combining the three cases. Results show that Malaysia optimum generation mix in 2030 for, 1) economic case is 48% from coal, 41% from gas, 3% from hydro and 8% from RE, 2) environmental case is 19% from coal, 58% from gas, 11% from hydro and 12% from RE, 3) for reliability case is 64% from coal, 32% from gas, 3% from hydro and 1% from RE and 4) multi-objective case is 49% from coal, 41% from gas, 7% from hydro and 3% from RE. The findings of this paper are the optimum generation mix for Malaysia from 2013 to 2030 which is less expensive, substantially reduce carbon emission and that less risky.
Keywords— generation mix; dynamic programming (dp); single objective; multi-objective
I. INTRODUCTION
The recent issues of generation mix in Malaysia are: 1) over-dependency on a certain fuel type (oil, natural gas, coal and hydro), which is not viable for a long-term option, 2) lack of availability for a competitive, sustainable and alternative commercial energy sources for the long-term. This becomes big challenges for Malaysia power sector as highlighted in the Energy Service Conference 2016. These have led Malaysia to find other alternative resources to generate electricity. Some possible options are: 1) coal, however, this leads to the dependency on imported coal and will increase gas carbon emission; 2) natural gas, however, its capacity has a contracted gas volume and depletion of gas reserves; 3) hydro, however, there is limited hydro potential in Peninsular since it is complex technology and high investment; and 4) renewable energy (RE), however, the resources are interruptible and expensive. It is critical for Malaysia power system to find an optimum future fuel mix strategy to ensure sustainability of supply. It is important and timely to determine the optimum future generation mix for Malaysia considering various fuels, economic and policy factors in ensuring cost effectiveness, sustainable and secure power generation.
Generation expansion problem can be expressed as a highly constrained, large scale, nonlinear, discrete
optimization problem, mix-integer and stochastic optimization problem that typically aims at identifying the selection of the locations and technologies to use [1], [2], [3], [4]. There are numbers of computational optimization techniques that can be used for determining the optimal generation mix. The traditional approaches to solve the generation planning problem are based on mathematical programming methods such as Linear Programming (LP), mixed integer linear programming (MILP) model [3], [4], [5], [6] and Dynamic Programming (DP) [7]. The metaheuristic approach such as Genetic Algorithm (GA) [2][8] that is among popular AI-based techniques for generation mix optimization, Evolutionary Programming (EP) [9], [10], [11], Evolutionary Strategy (ES) [12] and Partial Swarm Optimization (PSO) [13], [14] are applied to solve expansion generation mix problem. A comparative study on the techniques used for generation expansion planning has been performed in [1], [15].
Generation mix problem is to determine what to build (choice of technology), how much to build (capacity of the plant), and when to build (suitable time for expansion). The choice of which technology to be included in the generation mix is essential, yet difficult because each technology has its own advantages and disadvantages [16].
to determine optimal generation mix planning at the least cost for 4,100MW additional capacity as announced by Malaysia Energy Commission. The combination of four technology options namely nuclear, coal, natural gas and renewable energy (RE), authors of [11] have extended the study to compare three objectives function that compared in term of economic cost, socio-environmental and power system reliability. However, both studies did not consider a long-term generation mix for Malaysia. On the other hand, [17] presents a long-term generation mix model to minimize the total cost of supplying electricity. After that, [7] proposes DP with efficiency multi-criteria decision technique in modelling multi-objective (i.e. to minimize the cost and to minimize CO2 emission) of the long-term generation mix.
They also conducted a sensitivity analysis to evaluate the impact of the inclusion of nuclear in the generation mix, increasing the gas price and the RE target policy. This paper did not consider a power system reliability as the objective function.
Section II presents the mathematical formulation of the DP-generation mix and display the test data. The optimization results and discussion described in section III. Section IV gives the conclusion and finding of the paper.
II. MATERIAL AND METHOD
A. DP- based Generation Mix Model
DP is applied over a time horizon to find a set of optimal decision to minimize the objective function subjected to several constraints. The DP is an approach that transforms a complex problem into a simpler sub-problem. Its main characteristic lies in the way that optimization is solved in multi-stages. In the DP-based generation mix model, a state is defined as the existing units plus the new units. This model selects the generation options each year among the set of generation technologies until it reaches the optimization horizon.
The DP-based generation mix is tested using four cases of optimization objectives; 1) economic objective which is to minimize the total cost of generation expansion, 2) environmental objective which is to minimize the total carbon emission, 3) reliability objective which is to maximize the reliability of system by minimizing the loss of load expectation (LOLE) and 4) multi-objectives which is to minimize the normalized index.
The optimization model’s objective function and constraints are presented below.
1)Least Cost Modelling
The DP-based generation mix is developed to minimize the total cost of generation expansion, including investment and operating costs. Some factors that contribute to the generation cost of the technologies are included in the generation mix model. These include investment cost, construction time, plant lifetime, fixed and variable O&M costs, fuel cost and fuels escalation rate. The total cost of future generation expansion, considering the generation cost profiles of different technologies, is given by the following equation:
(1)
where is the total cost of generation mix over the simulation horizon, PCall,t is the total production cost of all the generating units in the system at year t, ICt is the total investment cost of the new investments at year t, Xt is the cumulative capacity (MW) vector in year t, Ut is the capacity addition vector in year t and T is the lifetime of the new plant. Multiplying the marginal cost by the energy produced gives the production cost of each unit. The energy produced each year is computed by performing economic dispatch for each segment of the load duration curve (LDC).
FOMall,t is the total fixed O&M cost of all the generating
units at year t, VOMall,t is the total variable O&M cost of all the generating units at year t and CCt is the total carbon emission cost of coal and combined cycle technologies at year t. Economic dispatch is modeled in the DP-based generation mix to calculate the power dispatch by the generating unit in the system and production cost of each unit [7].
2)Least Carbon Emission Modelling
The next model is developed to minimize the total carbon emission as an environmental objective function. It can be determined based on the carbon content of the different unit technologies. The total carbon emission for future expansion as the following equation:
(2)
where is the total carbon emission at year t.
3)Least Loss of Load Expectation (LOLE) Modelling
One of the main objective in generation mix optimization is for ensuring the long-term security of Malaysia power supply. In power supply section, generator outage can occur due to planned maintenance or mechanical failure that may leave the system with the insufficient generating capacity to meet load demand. The loss of load probability and loss of load expectation of the system is given by the following equation:
(3)
(4)
where is actual capacity for state , is a capacity outage, is load demand and d is duration for each
segment in an hour. Equation (3) indicates that loss of load probability (LOLP) is probability loss of load occur when the system load exceeds the generating capacity available for use.
4)Least Normalized Index Modelling
formulated as the weighted sum of normalized values of these three cases of objectives. The objective function are scaled between 0 and 1. For each of the three case objectives, a minimum and maximum value are defined. The normalized index of multi-objectives function is given by the following equation:
(5)
(6)
(7)
where is the actual value, and is minimum and maximum value of objective function. Equation (6) indicates that the least normalized index is equal to summation of three normalized objective functions multiplied by weights. The weights of each objective in this study is set similar as shown in equation (7).
5)Constraints Modelling
• Generation capacity larger than demand capacity plus some reserve margin.
(8)
• Reserve margin lies between the minimum and maximum reserve.
(9)
where Kt is the capacity retirement, T is the optimization horizon, R is the reserve margin resulting from the generation capacity Xt, and Rmin and Rmax are the minimum and maximum reserve requirement each year. Equation (8) indicates that the cumulative capacity at year t is equal to the capacity of the previous year, plus the new capacity built at year t, minus the capacity retirement happening at year t. Equation (9) constraints the installed capacity to be within the minimum and maximum reserve requirements allowed in the system.
B. Test Data
The proposed model has been implemented in Matlab programming. The analysis has been tested on Malaysia’s Power System. The actual data was collected on 2012 from the Energy Commission (EC), Tenaga Nasional Berhad (TNB), U.S. Energy Information Administration (EIA) and International Energy Agency (IEA). The planning horizon
consists of a period of seventeen years (2013-2030), and base year of 2012 with install generation capacity of 21,871MW. The system consists of one hundred thirty-two generating units from five different fuel technologies namely coal, gas, hydro, oil and RE as shown in Appendix. Three power plants as highlighted in bold in the Appendix are extending their expiry of the power purchase agreement’s (PPA). Two power plants (Segari Energy venture and Genting Sanyen Power) will be granted a 10-year PPA extension and will be retired on 2027 and 2026 respectively. Meanwhile, SJ Sultan Iskandar (combined cycle) plant will extend its services for another 5 years and will be retired on 2022.
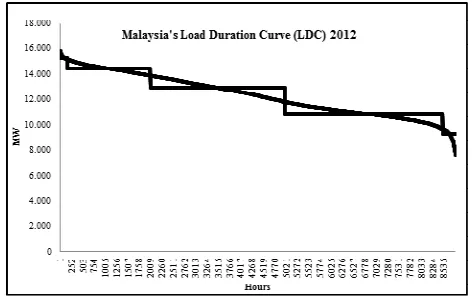
Fig. 1 shows a six-segment of discretised load duration curve (LDC) for Malaysia. The hourly load demand data is obtained from EC for the year 2012. Table 1 shows a demand and duration for each segment from LDC.
Fig. 1 Six-segment discretised Load Duration Curve (LDC) for Malaysia
Table 2 shows a long-term load growth forecast from the year 2013 to 2030. Average period growth rate forecast for the year 2013 to 2015 is 3.7%, the year 2016 to 2020 is 3.3% and year 2021 to 2030 is around 1.6%. This load growth is significant to be acquainted with the quality of load demand, reserve margin and total install capacity of the power plant.
TABLE I
DEMAND AND DURATION FOR SIX-SEGMENT
Segment 1 2 3 4 5 6
Demand
(MW) 15,644 15,287 14,440 12,913 10,896 9,309
Duration (h) 16 144 1840 3000 3500 284
TABLE II
LOAD GROWTH FORECASTED 2013-2030
Year 2013 2014 2015 2016 2017 2018 2019
Growth (%) 4.5 3.6 3.2 3.8 3.2 3.3 3.0
Year 2020 2021 2022 2023 2024 2025 2026
Growth (%) 3.5 2.9 2.1 0.7 1.9 1.8 1.7
Year 2027 2028 2029 2030
TABLE III
TECHNICAL OF MODELLING PARAMETERS
Parameter Unit Coal Gas Hydro RE
Name unit PG
01
PG 02
PG 03
PG 04
PG 05
PG 06
Net capacity MW 700 500 600 400 150 200
Heat rate MBTU/MWh 8.13 8.13 9.37 9.37 5.77 4.31
Construction
time Years 4 4 5 5 5 2
Plant life time Years 40 40 30 30 40 40
TABLE IV
COST AND FINANCING OF MODELLING PARAMETERS
Parameter Unit Coal Gas Hydro RE Oil
Carbon intensity tc/MBTU 0.0258 0.0148 0 0 0
Fixed O&M $/kW/yr 27.53 11.70 13.63 11.68 21.50
Variable O&M $/MWh 4.59 2 2.43 0 3.17
fuel cost $/MBTU 2.46 4.26 1 1 24.37
Fuel escalation rate % 0.5 1.5 0 0 1.0
Force Outage rate (FOR) - 0.06 0.04 0.05 0.08 0.10
This study considers four generation technologies i.e. coal, gas, hydro and RE that available to be selected by DP each year for future additional generation expansion. The technical and cost characteristics of the expansion plants are shown in Table 3 and Table 4. Similar costs data have been used for the existing system.
III. RESULTS AND DICUSSION
The DP-based generation mix model is analysed for four case studies. A case study has been carried out using the presented model to determine long-term optimum Malaysia generation mix with an 18-year planning period. It will be 64 possible options or also called states comes from 6 candidate units of technology for DP selection.
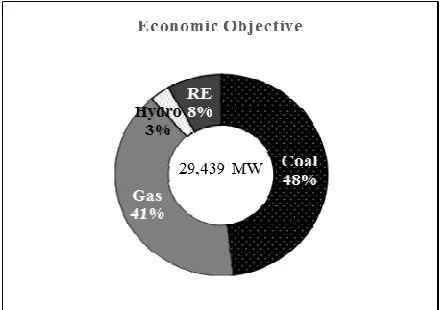
A. Case 1: Economic Objective
In this case, the generation mix is to minimize the total cost of power generation. The optimum generation mix for Malaysia at minimum cost objective in the year 2030 is 48% from coal, 41% from gas, 3% from hydro and 8% from RE with total install capacity is 29,439 MW, as shown in Fig. 2.
Fig. 2 Malaysia generation mix on 2030 with economic objective
Table 5 shows the result of optimum installed capacity for each type of technologies considering the economic objective. The optimum option is on option 54 from all 64 of possible options. The coal has the highest capacity of 14,201 MW followed by the gas with 11,911 MW the RE with 2,429 MW and hydro with 901 MW. The optimum total cost over the 18 years planning period considering economic objective is $96 billion. The carbon emission and LOLE for this least cost objective are 449 million tCO2 and 1.71 days
per year respectively.
TABLE V
OPTIMUM INSTALLED CAPACITY, TOTAL COST, TOTAL CO2 AND LOLE FOR ECONOMIC OBJECTIVE
Option Coal (MW) Gas (MW) Hydro
(MW)
RE (MW)
54 14,201 11,911 901 2,429
Total Cost ($) Total CO2 (tc) LOLE (days/year)
96,065,575,890.62 449,433,569.89 1.71
Fig. 3 shows the result of the expansion plants that are selected by the DP each year from 2013 until 2030 to meet the demand growth and to replace the retirement units. In the year 2015, there is no expansion of unit as the install capacity has met the demand and reserve requirement in that year. Throughout the years, gas technology has been shown as the favourite technology selected by DP.
B. Case 2: Environmental Objective
Fig. 3 DP evaluation additional electricity generation capacity for economic objective
Fig. 4 Malaysia generation mix on 2030 with environmental objective
The optimal solution is option 61 with install capacity of 17,310 MW from the gas, 5,601 MW from the coal, 3,628 MW and 3,300 MW from the RE and hydro respectively. Table 6 shows that the total carbon emission considering environmental objective reduced by 18.72% as compared to total carbon emission in the case of the economic objective.
Fig. 5 shows that coal technology was not selected by DP due to higher carbon emission. In the year 2024 and 2026, technology selection was reduced since the installed capacity has met the demand and reserve requirement in that year.
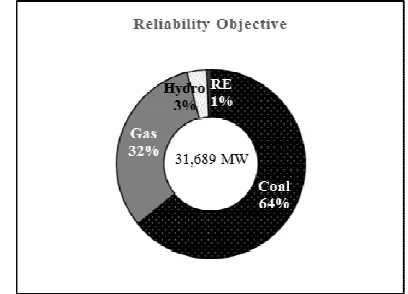
C. Case 3: Reliability Objective
In the case of reliability objective, the optimum generation mix in the year 2030 is 64% from coal, 32% from gas, 3% from hydro and 1% from RE as shown in Fig. 6.
TABLE VI
OPTIMUM INSTALLED CAPACITY, TOTAL COST, TOTAL CO2 AND LOLE FOR ENVIRONMENTAL OBJECTIVE
Option Coal (MW) Gas (MW) Hydro
(MW)
RE (MW)
61 5,601 17,310 3,300 3,628
Total Cost ($) Total CO2 (tc) LOLE (days/year)
110,250,420,884.15 365,297,466.89 0.57
Fig. 5 DP evaluation additional electricity generation capacity for environmental objective
Fig. 6 Malaysia generation mix on 2030 with reliability objective
Table 7 shows that the optimum option is on option 30. The highest installed capacity in the generation mix is contributed by the coal with 20,300 MW. This is followed by gas with 10,109 MW, the hydro with 1,049 MW and the RE technology with 229 MW. The installed capacity of the coal and hydro technologies have significantly increased from the case of the economic objective. It is found that the LOLE considering reliability objective is more than 100% lower than the LOLE with the case of economic and environmental objectives. This indicates that by minimizing LOLE in power generation mix planning could maximize the power system reliability.
TABLE VII
OPTION, TOTAL COST, TOTAL CARBON EMISSION AND LOLE FOR RELIABILITY OBJECTIVE
Option Coal
(MW)
Gas (MW)
Hydro (MW)
RE (MW)
30 20,300 10,109 1,049 229
Total Cost ($) Total CO2 (tc) LOLE (days/year)
101,997,663,107.35 480,950,452.39 4.33E-6
selected in this case as RE has a lower capacity factor hence availability in the system.
Fig. 7 DP evaluation additional electricity generation capacity for reliability objective
D. Case 4: Multi-Objectives
Case four presents generation mix considering simultaneous multi-objectives i.e. economic cost, environmental impact, and system reliability. The objective value for the three single objectives was normalized and the optimum generation mix depends on the minimum value of the normalized index. A weighted sum technique [3] was used in this case. The weighted value for each objective function is the same, where the total weight is equal to one. Fig. 8 shows the result of optimum generation mix for the multi-objectives case with 49% from coal, 41% from gas, 7% from hydro and 3% from RE technology.
Table 8 shows that coal has the highest installed capacity of 15,200 MW. This is followed by gas with 12,710 MW, hydro with 2,101 MW and RE with 1,030 MW. The total cost for this generation mix is $104 billion, total carbon emission is 447 million tCO2 and LOLE is 2.24E-3 days per
year. The result of LOLE achieved the reliability policy target that is less than 1day LOLE per year. The weighted sum approach gives the minimum multi-objectives index of 0.4171 with option 42.
TABLE VIII
OPTION, TOTAL COST, TOTAL CARBON EMISSION AND LOLE FOR MULTI-OBJECTIVES
Option Coal (MW) Gas
(MW)
Hydro (MW)
RE (MW)
42 15,200 12,710 2,101 1,030
Total Cost ($) Total CO2 (tc) LOLE
(days/year)
104,032,930,775.29 447,424,628.73 2.24E-3
Normalize total cost
Normalize
total CO2
Normalize LOLE
Normalize Index
0.2639 1 0 0.4171
Fig. 9 shows that no expansion of power plant in the year 2014 and 2015 since the installed capacity has met the demand and reserve in that year.
Fig. 8 Malaysia generation mix on 2030 with multi-objectives
Fig. 9 DP evaluation additional electricity generation capacity for multi-objectives
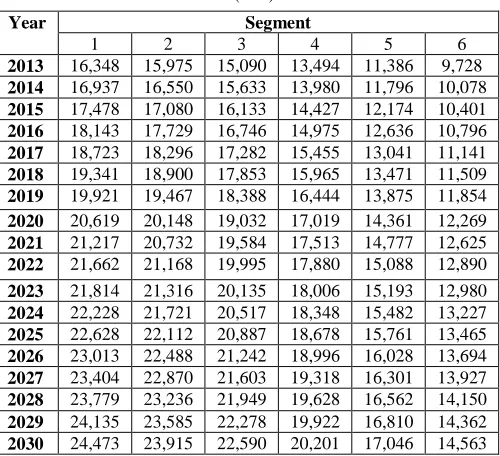
Table 9 shows load capacity forecasted during the year 2013 until 2030 for six-segment. While Table 10 shows the install capacity of planning time horizon for four case studies.
TABLE IX
LOAD FORECASTED (MW) DURING 2013-2030
Year Segment
1 2 3 4 5 6
TABLE X
INSTALL CAPACITY OF PLANNING TIME HORIZON FOR EACH CASE STUDY
Case Study Case 1 (MW)
Case 2 (MW)
Case 3 (MW)
Case 4 MW) Year
2013 23,280.5 22,980.5 23,480.5 22,930.5
2014 23,480.5 24,330.5 23,480.5 22,930.5
2015 22,643.5 24,843.5 22,643.5 22,093.5
2016 21,868.5 24,618.5 22,368.5 22,368.5
2017 22,481.5 24,781.5 23,381.5 23,381.5
2018 23,242.5 24,992.5 24,442.5 24,192.5
2019 23,942.5 26,342.5 25,142.5 24,742.5
2020 24,761.5 26,811.5 26,461.5 26,261.5
2021 25,531.5 27,831.5 27,331.5 26,531.5
2022 26,031.5 29,181.5 28,031.5 27,081.5
2023 26,222.5 29,622.5 27,822.5 27,822.5
2024 26,702.5 29,252.5 28,402.5 27,702.5
2025 27,272.5 29,272.5 28,772.5 28,722.5
2026 27,752.5 29,602.5 29,452.5 28,702.5
2027 28,277.5 30,277.5 30,077.5 29,877.5
2028 28,619 30,069 30,869 30,669
2029 29,089 30,689 31,339 30,689
2030 29,439 29,839 31,689 31,039
IV.CONCLUSIONS
In this paper, a DP-based model for four case studies has been developed to find the optimum generation mixes for Malaysia power sector. The model considers characteristics associated with different technologies, such as the investment cost, the O&M cost, the lifetime, the construction period, the fuel cost and the carbon intensity. The model has been tested on a generation portfolio based on Malaysia power system. The result shows that optimal Malaysia generation mix in 2030 for the economic objective is: 48% from coal, 41% from gas, 3% from hydro and 8% from RE. The optimum environmental objective is 19% from coal, 58% from gas, 11% from hydro and 12% from RE. Other than that, the optimum reliability objective is 64% from coal, 32% from gas, 3% from hydro and 1% from RE. While, the optimum multi-objectives are 49% from coal, 41% from gas, 7% from hydro and 3% from RE
Economic objective prefers coal technologies to minimize the total cost. On the other hand, environmental objective reduces coal technology in the generation mix, while the coal and hydro technologies are the most contributing technologies to the reliability objective. For multi-objective generation mix, the selection of all the four technologies is seen balance. The research will continue with optimizing under multi-objective decision technique.
ACKNOWLEDGMENT
We would like to thank Malaysia Ministry of Education and Universiti Teknologi MARA(UiTM) who have sponsored this paper under Research Acculturation Grant Scheme (RAGS), 600- RMI/RAGS 5/3 (194/2014).
REFERENCES
[1] S. Kannan, S. M. R. Slochanal, and N. P. Padhy, “Application and Comparison of Metaheuristic Techniques to Generation Expansion Planning Problem,” vol. 20, no. 1, pp. 466–475, 2005.
[2] A. J. C. Pereira and J. T. Saraiva, “Generation expansion planning (GEP) – A long-term approach using system dynamics and genetic algorithms (GAs),” Energy, vol. 36, no. 8, pp. 5180–5199, Aug. 2011. [3] H. Tekiner, D. W. Coit, and F. a. Felder, “Multi-period
multi-objective electricity generation expansion planning problem with Monte-Carlo simulation,” Electr. Power Syst. Res., vol. 80, no. 12, pp. 1394–1405, Dec. 2010.
[4] K. Promjiraprawat and B. Limmeechokchai, “Multi-objective and multi-criteria optimization for power generation expansion planning with CO 2 mitigation in Thailand,” vol. 35, no. 3, pp. 349–359, 2013. [5] Z. A. Muis, H. Hashim, Z. A. Manan, and F. M. Taha, “Optimal Electricity Generation Mix with Carbon Dioxide Constraint,” 2004. [6] P. J. Ramírez, D. Papadaskalopoulos, G. Strbac, and T. T,
“Co-Optimization of Generation Expansion Planning and Electric Vehicles Flexibility,” vol. 7, no. 3, pp. 1609–1619, 2016.
[7] S. M. Mohd Shokri and N. Y. Dahlan, “An Application of the Multi-Objective Approach for the Evaluation of Long-Term Electrical Generation Optimum Mix: a Case Study,” Int. Rev. Electr. Eng., vol. 9, no. 5, p. 991, 2014.
[8] A. J. C. Pereira and J. T. Saraiva, “A long term generation expansion planning model using system dynamics – Case study using data from the Portuguese/Spanish generation system,” Electr. Power Syst. Res., vol. 97, pp. 41–50, Apr. 2013.
[9] S. Kannan, S. M. R. Slochanal, S. Baskar, and P. Murugan, “Application and comparison of metaheuristic techniques to generation expansion planning in the partially deregulated environment,” 2007.
[10] N. A. H. A. Mutalib, N. Y. Dahlan, S. A. Abon, M. F. Rajemi, N. M.N.M, and F. Baharum, “Optimum generation mix for Malaysia’s additional capacity using evolutionary programming,” in 2014 IEEE
International Conference on Power and Energy (PECon), 2014, pp.
65–70.
[11] S. A. Abon, N. Y. Dahlan, and Z. M. Yassin, “Evolutionary programming based generation mix model for Malaysia considering cost, environmental and reliability factors,” J. Electr. Syst., vol. 2015, no. Specialissue3, pp. 26–34, 2015.
[12] E. Alishahi, M. P. Moghaddam, and M. K. Sheikh-el-eslami, “An investigation on the impacts of regulatory interventions on wind power expansion in generation planning,” Energy Policy, vol. 39, no. 8, pp. 4614–4623, 2011.
[13] S. Kannan, S. M. R. Slochanal, P. Subbaraj, and N. P. Padhy, “Application of particle swarm optimization technique and its variants to generation expansion planning problem,” Electr. Power
Syst. Res., vol. 70, no. 3, pp. 203–210, Aug. 2004.
[14] R. Hemmati, R. Hooshmand, and A. Khodabakhshian, “Reliability constrained generation expansion planning with consideration of wind farms uncertainties in deregulated electricity market,” Energy
Convers. Manag., vol. 76, pp. 517–526, 2013.
[15] H. Sadeghi, M. Rashidinejad, and A. Abdollahi, “A comprehensive sequential review study through the generation expansion planning,”
Renew. Sustain. Energy Rev., vol. 67, no. May 2016, pp. 1369–1394,
2017.
[16] A. M. Isa, H. Magori, T. Niimura, and R. Yokoyama, “Multi-Criteria Generation Optimal Mix Planning for Malaysia ‟ s Additional Capacity,” vol. 4, no. 4, pp. 221–228, 2010.
APPENDIX
Power Plant Unit
Name Size (MW) Unit Type PPA Expiry
YTL Power Generation
001-009 9x130 gas 2015 Segari Energy Ventures Sdn. Bhd.
010-011 2x651.5 gas 2017
2027
Power Tek Sdn. Bhd.
012-015 4 x 110 gas 2015 Por t Dickson Sdn. Bhd.
016-019 4 x 110 gas 2015 Pahlawan Power Sdn. Bhd.
020-022 3 x 110 gas 2020 Genting Sanyen Power Sdn. Bhd. 23 1 x87 gas 2015 Genting Sanyen Power Sdn. Bhd.
(GSP Extension)
024-026 3 x 225 gas 2016
2026
Teknologi Tenaga Perlis Consortium Sdn. Bhd.
027-030
3 x 145;
1x215 gas 2023 Panglima Power Sdn. Bhd.
031-033
2 x 230;
1x260 gas 2022 GB3 Sdn. Bhd.
034-037
1 x 205;
3x 145 gas 2022 Prai Power Sdn. Bhd.
038-039
1 x 225;
1x 125 gas 2024 KaparEnergy Ventures Sdn. Bhd.
(KEV)
040-041 2x110 gas 2019 KaparEnergy Ventures Sdn. Bhd.
(KEV)
042-047
4x300;
2x500 coal 2029 TNB JanamanjungSdn. Bhd.
048-050 3x700 coal 2031 Tanjung Bin Power Sdn. Bhd.
051-053 3x700 coal 2031 Jimah Energy Ventures Sdn. Bhd.
054-055 2x700 coal 2033 S.J. Sultan Ismail , Paka
056-067
3x100; 7x95;
2x87
gas 2017 S.J. Jambatan Connaught (CBPS)
068-074
4x130; 2x10⁶; 1x10⁵
gas 2014 S.J. Serdang (GT1 , GT2 & GT3)
075-077 3x135 gas 2015
S.J. Serdang (GT4 & 5)
078-079 2x110 gas 2025 S.J. Sultan Iskandar, PasirGudang
(PGPS) (Thermal)
080-081 2x120 gas 2017 S.J. Sultan Iskandar, PasirGudang
(PGPS) (Combined Cycle)
082-084
2x87; 1x95 gas
2017
2022
S.J. Sultan Iskandar, PasirGudang (PGPS) (Open Cycle)
085-086 2x110 gas 2016 S.J. TuankuJaafar, Por t Dickson
(PD1)
087-089
2x236;
1x258 gas 2028 S.J. TuankuJaafar, Por t Dickson
(PD2)
090-092
2x230;
1x250 gas 2030
S.J. Kenyir
093-096 4x100 hydro 2025
S.J. Pergau
097-100 4x150 hydro 2037 S.J. Temenggor
101-104 4x87 hydro 2022 S.J. Chenderoh
105-108
3x10.7;
1x8.4 hydro 2022
S.J Bersia
109-111 3x24 hydro 2022
S.J. Kenering
112-114 3x40 hydro 2022 S.J. Woh Sultan Idris II
115-117 3x50 hydro 2022 S.J. Cameron Highland
118-123
4x25;
2x2.75 hydro 2027 Sungai Piah Upper Power Station 124 1x14.6 hydro 2027 Sungai Piah Lower Power Station 125 1x54 hydro 2027 Odak Power Station 126 1x4.2 hydro 2027 Habu Power Station 127 1x5.5 hydro 2027 Kampong Raja Power Station 128 1x0.8 hydro 2027 Kampong Terla Power Station 129 1x0.5 hydro 2027 Robinson Falls Power Station 130 1x0.9 hydro 2027 S.J. Gelugor 131 1x330 oil 2024 BumibiopowerSdnBhd, Jana
Landfill SdnBhd, Naluri Ventures SdnBhd& Recycle Energy SdnBhd