Hrvoje ŠIMOVIĆ MSc* Review article**
Faculty of Economics, Zagreb UDC 336.12(4-67 EU)
JEL H72
Abstract
This paper analyses the current budgetary system of the EU, its features and the dif-ferences in it from the budgets of nation states, particularly from the standpoint of budg-etary revenue and expenditure. Below there is an analysis of the system of the redistri-bution of EU budgetary resources via the Structural Funds, leading to different net posi-tions of the member states in the use of budgetary resources. The object of the system is to achieve the maximum economic and social cohesion within the EU. The article points out that processes of EU enlargement and the creation of a new “financial perspective” will lead to many problems in the fulfilment of these objectives.
Key words: budget, European Union, net transfers, enlargement of the EU
Introduction
The budget of the European Union (EU) is the only centralised instrument for the implementation of the common fiscal policy at EU level. The remainder of the EU fis-cal system can be looked upon as a set of diverse rules and treaties via which the member states harmonise and coordinate the other segments of fiscal policy. The EU is a confed-eration, in other words a complex political and economic formation, and in this segment it is necessary to consider the EU budget, through which only a limited number of com-mon EU functions are financed.
The basic objective of the paper is to present the EU budget in the current political and economic environment and to study its features as compared with the classic budgets
*The author would like to thank the anonymous reviewers for their useful suggestions. ** Received: March 22, 2005
of nation states. As well as the allocation of the budgetary resources, we shall analyse the system by which EU budgetary resources are redistributed. Accordingly we shall endeav-our to discern how much given processes, like the enlargement of the EU and the gradu-al strengthening of economic integration, will affect demands for changes within the EU budget and require a different allocation of resources for the sake of achieving economic convergence among the EU’s member states.
The first part analyses the basic features of the EU budget, that is, those things that basically distinguish it from the budgets of nation states. The second part of the paper is concerned with the redistribution of EU budgetary resources and the effect of EU enlarge-ment on the redistribution of budgetary resources, while the conclusion is to be found in the third part.
1 The Basic Characteristics of the European Union Budget
Every budget in a nation state (unitary or federal) has several assignments. The basic functions of the budget are the implementation of the fiscal (budgetary) policy and trans-fers policy among the (differently developed) regions or among individuals. Fiscal poli-cy covers the management of budgetary revenues and expenditures, alternatively of the deficit or surplus of the budget because of its impact on aggregate demand. The effects of fiscal policy on aggregate demand may be effectuated in several ways: (1) via the use of the built-in or automatic stabilisers; (2) with the use of discretionary measures from those in charge of fiscal policy, and (3) through the establishment of rules or with the use of the flexible policy formula, as it is called (Jurković, 1989). Each one of these measures has had during history varying importance (for example, Keynesian interventionism) and each of these has had various effects (for example, the effect of driving out private investments). Irrespective of which of the measures have prevailed, there is always a certain similari-ty to be found in all budgetary policies. First of all, every budget has to be big enough as compared with the domestic product to be able to have an impact on movements in the economy. Secondly, it has to be possible to create budgetary deficits or surpluses capable of affecting the business cycles. And thirdly, fiscal and monetary policies should be co-ordinated so as to be able jointly to head the economy in a given direction (Jašić, 1982; Jurković, 1989; Peacock and Shaw, 1976).
The traditional theory of public finance, or fiscal federalism, gave rise to the outline rules that have to be adhered to in the development of a multi-level system of decision-making in fiscal matters (e.g., Musgrave, 1973; Oates, 1972). In this case there were no po-litical or constitutional restrictions taken into account, of the kind that today are relevant to confederations such as the EU. In accordance with this, it was necessary to construct fiscal relationships such that (1) member states should retain a high degree of political and con-stitutional sovereignty, (2), the supra-national or confederal level would have only such au-thorities as the member states confer up on it, (3) the fiscal rules established at the confed-eral level would not be in conflict with those at a national level and (4) it would all lead to the creation of monetary union within the existing confederation (Mihaljek, 1998:208).1
It was just such an environment that affected the structure and functions of today’s EU budget, which takes part in restricted allocation and redistribution, and has no part to play in the stabilisation of cyclical trends. In comparison with the classic national budgets, the differences an be seen in several basic characteristics of the EU budget: (1) the reve-nue and expenditure sides of the EU budget differ from the budgets of national states; (2) the EU budget is relatively small in comparison with the size of the economy it refers to; (3) it is more strictly and strongly regulated, which leads to its being austerely balanced2; and in connection with this (4) all borrowing is eliminated from it, as is any lending of re-sources to the spending agencies.
1.1 The Structure and size of the Revenue of the EU Budget
The budget of the EU consists of a system of own resources. Import customs duti-es, agricultural levies or dutiduti-es,3 part of Valued Added Tax (VAT) and revenue based on the gross national income (GNI) of the member countries constitute these “own resour-ces” as they are known. The maximum amount to which member countries can contribu-te in own resources is limicontribu-ted to 1.27% of GNI of the EU. Among own resources there are some other less important sources of revenue that are classified into a group known as other revenue. The revenue of the EU budget is divided into the following (European Commission, 2002a; EU Budget, 2005b):
• Customs duties – customs and other duties that are collected according to the Com-mon Customs Tariff on the import of products of countries outside the EU; • Agricultural duties, among which there are customs duties on the import of farm
products and levies for sugar and glucose. These levies are collected during trading with extra-EU countries, as part of the CAP and of the production and storage of sugar and glucose4.
1 One of the main debates concerns the direction of changes related to the EU budget. Changes from 1957 on, right up to the most recent financial perspective, can be considered from both the aspect of the traditional optimal theory of public finance and from the aspect of the public choice theory. For more see: Cullis and Jones (1998:300-309); Persson et al. (1996).
2 It is thus still called an “accounting budget” because revenue is still identical to expenditure.
3 Customs duties and agricultural levies are the first own resources, dating from 1970, when the system of own resources was established. For this reason they are still referred to as the traditional own resources.
• Revenue accruing from VAT. This revenue is established for each country by the application of a single rate on the harmonised tax base, which is established accor-ding to certain EU rules. From 1999, this base has not been allowed to exceed 50% of the GNI of the member states, and a reduction of the single rate year after year is anticipated (in 2002 it came to 0.75%, in 2004, 0.5%).
• Revenue as a percentage of the GNI of the member states. This revenue is calcula-ted in such a way that a certain rate is applied to the difference between the GNI of every member state and the harmonised VAT base.
• Other sources of revenue consist of income tax and fees that are paid by the per-sonnel of EU institutions, revenue from interest and guarantees, revenue from fines and other revenues.
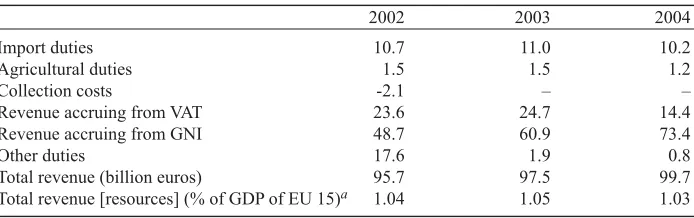
Table 1: EU Budgetary Revenue (in % of total revenue)
2002 2003 2004
Import duties 10.7 11.0 10.2
Agricultural duties 1.5 1.5 1.2
Collection costs -2.1 – –
Revenue accruing from VAT 23.6 24.7 14.4
Revenue accruing from GNI 48.7 60.9 73.4
Other duties 17.6 1.9 0.8
Total revenue (billion euros) 95.7 97.5 99.7
Total revenue [resources] (% of GDP of EU 15)a 1.04 1.05 1.03
a Author’s calculation
Source: European Commission (2003; 2004b)
Table 1 displays the revenue of the EU budget in the last few years. It can be seen that traditional own resources (customs duties and agricultural levies) have gradually lost their importance over the years. Among these, the most important are customs duties, which accounted for 10.2% of total revenue in 2004. The most important resources, ho-wever, are revenue that accruing from VAT and GNI, together making up more than 80% of total revenue. A fall in revenue from VAT can be seen, which is logical because of the continuous reduction of the single rate that is applied to the harmonised tax base of the EU member states, while revenue from GNI is constantly on the rise and amounts to as much as 73.4% of the total revenue of the EU budget. Table 1 shows the ratio of EU bu-dget revenue and the gross domestic product (GDP) of the then members of the EU. This ratio ranges around 1%, which indicates the relative small scale of the EU budget as com-pared with the GDP of the EU as a whole.
difference between the EU budget and the national budgets is that the central budget collects most of the tax revenue and through various transfers assists the budgets of lower levels of government. In the context of the EU, the lower levels of government, that is the member states of the EU, control their own tax revenues, and it is from them that the revenue with which the EU budget is financed is derived. The most important reason that the budget of the EU does not take part in any major allocation or redistri-bution of resources is its size. The revenues of the national budgets range between 15 and 50% of GDP, for the individual states (Table 2) while the equivalent figure in the EU ranges around 1%.
Table 2: Revenue of central governments as a percentage of total revenue in 2002
Taxes on Contributions Payroll Property Tax on sale Other Total Total
income tax taxes of goods (% of
and profits and GDP)
services
Federal states
Austria 29.8 33.5 6.1 1.3 28.0 1.2 100 44.1
Canada 45.5 15.2 2.1 10.1 26.6 0.5 100 33.5
Germany 28.0 40.1 – 2.3 29.3 0.0 100 36.2
USA – – – – – – – 17.7
Unitary states
France 24.0 37.2 2.4 7.0 25.5 3.6 100 44.2
Sweden 36.1 30.1 4.1 3.2 26.1 0.2 100 50.6
UK 37.9 17.1 – 12.1 32.4 0.0 100 35.9
European Uniona – – – – – – – 1.04
a After Table 1.
Source: OECD (2003).
1.2 The Structure and size of EU Budgetary Expenditure
The expenditure of the EU budget is planned over the medium term, as a part of what is called the system of the Financial Perspective, the instrument with which the EU car-ries out budgetary discipline through setting the ceiling on the basis of available revenue (the own resources system). The Financial Perspective system is established via an inter-institutional agreement, between the Parliament, the Council and the Commission. The last such agreement was made in 1999; see Agenda 2000 (1999).
wit-hin the EU financial system (for more, see EU Budget, 2005). After the First Delors Pa-ckage (1988-1992) came the Second Delors PaPa-ckage for 1993-1999. The last Perspecti-ve, popularly known as Agenda 2000, was adopted in 1999 in Berlin for the 2000-2006 period, while negotiations about a new Financial Perspective for the 2007-2013 period started in 2005.
In EU budgetary expenditure, resources are allotted for development and for the im-plementation of the common policies of the EU. The areas that are financed from the EU budget are those over which the member states have transferred their authorities to the EU. The EU budgetary expenditure can be divided into seven groups or items: 5
• Agriculture. Expenditures for the CAP (Common Agricultural Policy) are in fact expenditures of the Guarantee Section of the European Agricultural Guidance and Guarantee Fund – EAGGF). This is at the same time the biggest item in the EU bu-dget (Table 3), and the major part of it is used to provide guaranteed prices for the farm products of “domestic” producers.
• Structural operations. Outlays for structural operations or structural policy also cover the domains of regional and social policy. Most of these resources (more than 90%) are allotted to the Structural Funds: the European Regional Development Fund – ERDF; to the EAGGF’s European Social Fund – the ESF; and to the Financial In-strument for Fisheries Guidance – FIFG. Also classified in this group is the Cohe-sion Fund, the financial assistance mechanism for only those members the per ca-pita GNI of which is less than 90% of the per caca-pita GNI of the Union as a whole. After agricultural expenditures, expenditure for the structural policy is the biggest in the EU budget.
• Internal policy. Expenditure for various internal policies are grouped into five sets, among which there are various expenditures, for example for transport, education, culture, employment, media, energy policy, nuclear protection, the environment, va-rious activities related to the internal market, research and technological develop-ment, justice and security.
• Foreign activities. Expenditure for foreign activities relate to outlays for assistan-ce to countries outside the EU, exassistan-cept for countries that are classified into expendi-tures for the enlargement of the EU and the ERDF. This can include food aid costs and charitable aid, as well as the costs of various forms of collaboration outside the EU, for example, the CARDS programme (collaboration with the countries of the Balkans), the TACIS programme (collaboration with the republics of the former USSR), collaboration with the Mediterranean countries, developing countries in Asia, Latin America and South Africa.
• Administrative costs. These relate to the costs of the EU institutions and establis-hments. Most of the costs are accounted for by the work of the Commission (more than 60%), of Parliament (about 20%), then the Council, the Court of Justice, the Court of Auditors.
• Reserves. There are three kinds of reserve: monetary reserves, reserves for emer-gency aid and guarantee reserves. These resources are there for any unexpected ex-penditure that might arise during the execution of the budget.
• Assistance to future members. This expenditure belongs among foreign activities according to its type. But because of the importance and amount of the costs, it is set especially aside. It relates to the financing of various grants to countries that are EU candidates. These countries are divided into two groups: the countries of Cen-tral and Eastern Europe and the Mediterranean countries – Malta, Cyprus and Turke-y6. Assistance is allocated via three programmes: SAPARD for agriculture, PHARE for aid to the countries of CEE in transition and the restructuring of the economy; and ISPA – via which infrastructure projects in transport and environmental prote-ction are financed.
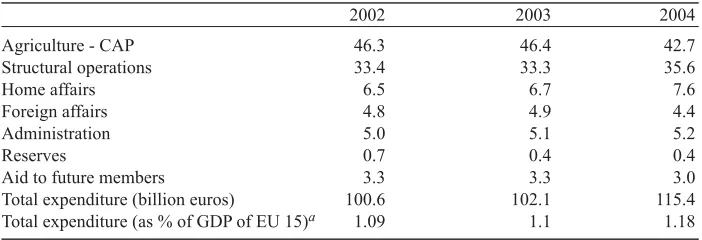
Table 3: EU budget expenditure (in % of total expenditure)
2002 2003 2004
Agriculture - CAP 46.3 46.4 42.7
Structural operations 33.4 33.3 35.6
Home affairs 6.5 6.7 7.6
Foreign affairs 4.8 4.9 4.4
Administration 5.0 5.1 5.2
Reserves 0.7 0.4 0.4
Aid to future members 3.3 3.3 3.0
Total expenditure (billion euros) 100.6 102.1 115.4
Total expenditure (as % of GDP of EU 15)a 1.09 1.1 1.18
a Author’s calculation
Source: According to the European Commission (2004b)
The ratios of expenditure for the CAP and structural operations within the EU bu-dget has changed during the last few years to the benefit of the structural operations (Eu-ropean Union, 2002:114-117). One of the reasons is the desire for the strengthening of the market “from within”, that is, for the creation of an efficient economic environment that will be competitive beyond the borders of the EU, and not the creation of competi-tiveness artificially, by various corrective mechanisms such as customs duties and quo-tas (Harrop, 2004).
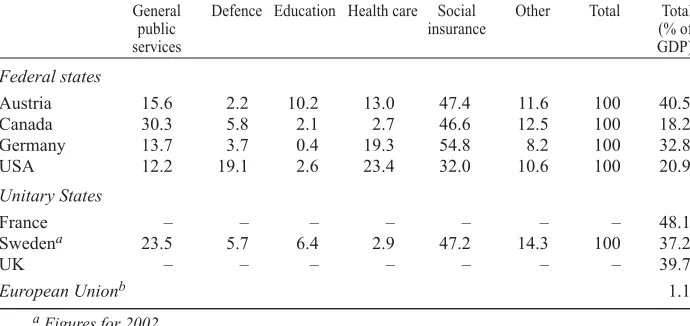
Similarly to the revenue, the expenditure of the EU budget is restricted to a narrow spectrum of policies as compared to the budgets of the nation states (see Table 4). As previously mentioned, in the EU budget there are two particularly important groups of expenditure: for the common agricultural policy and for structural policy. The greatest proportion of the expenditure of the classic budgets of the nation states consists large-ly of outlays for social insurance, health care, education and defence. Some of the
sources are earmarked for the costs of servicing the national or public debt. There is no such item in the EU budget, because there is no possibility of taking on debt, which creates an essential difference in the allocation of resources as compared with the na-tional budgets.
Table 4: Proportion of expenditure of central government in total expenditure in 2003 (in %)
General Defence Education Health care Social Other Total Total
public insurance (% of
services GDP)
Federal states
Austria 15.6 2.2 10.2 13.0 47.4 11.6 100 40.5
Canada 30.3 5.8 2.1 2.7 46.6 12.5 100 18.2
Germany 13.7 3.7 0.4 19.3 54.8 8.2 100 32.8
USA 12.2 19.1 2.6 23.4 32.0 10.6 100 20.9
Unitary States
France – – – – – – – 48.1
Swedena 23.5 5.7 6.4 2.9 47.2 14.3 100 37.2
UK – – – – – – – 39.7
European Unionb 1.1
a Figures for 2002
b After Table 3
Source: IMF (2004)
Another important difference vis-à-vis the nation states is the size of the budget. Even the governments of very decentralised (federal) states such as the USA and Canada acco-unt for a much greater proportion of expenditure in GDP terms, around 20%, while in the EU this proportion comes to 1.1% of the Union’s GDP.
The reason for all these differences between the EU budget and the budgets of the national states is the political and economic organisation of the EU already mentioned, in which, as in a confederation, other reasons as well as those considered in the traditional theories of public finance have to be considered.
1.3 Regulation of the EU Budget and the Possibility of Borrowing
As well as by the size and structure of its revenue and expenditure, the budget of the EU differs from the budgets of the nation states in that it is more tightly regulated. Apart from regulations that control the procedure of drawing up, adopting and executing the budget, its legal structure is defined by a series of legal documents (secondary legislation as it is called) of the EU institutions (Đurđević, 2004:183-184).
re-sources. In line with this restriction, the principle of budgetary balance was adopted, as well as other EU budget principles, which define its main characteristics7.
2 Redistribution of Budgetary Resources of the European Union
One of the regular macroeconomic roles of a budget is to be the foundation for the operation of automatic stabilisers. On the revenue side of the budget, this role is on the whole manifested by the action of progressive taxation, in connection with which it sho-uld be said that the degree of progressiveness in the taxation system of developed coun-tries is much lower than it used to be twenty years ago. On the expenditure side the wor-king of the automatic stabilisers can be seen in the various budgetary transfers for unem-ployment or outlays for social insurance. The main redistribution of resources is effected via the central national budget, which for this function has to be big enough, and is dire-cted to the creation of prosperity in the given complex community (the state).
The reason for the existence of the redistribution of income in traditional fiscal theory is explained by altruism – the unselfish will of the individual to set aside part of his or her income for redistribution (Musgrave, 1973:13-14; Cullis and Jones, 1998:225-227). As against this, in the public choice theory various transfers, grants and tax breaks on which redistribution is based are explained as the result of the better organisation and the lob-bying of various interest groups and the complexity of the structure of the public sector (Müller, 1989: 448-458; Cullis and Jones, 1998:27-229).
In the context of EU budget and EU redistributive policy, the second explanation is more apt because of the complexity of the vertical structure and of public decision making in the EU public sector. The EU budget is relatively not large, nor is it primarily oriented to the creation of prosperity, and its standardising redistributive role is hence limited.
As can be seen from the comparative analysis of the EU budget and the budgets of na-tion states, the EU as confederacy does not have a high degree of homogeneity and inte-gration in the supply of basic public goods and services or in taxation. In such a situation the possibility of the redistributive function being more powerfully centralised is slight, particularly in the various phases of integration (Mihaljek, 1998:208).
In accordance with this, in order for help to be given to poorer regions inside a regi-on, it is necessary for there to be a powerful feeling of belongingness, community and so-lidarity (Harrop, 2004:73). Such an environment is much more characteristic of a given member state than of the whole of the EU. The various barriers in culture, religion and language are the cause for this. For this reason regional policy in the EU is based on the provision of financial aid that affects the improvement of the general conditions of ear-ning a living, to enable more weakly developed regions to increase the flexibility of their production structure and approach and allocation of resources resulting in optimal eco-nomic growth8.
7 Concerning budgetary law of the EU, or the legal aspects, principles and procedure for the adoption of the EU budget, see Đurđević (2004) and/or European Commission (2002a).
The most important instruments in this segment of redistributive policy are the pre-viously mentioned EU expenditures for structural operations. These expenditures are carried out via the four Structural Funds and the Cohesion Fund. The common objecti-ve is to achieobjecti-ve as great a degree of social and economic cohesion as possible within the EU (Box 1). For the total resources for the structural operations, more than 90% are spent on the needs of the Structural Funds, and the rest is spent on the expenditures of the Cohesion Fund (European Commission, 2004b). A member state cannot obtain for the same project at the same time funds from the Cohesion Fund and from one or other of the Structural Funds. Their common objective is to achieve as great as possible social and economic cohesion within the EU (Box 1). Of the total resources for structural ope-rations, more than 90% are spent for the needs of the Structural Funds, while the rest is spent for the outlays of the Cohesion Fund (European Commission, 2004b). An additi-onal restriction to the ban on obtaining simultaneous resources from the Cohesion and Structural Funds is the ceiling on transfers from either of these funds in the amount of more than 4% of the recipient country’s own GNI.
Box 1: Structural Funds and the Cohesion Fund
The European Fund for Regional Development (ERDF) is the largest of the four stru-ctural funds. It is meant for the financial monitoring of regional development activi-ties and the correction of regional imbalances. It most frequently directs resources to “hard” transport infrastructure but also gets into other profit-creating investment such as help to SMEs. The European Social Fund (ESF) is meant for the labour market, the encouragement of mobility among the human production factors and the financing of various forms of training and development of the labour force. Also among the stru-ctural funds is the EAFFG, which is primarily charged with agrarian policy, but wit-hin the context of structural policy is competent for evening out regional differences in agricultural production (the Guidance Department, as it is called). The ERDF, the ESF and the EAGGF are also called the traditional structural funds. The fourth stru-ctural fund is the Financial Instrument for Fisheries Guidance, FIFG, with jurisdi-ction for fisheries inside the EU.
The Cohesion Fund was founded for the additional needs to achieve social and econo-mic cohesion inside the EU. This is a financial mechanism of aid only to those mem-bers whose per capita GNI is less than 90%. Before the enlargement in 2004, such resources were received by Greece, Ireland, Portugal and Spain. Most of the resour-ces of the Cohesion Fund are channelled towards transport and environmental pro-tection. Unlike the Structural Funds, the resources of which are supplementary, the resources distributed from the Cohesion Fund are conditional. As soon as a member state passes the mean of 90% p.c. GNI of the Union as a whole, it no longer has the right to these resources (European Commission, 2004c).
The economic motivation can be seen in the aspiration for the maximally effective func-tioning of the economy. For the moment this is the main impulse for the limited redis-tribution of funds within the EU. But even such restricted transfers are able to lead to negative phenomena such as the increased dependence of the more poorly developed regions on EU budgetary resources or the problem of the moral hazard – the situation in which the adoption of given policies is primarily motivated by the likelihood of ob-taining certain financial resources, instead of by the desire for rapid economic develop-ment (Ardy, 2004:93-94).
As already stated, one of the yardsticks for measuring the redistributive effects of the EU budget is the level of net transfers received from the EU budget. This effect is restricted to the maximum amount of transfer that a given member country can receive (4% of GNI). There are also other yardsticks for measuring the redistributive effects of the budget, such as the level of unemployment or p.c. GNI, but these are not the subject of this analysis.
2.1 Net Budgetary Transfers
Every member state gives the budget of the EU a certain amount of its revenue, but also uses a certain amount of the expenditure of the EU budget. Table 5 shows the shares of given member countries in the revenue and expenditure of the EU budget. The largest resources are paid into the EU budget by Germany, then by France, Italy and the UK9.
Leading in budgetary expenditure, that is, in transfers from the EU budget, are Spain, Germany and France. Most of this expenditure relates to the CAP and to financing via the EU’s Structural Funds (European Court of Auditors, 2003).
Table 5 shows net transfers from the EU budget, consisting of the difference be-tween the amount of revenue (contributions) and expenditure (benefits) of a given member state into and from the EU Budget. As well as in Table 5, net budgetary trans-fers are also depicted in Figure 1, as a share in the total expenditure of the EU budg-et. Germany pays most into the EU budget, with as much as 6.1 billion euros, or in other words pays a net proportion of the budget of 7.7%. And in spite of its privileged position, the UK comes immediately after Germany in terms of net contributions to the EU budget, followed by Italy, Holland and France. Denmark, Luxembourg, Aus-tria and Finland have net transfers of less than 1%, meaning that their contribution to the EU budget is almost identical to the transfers they receive from it. Net beneficiar-ies of the EU budget are four of the least developed countrbeneficiar-ies in the EU (users of re-sources from the Cohesion Fund: Greece, Ireland, Portugal and Spain). Spain is par-ticularly prominent for the high transfers that it receives pursuant to the agricultural and structural policies.
Table 5: Revenue, expenditure and net transfers of the EU budget in 2002 (in million euros and in percentage
Member state Revenue Share in Expenditure Share in Difference
total total (net
revenue expenditure transfer)
(%) (%)
Belgium (B) 3 017 3.9 1 787 2.2 1 230
Denmark (DK) 1 656 2.1 1 417 1.8 238
Germany (D) 17 582 22.6 11 444 14.3 6 137
Greece (EL) 1 337 1.7 4 616 5.8 -3 279
Spain (E) 6 551 8.4 15 127 18.9 -8 575
France (F) 14 152 18.2 11 656 14.6 2 496
Ireland (IRL) 1 018 1.3 2 562 3.2 -1 544
Italy (I) 11 279 14.5 8 012 10.0 3 266
Luxembourg (L) 183 0.2 131 0.2 52
Netherlands (NL) 4 467 5.8 1 507 1.9 2 960
Austria (A) 1 840 2.4 1 525 1.9 315
Portugal (P) 1 187 1.5 3 839 4.8 -2 652
Finland (FIN) 1 184 1.5 1 167 1.5 17
Sweden (S) 2 086 2.7 1 191 1.5 894
UK 10 152 13.1 5 959 7.5 4 193
Total 77 698 100 79 932 100
Source: the author according to the European Court of Auditors (2003).
Figure 1: Net transfers from the EU budget in 2002 (in % of total expenditure of EU budget)
D UK I NL F B S A DK L FIN IRL P EL E
10
5
0
-5
-10
-15
Table 5 and Figure 1 show the uneven distribution of EU budgetary resources. Al-though the ultimate impact of such inequalities on the redistribution of income inside the EU is small, it nevertheless does exist and is to a certain extent intelligible as compared with the levels of income in the member states of the EU. Exceptions are found in Den-mark, Luxembourg and Belgium. The positive net transfers of the latter two countries can be justified by their hosting important EU institutions like the European Council and the European Council. Although we are dealing here with a limited amount of resources, the recent enlargement and all future enlargements will tend to aggravate this problem.
2.2 Redistribution and the Enlargement of the European Union
The EU Commission gave its views on the conditions of criteria that the transitional countries had to meet in order to become economically and political integrated parts of the EU in its Agenda 200010.
It was also stressed that the joining of new members would lead to numerous prob-lems, above all of a financial nature, in current and in future members, irrespective of the different levels of development in them (Agenda 2000, 1999).
It is a fact that enlargement will bring in its train much greater financial needs, be-cause the candidate countries are considerable behind the EU 15 countries in economic development. Enlargement is also expected to increase EU administrative costs, and also an augmented pressure on the expenditure side of the budget, particularly in the CAP seg-ment and the Structural Funds. Such a developseg-ment of events will have a particular effect on the redistribution of existing resources, because the Commission has stressed that the intention is to adhere to the restrictions according to which each member can receive at a maximum resources equivalent to 4% of its own GNI.11
At the Berlin Summit of 1999, at which time Agenda 2000 was adopted, certain meas-ures were agreed on to palliate the effects of enlargement in the structural redistribution policy segment. Still, the fact is that the nine new members that joined the EU in 2004 had in 1999 a per capita GDP that was only about 49% of the EU average. If the criteria that held for the members of the EU 15 were applied, the new members would greatly benefit from the resources of the Structural Funds, and hence would reduce the amounts previously received by the less developed members of the EU 15. Since the new mem-bers would have to contribution to the EU budget, according to some projects they would be capable of jointly financing only 25% of the resources that they would enjoy from the Cohesion Fund and the Structural Funds (Jašić, 2002).
In the CAP sector, still greater problems can be expected, because many members of the EU 15 have rural and mainly agrarian areas12. The accession of the transition
coun-10 These criteria relate to indicators of real trends in the economy, and of institutional, monetary and fiscal con-vergence.
11 There are many opinions that there was too optimistic an approach to the enlargement process and that the exi-sting resources will not be adequate to satisfy the appetites of all the member countries (Jašić, 2002; Harrop, 2004).
tries to the EU led to concerns among the EU 15 members for a number of reasons: (1) the transition country candidates had an incomparably greater agrarian weighting in their economies than the EU 15 members; (2) the prices of agricultural products were lower than in members of the EU 15; (3) on the accession of the new members, the agricultural land in the EU would increase by 50% (Jašić, 2002).
According to existing indicators it is hard to expect that the new and any future mem-bers will have the same treatment in the agricultural and structural policy that was received by the EU 15 members. The reason here is that some members of the EU 15 who have to date been net beneficiaries of budgetary resources would have to become net contribu-tors to the budget. The enlargement thus increases demands for changes in the EU budg-et (Seguiti, 2003; Begg, 2004).
In addition, enlargement is the greatest reason for resistance to change. How much EU 15 members are interested in retaining their privileges can be seen from the series of activities that they engaged in and are continuing to engage in before and after February 10 2004, when the Commission announced the proposal for the next financial perspec-tive, for the 2007-2013 period (European Commission, 2004a). This communiqué was only the official commencement of the battle of the member countries for positions in the EU budget that are as favourable as possible.
As far back as 2001, at the Nice Summit, it was agreed that the consensus of all mem-bers of the EU 15 should be the valid procedure in the making of decisions concerning structural financing issues. Then Spain, the greatest net beneficiary, managed to retain a veto during the making of decisions concerning the apportionment of resources for region-al development for the 2007-2013 period. Germany and France achieved an agreement in 2002 concerning limitations of their payments into the EU budget and rejecting any very radical reforms related to changes in resources for the CAP13. Then, in December 2003, six of the richer members of the EU (Austria, France, Germany, Holland, Sweden and the UK) addressed an open letter to the then president of the EU Commission, requiring that the size of the total EU budget still range around 1% of the GDP of the Union14.
According to the Commission’s proposal, the EU budget in the new financial perspec-tive for 2007-2013 (Agenda 2007) would not undergo any major changes. The number and names of the budgetary items would be reduced, but still the major resources would be earmarked for agricultural policy within the item Management and Preservation of Natural Resources. Another major expenditure would still be for structural operations, which would become a component part of the item Sustainable Development. These two items of the EU budget would still amount to more than 7% of EU budget expenditure. The size of the budget will be about the same, ranging around 1.15% of EU GNI (EU Budget, 2005d; European Commission, 2004b).
These Commission proposals, on which the new financial perspective and the futu-re futu-redistribution of the EU budgetary futu-resources wefutu-re supposed to be based, wefutu-re
influen-13 The first was required by Germany, which is the biggest net EU budget payer, and the second by France, one of the largest recipients of CAP resources.
ced by many pressures from the member states of the EU 15. It will be seen how much the new financial perspective will take into account objections addressed to the existing EU budgetary system. The financial perspective is based on an institutional agreement between the Council, the Parliament and the Commission, which has to be reached du-ring 2005 or 2006 at the latest.
It is to be expected that Agenda 2007 will not essentially deviate from the Commis-sion’s proposal, that is, from Agenda 2000. The reason for this is the previously men-tioned pressures from the older and richer members. Here it might be worth raising the key issue as to whether the new financial perspective will be “yet another missed opportunity”15 to shape the EU budget as the central fiscal instrument of the EU capa-ble of taking on greater functions and responsibilities within the existing economic and political opportunities.
3 Conclusion
The EU budget is a relatively small and yet essential instrument for the implementa-tion of fiscal policy from the central or supra-naimplementa-tional level of the EU. Because of politi-cal and constitutional limitations that exist in the EU, in its essential features it is essen-tially different from the classic budgets of the nation states. Because of the complexity of its vertical structure and because of political decision making concerning fiscal issues in the EU the redistribution of the limited resources is premised on the achievement of the maximum amount of economic and social cohesion within the EU.
From the very beginning, various modifications have been brought into the EU budg-etary system, mostly the results of political pressures from given individual member coun-tries. In addition, the enlargement of the EU, and other integration processes, tend to af-fect demands for changes inside the EU budget and create the need for a different distri-bution of resources for the sake of achieving the said cohesion among the countries. Apart from the actual enlargement, several additional demands arise in connection with the EU budget on the eve of the new financial perspective. Firstly, the usual parting of the ways among the countries that are net contributors and net recipients of the budget requires cer-tain changes. Secondly, there are cercer-tain contentious issues such as the UK rebate to some of the funds that are paid in by all members of the EU. Thirdly, there are differences of opinion about how the budget should be financed – via the existing system of transfers or by the introduction of a certain tax at the EU level.16
Irrespective of the justified needs for changes, the new financial perspective will prob-ably not lead to important changes in the EU budgetary system. The need for reform ex-isted even before the current financial perspective was adopted, not just because of the
15 The phrase “missed opportunity” was used by Begg (1999) when the existing financial perspective, Agenda 2000, was being passed, which indicates that the need for the reform of the budget of the EU of course existed even before the recent EU enlargement.
enlargement of 2004, the largest in the history of the Union to date. The needs for chang-es relate above all to a different or larger redistribution of limited budgetary rchang-esourcchang-es. Irrespective of the EU still being at an early phase of integration, which entails a smaller redistributive role for the central level, such an EU budget can still be a good instrument in bridging the economic and regional differences among the member countries and for achieving greater and stronger integration.
LITERATURE
Agenda 2000, 1999. “Interinstitutional Agreement of 6 May 1999 between the Eu-ropean Parlament, the Council and the Commission on budgetary discipline and impro-vement of the budgetary procedure”. Official Journal of the European Communities, C 173. Available from: [http://europa.eu.int/eur-lex/pri/en/oj/dat/1999/c_172/c_17219990-618en00010022.pdf].
Ardy, B., 2004. “The development of the EU Budget and EMU” in M. Baimbridge and P. Whyman, eds. Fiscal Federalism and European Economic Integration. London: Routledge, 83-100.
Begg, I., 1999. “Reshaping the EU Budget: Yet Another Missed Opportunity”. Policy Paper, 1/99. Available from: [http://www.one-europe.ac.uk/pdf/pol1.pdf].
Begg, I., 2004. “The EU Budget: Common Future or Stuck in the Past?”. Briefing Note. Available from: [http://www.cer.org.uk/pdf/briefing_budget_begg.pdf].
Cullis, J. and Jones, P., 1998.Public Finance and Public Choice. Oxford ; New York: Oxford University Press.
Đurđević, Z., 2004. “Proračun Europske Unije” [online]. Financijska teorija i pra-ksa, 28 (2), 181-202. Available from: [http://www.ijf.hr/financijska_praksa/PDF-2004/2-04/djurdjevic.pdf].
EU Budget, 2005a. Financial perspectives system [online]. Available from: [http:// www.europa.eu.int/scadplus/leg/en/lvb/l34012.htm].
EU Budget, 2005b. Own resources [online]. Available from: [http://www.europa. eu.int/scadplus/leg/en/s27000.htm#RESSOURCES].
EU Budget, 2005c. The Financial Regulation [online]. Available from: [http://www. europa.eu.int/scadplus/leg/en/s27000.htm#RESSOURCES].
EU Budget, 2005d. Towards a new financial framework 2007-2013 [online]. Availa-ble from: [http://www.europa.eu.int/scadplus/leg/en/lvb/l34004.htm].
European Commission, 2002a.European Union Public Finance [online]. Luxem-burg: European Communities.
European Commission, 2002b.Simulation of net budgetary positions after enlarge-ment of the N-10. DG Budget. Luxemburg: European Communities.
European Commission, 2004a., Building our common future: Financial and politi-cal outlook for the enlarged Union 2007-2013. IP/04/189, 10.02.2004 [online]. Available from: [http://europa.eu.int/rapid/pressReleasesAction.do?reference=IP/04/189&forma-t=HTML&aged=0&language=EN&guiLanguage=en].
European Commission, 2004b.General Budget of European Union for the Financi-al Year 2004. Brussels; Luxemburg. [online]. Available from: [http://europa.eu.int/comm/ budget/infos/publications_en.htm].
European Commission, 2004c.Report on Budgetary and Financial Management – Financial Year 2003 [online]. Available from: [http://europa.eu.int/comm/budget/infos/ publications_en.htm].
European Court of Auditors, 2003.Annual Report 2002 [online]. Luxemburg. Available from: [http://www.eca.eu.int/audit_reports/annual_reports/annual_reports_index_en.htm].
European Union Committee, 2005.Future Financing of the European Union: Re-port with evidence [online]. Available from: [http://www.publications.parliament.uk/pa/ ld200405/ldselect/ldeucom/62/62.pdf].
European Union, 2002.Financial Report 2001 [online]. Luxemburg: European Com-munities. Available from: [http://europa.eu.int/comm/budget/infos/publications_en.htm].
Harrop, J., 2004. “The development of EU budgetary measures and the rise of stru-ctural funding” in M. Baimbridge amd P. Whyman, eds. Fiscal Federalism and Europe-an Economic Integration. London: Routledge, 69-82.
Holmes, P., 1999. “The political economy of the European integration process” in D. A. Dyker, ed. The European Economy. New York: Addison Wesley Longman, 43-63.
IMF, 2004.Government Financial Statistics Yearbook. Washington: International Monetary Fund.
Jašić, Z., 1982.Budžet i privredni razvoj. Zagreb: Narodne novine : Ekonomski in-stitut.
Jašić, Z., 2002. “Financijski aspekti proširenja Europske unije.” Računovodstvo, re-vizija i financije, 12 (3), 120-126.
Jurković, P. i Jašić, Z., 1978.Uvod u teoriju ekonomske politike. Zagreb: Narodne novine.
Jurković, P., 1989.Fiskalna politika u ekonomskoj teoriji i praksi. Zagreb: Infor-mator.
Mihaljek, D., 1998. “Theory and Practice of Confederate Finances” in P. B. Sørensen, ed. Public Finance in a Changing World. Basingstoke: Palgrave Macmillan, 193-220.
Müller, D., 1989.Public choice II. Cambridge ; New York ; Melbourne: Cambridge University Press.
Musgrave, R. A., 1973.Teorija javnih finansija. Beograd: Naučna knjiga.
Oates, W. E., 1972.Fiscal federalism. New York: Harcourt Brace Jovanovic.
Peacock, A. and Shaw, G. K., 1976.The Economic Theory of Fiscal Policy. Lon-don: George Allen & Unwin Ltd.
Persson, T., Roland, G. and Tabellini, G., 1996. “The Theory of Fiscal Federa-lism: What Does it Mean for Europe?” Unpublished manuscrip, prepared for the confe-rence “Quo Vadis Europe?”. Kiel, June 1996. Available from: [ftp://ftp.igier.uni-bocco-ni.it/wp/1996/101.pdf].