Published online January 08, 2015 (http://www.sciencepublishinggroup.com/j/ijber) doi: 10.11648/j.ijber.20140306.17
ISSN: 2328-7543 (Print); ISSN: 2328-756X (Online)
Determinants of health care demand in Ghana using the
ordered probit model analysis
Bismark Osei
1, Mark Edem Kunawotor
1, *, Enock Anane
21
Department of Finance and Accounting, Zenith University College, Accra, Ghana 2
Department of Economics, KNUST, Kumasi, Ghana
Email address:
[email protected] (M. E. Kunawotor)
To cite this article:
Bismark Osei, Mark Edem Kunawotor, Enock Anane. Determinants of Health Care Demand in Ghana Using the Ordered Probit Model Analysis. International Journal of Business and Economics Research. Vol. 3, No. 6, 2014, pp. 259-265.
doi: 10.11648/j.ijber.20140306.17
Abstract:
The study examines the factors that determine health care demand of the people of Kwabre East District in the Ashanti Region of Ghana. Health behaviour model formulated by Anderson and Newman was adopted for the analysis with the help of Ordered Probit. The result of the study revealed that, the level of income, transportation cost, hospital cost and NHIS have positive signs, implying that as these factors increases, the utilization of health care facilities also increases. It was found out from the marginal effects results that, NHIS and transport cost have negative signs on the patient’s first visit to hospital whiles the level of income and hospital cost were insignificant.Keywords:
National Health Insurance Scheme (NHIS), Health care demand, Ordered Probit Model, Kwabre East District1. Introduction
Ranking as one of the most developed in the sub-region of Africa (Canagarajah and Ye, 2001), Ghana’s health sector boasts three teaching hospitals and a sizeable number of regional/district hospitals, clinics, and community health centres and posts. For a population of a little short of 25 million people, there are only 1,439 health care facilities (IRIN, 2008). A study by Van den Boom et al.,(2004) noted that access to these facilities remained a problem: Medical facilities were not evenly distributed across the country, with most rural areas lacking basic facilities such as hospitals and clinics as well as doctors and nurses.
Government programmes and expenditures geared towards the improvement of delivery and access to health care system have been enormous. Policies and programmes initiated also include the construction of new hospitals and polyclinics in remote and underserved districts. This is expected to improve and strengthened physical access to healthcare, particularly, to enhance access to comprehensive emergency obstetric care. The National Health Insurance Scheme introduced by the government in 2005 has improved financial access to healthcare for about half of the population according to the Ministry of Health.
Despite improvements in public health indicators, the
population of Ghana still suffers because of poor health status among high percentage of the entire population, especially in rural areas and success has been mixed when compared to health targets of the Medium Term Health Strategy. This however can be attributed to the deficiencies that affect the demand for health care (Asenso-Okyere et al, 2006). Therefore the general objective of this study is to examine the core determinants of health care demand in Ghana specifically, Kwabre East District.
2. Theoretical and Empirical Literature
Among the models relating to utilization of health services that are of interest to this study is the Newman and Andersen’s model (1973). Very frequently, investigators adapt the model to the peculiarities of their research field or study area, with the main aim to increase the repertoire of possible key factors affecting health care utilization rather than to achieve theoretical advancements.
policies to promote equitable access to healthcare (Andersen et al., 1995).
The Health Behaviour Model states that an individual’s use of health services is a function of his/her predisposition to use services, factors enabling or impeding use, and need for care. Predisposing factors include demographic characteristics such as age and gender; social structure, which has traditionally been measured using education, occupation, and ethnicity and can also include social networks and interaction and culture; and health beliefs, which are the attitudes, values, and knowledge that might influence use of health care services (Andersen et al., 1995)
There is a growing body of literature on developing countries analyzing the demand and choice of healthcare providers of individuals. Rimando(1970) suggests that income level, insurance coverage, education and belief of mothers, and demographic (age) and physiological (felt needs) characteristics of households have significant impact on demand for some types of health services. On the other hand, Paqueo (1977) found that the type of residence has a very large effect on healthcare demand, with rural households mainly at a disadvantage.
The study on sick children revealed the influence of distance, income level, mother’s education, and time costs on healthcare demand (Akinet. al., 1981).Interestingly, the study arrived at different finding: economic variables such as income, cash, and time costs were not important determinants of the choice of health services. The authors suggest that poverty and costs have very little to do with failure to use existing health care facilities and services. Instead, non-economic factors such as education and perceived seriousness of illness played stronger roles in determining use patterns.
Sahnet al., (1993) found in Kenya that a 10% increase in the price of public health services reduces demand by only 1.0% point while a 10% increase in the price of private health services would reduce demand in private hospitals by 15.7% points and 19.4% points in private clinics. This suggests that increased user fees could generate additional revenue for the public sector without any significant reduction in demand.
Asenso-Okyere (1995) has found in Ghana that the user charges introduced as a cost-sharing measure have resulted in an average of less than 10% cost recovery and a drastic drop in attendance at health facilities, especially in rural areas. A similar finding reported in Asenso-Okyereet al., (1998) shows that cost recovery measures in Ghana have led to a switch towards self-medication and other behaviours aimed at cost saving.
Sahnet al., (2003) estimated demand for health care in rural Tanzania and found that a rise in the price of public healthcare leads to a substantial substitution into private health services. Doubling the price of public clinics or public hospitals resulted in a decline in the probability of their use by 10% while doubling the price of private clinics was accompanied by a large increase in the use of public clinics.
A research done by Trivedyet al., (2009) found that the
coefficient of net income on health care demand was statistically significant, both across sample and provider, relative to no-care option as expected. The significance of net income implies that cost of care and income, both of which enter the model via the net income function are also significant, hence are important determinants of health care. As for individual characteristics, no statistically significant gender differences are observed at all conventional significance levels. This is consistent with the descriptive statistics which indicates no significant difference between male and female health seeking behaviour.
Female headed households however have significantly lower probability of seeking healthcare relative to male headed households, except for the children sample. Age has a negative and significant effect on the probability of seeking care, relative to children under 5 years, both across options and across samples. In the adult model, elderly people have a lower probability to seek care compare with 15 – 21 year group. Trivedyet al., (2009) found out that the level of education positively affects the probability of seeking health care, though there is no significant difference between being a primary graduate and no education (Trivedy et al, 2009).
A research done by Glick and Razakamanantsoa (2005) reveal that particularly the poor have dropped health care utilization drastically after the introduction of the ‘Cash and Carry’ system, although public health services are still progressive. This could occur if for example, the poor has reduced their utilization of public health services while the rich has on the other hand substituted public care for private care. The fact that basic care is more progressive than hospital care reflects the urban location of hospitals. These results are in agreement with previous findings on Ghana (Demeryet al., 1995; Canagarajah and Ye, 2001).
Ching (1996) also found that economic factors are not significant. However, after dealing with multi-collinearity and other econometric problems, she obtained a number of significant economic factors mostly cross prices. This indicates the interdependence of various health facilities which are organized into a referral system and constitute a competitive network. Nevertheless, the results of the latter study do not invalidate the findings of Akin et al.,(1981) that poverty and costs have very little to do with failure to use existing health care facilities and services.Moreover, previous studies have found that the magnitude of the price effect on demand for health care is very small. Specifically, low price elasticity is more pronounced among the public healthcare providers than the private providers.
3. Methodology of the Study
in temporary medical examination centres.
The secondary data from District Assembly and the District Hospital, District directorate, health centers, Ministry of Health (MoH), the Ministry of Local Government and the Ghana Health Service on health care related issues were reviewed. In addition statistical data from Ghana Statistical Service and the World Health Organization (WHO), among others available literature gathered from books, websites and internal records were used, reviewed and analyze.The collected data was analyzed using the Statistical Package of Stata and SPSS.
4. Model Specification
The study used the robustness of ordered probit model and probe out of multicollinearity and heteroscedasticity for unbiased estimates of the variables through the test of correlation coefficient matrix and Spearman’s rank correlation test respectively.
The conceptual design of the study was derived from the Andersen-Newman model of health care utilization. This behavioural model proposed that the use of health care services is a function of three sets of individual characteristics: predisposing characteristics, enabling characteristics and need characteristics. However, another factor which is community characteristics. Henceforth, the formulation of our mathematical model in the spirit of Anderson and Newman (Anderson and Newman 1973) can be illustrated us;
y= + + + + | ~ 0,1 (1)
The ordered probit model assumes that the demand for health care/utilization is based on a latent variable ‘y’ which in this study is the number of visits to the hospital and it is specified as a linear function of explanatory variables. Where Xi is a vector of predisposing factors; Ei is a vector of enabling factors; Ni is a vector of need factors, Ci is a vector of community factors; β, δ, λ, and θ are parameters to be estimated; and Ɛtis the error term measuring unobserved heterogeneity in the model. As ycrosses a series of increasing unknown thresholds we move up the ordering of alternatives. For instance, as the value of ‘y’ increases from 0 to 4 it depicts an increase in health care utilization. In the analysis, enabling factors (level of income, transportation cost, hospital cost and NHIS) were the focus of the analysis.
The probability of choosing alternative j (visit 0->4) is defined as:
= = < ∗ < !; −$ = %< <
&< ⋯ < = $, ( 1,2,3, … , (2)
Where kj’s are threshold parameters to be estimated. The probability of choosing a visit type (y= j) is equal to;
= = - − ./, ! − −
0! (3)
Where θ is the cumulative standard normal distribution function. The effect of the regressors on the probability of the
jthvisit is given by
123 45
106 = 7 - −
./, ! − −
0!8 (4)
The ordered probit model is estimated using the maximum likelihood method (Greene, 2002). The ordered probit model was further used to generate the actual probabilities of representative household I choosing a particular visit j (Greene 2002). The actual probabilities thus involve estimating the probabilities of each household for each possible visit.
5. Discussion of the Results of the Study
5.1. Multicollinearity and Heteroscedasticity Test
There is multicollinearity when two or more independent variables have a linear relationship, or correlation, with one another. There are two important consequences associated with multicollinearity. First standard error of the coefficient would be very large thus, increasing the probability of type two errors (failing to reject the false null hypothesis). Secondary the most important consequence of perfect multicollinearity is that the ordinary least squares method of estimation will not run. Multicollinearity and heteroscedasticity test were carried for the test with the use of ordered probit.
A correlation coefficient matrix is usually used to show (multicollinearity) between independent variables. With absolute values greater |0.50 | on the correlation matrix, multicollinearity is present. Sensing the possibility of some correlation between the individual explanatory variables, we tested the model for multicollinearity and found no indication of significant problems in this area for the model.
To ensure stochastic assumption of the variance and stationary of the error term, the authors tested for heteroscedasticity which is a common problem when undertaking cross-sectional studies. The existence of heteroscedasticity means the assumption of homoscedasticity or constant variance of the error term is violated. Several consequences are the result of heteroscedasticity. When heteroscedasticity occurs, the ordinary least square estimator of the error is no more efficient.
In testing for heteroscedasticity, the spearman’s rank correlation test depicted in the appendix (table 1) was applied at 5% significance level. The results show that there is no evidence of heteroscedasticity. The star (*) attached to the value of a variable on correlation table test of heteroscedasticity indicate that there is statistical significance relation between the variables correlated and thus they are devoid of heteroscedasticity.
The two fundamental points to note under multicollinearity is a question of degree not of kind and is a feature of a sample.
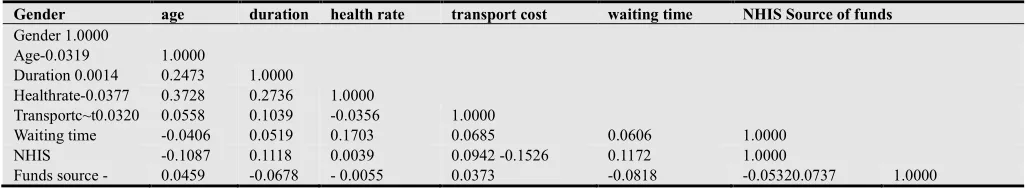
The consequences of multicollinearity is that the variance of the disturbances becomes very large, the values of the parameters become inaccurate and unstable with respect to signs and sizes and the coefficients become very sensitive to addition and deletion of observations to and from sample size. With absolute values greater than |0.5| on the correlation matrix, multicollinearity is present. Sensing the possibility of some correlation between the individual explanatory variables, the study tested the model and found that the highest value from the result is 0.378showingno indication of higher degree for multicollinearity between the explanatory variables asshown in the appendix (table 2).
5.2. Estimated HealthCare Demand Model
The results from the ordered probit model for household healthcare utilization are present in Table 1 below. All these factors (income, transportation cost, hospital cost and NHIS) were estimated to reveal the degree of their influence respondents reported for making healthcare visit(s) or utilization. The dependent variable was measured on a 0-5 scale, where 0=no visit, 1 = one visit, 2 = two visits, 3 = three visits, 4 = four visits and 5 = more than four visits. Independent variables include level of income, NHIS, hospital cost and transportation cost. It is expected that the number of visits will be greater for those with health insurance, higher income, and access to transportation. It is also expected as cost of treatment reduces, patients visit to healthcare centres will increase.With these set of variables, only insurance variable enter the model as dummy.
Table 1. Results from the Ordered Probit Model
Explanatory variables Coefficient Std. Error P>|z|
Enabling Factors
Income 0.0007045 0.0003775 0.062
Distance 0.0609652 0.0550613 0.268
Distance time -0.0123378 0.0070606 0.081
Transport Cost 0.614192 0.2016693 0.002
Easy Transport 0.1026429 0.0844035 0.224
Waiting time 0.1529611 0.0470395 0.001
Hospital Cost 0.000101 0.0015658 0.949
NHIS 0.6489726 0.1411331 0.000
Healthcare finance 0.1883905 0.524096 0.000
/cut 1 2.586608 0.672775 0.000
/cut 2 3.5222727 0.6785221 0.000
/cut 3 4.096784 0.6815288 0.000
/cut 4 4.691759 0.6858104 0.000
Significant at 5% Prob>chi2 = 0.0000
Statistics such as the pseudo R2 cannot be computed from survey data since it is based on the likelihood ratio (LR) which is inapplicable with survey data. The pseudo R2 and the maximum likelihood estimations are based on the assumption that observations are identical and independently distributed (iid).
From table 1, the significant variables were transport cost, waiting time, NHIS and Healthcare finance. Transport cost and NHIS which are part of our variables of interest were found to be significant while the level of income and hospital
cost appeared to be not significant. The coefficients of NHIS, hospital cost, transport cost and level of income are all positive as well indicating that utilization of health care increases as such factors also increases. The positive coefficients of hospital cost and transport cost is not consistent with theory although significant.In order to determine and elaborate the specific significant factors that explain healthcare utilization, we predict the marginal effects from the ordered probit model.These are presented in Table 2 below.
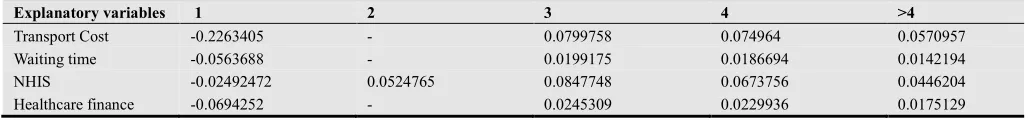
Table 2. Marginal effects of the Ordered Probit Model
Explanatory variables 1 2 3 4 >4
Transport Cost -0.2263405 - 0.0799758 0.074964 0.0570957
Waiting time -0.0563688 - 0.0199175 0.0186694 0.0142194
NHIS -0.02492472 0.0524765 0.0847748 0.0673756 0.0446204
Healthcare finance -0.0694252 - 0.0245309 0.0229936 0.0175129
Note: Only significant marginal impacts are reported.
The regression analysis from Table 2 shows marginal effects for only the significant variables of making healthcare visit. Table 2 forecasts variables that are statistically significantly and their effect are interpreted below. Out of the seven significant variables, only three variables (Health status, transport cost, waiting time) had their expected signs.
transportation cost make less routine healthcare visits. That is respondents are 22.6 percentage points less likely to make one number of healthcare visit when transportation cost increase by a pesewa to avoid emergency healthcare trip. Its marginal impact (22.6%) is significantly greater and had its expected sign for the first visit. Thus it is 0.2 probable that respondents are not likely to make one visit when transportation cost increase by a pesewa.
However transportation had no marginal impact for the second visit. For the third visit, the result shows that respondents are 8 percentage points more likely to make three numbers of healthcare visits when even transportation cost increase by a pesewa. Its marginal impact (8%) is statistically significant with unexpected positive sign. Thus it is 0.08 probabilities that respondents are more likely to make three healthcare visits when transportation cost increase by a pesewa. The result also shows that respondents are 5.7 percentage points more likely to make four times health care visits when even transportation cost increase by a pesewa to avoid any accidental healthcare trip. Its marginal impact (5.7%) is statistically significant. This factor had the highest impact or influence on a person usage of health care for four times within a year.
In addition from the results obtained respondents are 5.7 percentage points more likely to make more than four health care visits when even transportation cost increase by a pesewa to avoid emergency healthcare trip. Its marginal impact (5.7%) is statistically significant. Thus it is 0.05 probable that respondents are more likely to make more than four health care visits when transportation cost increase by a pesewa. Again this factor had the highest impact or influence on a person usage of health care more than four times within a year. Other enabling factors were found to significantly influence health care visits.
Insurance coverage was found to significantly influence healthcare usage but with unexpected negative sign for the one visit, as those with coverage were substantially less likely to make one heathcare visit by a propensity of 2.5 percentage points than those without coverage. The results suggest that those with insurance (NHIS) were not likely to take one visit. Either a respondent make more than one visit or not at all. Majority of the respondents recognize the scheme as offering them financial protection against catastrophic health payments at the time of ill-health rather than as a response to facing a health problem.
Only insurance coverage was found to significantly influence health care usage for the two visits with it expected positive sign. Thus, as those with coverage were substantially more likely to make two heath care visits by a propensity of 5.2 percentage points than those without coverage. The results suggest that those with insurance (NHIS) were likely to take two visit at a probability of 0.1. This factor only had the highest impact or influence on a person usage of health care twice within a year. To add, insurance coverage was again found to significantly influence healthcare usage with expected positive sign for the third visit, as those with coverage were substantially more likely to make three
routine heath visits by a propensity of 8.5% than those without coverage.
The results suggest that those with insurance (NHIS) were more likely to take more visits. This factor had the highest impact or influence on a person usage of healthcare thrice within a year. For the fourth visit, Insurance coverage again was found to significantly influence health care usage with expected positive sign, as those with coverage were substantially more likely to make four routine heath visits by a propensity of 6.7% points than those without coverage. The results suggest that those with insurance (NHIS) were more likely to take more visits. Moreover, insurance coverage was found to significantly influence healthcare usage with expected positive sign for healthcare visits more than four, as those with coverage were substantially more likely to make more than four routine heath visits by a propensity of 4.5% points than those without coverage. The results suggest that those with insurance (NHIS) were more likely to take more routine health care visits.
No significant relationship was found between healthcare usage and these variables (income and hospital cost). None of these variables significantly influence healthcare demand measured by the number of visits, suggesting that these factors does not affect people of Kwabre East district utilization of healthcare facility regardless of their number of visits to the health centres.
6. Policy Implications and Conclusion
As the ability to measure the impact of various model components improves, we suggest the results might be used to operationalize the increasingly health facilities public policy goal vaguely to ensure “easy access and equitable distribution of health care services. The collaboration of policy makers including Ghana Health Service, Ministry of Health and the government should provide at least a health facility in every community to abate the pressure on the available health facilities in the district especially the district hospital at Asonomaso to increase access and usage and the country as a whole.
The purchase of drugs from drug store remains the important type of treatment for the district and Ghana as a whole. If hospitals are therefore close to the people it will solve the problem of self-medication. If there can therefore be a widespread hospitals, this will reduce the unprescribed self-medication. Ghana focusing on improving upon the lower middle income, the provision of timely and affordable healthcare for all remains a formidable challenge. One policy implication is to put more emphasis on the quality of self-medication, say through certification and by training of chemical sellers, traditional healers, unsupervised druggist, and medicine peddlers. Specifically training, orientation and workshop must be organized for drug sellers who sell drugs commonly sold without prescription.
have proper refuse dump site; the refuge is not removed regularly leading to the breading of mosquitoes. Not surprisingly, malaria is leading symptoms of disease in the district. Most communities were characterized by poor toilet facilities and drainage channels and unsanitary conditions.
The District assembly and community stake holders (chiefs, elders, and local community board) should provide a proper site for refuse dumping and dustbins and these wastes should remove or cleared regularly to avoid breading of mosquitoes. In addition there should be the provision of hygienic public toilet facilities at various parts of the communities. Although most communities were having good treated drinking water, but few communities are still trap in unhygienic drinking water. Provision of good source drinking water should be made to theses few communities by policy makers who are supposed to provide them.
The study shows that few people patronize treatment from traditional medicine and spiritual sources popularly known as ‘prayer camps’. The Christian Council of Ghana should register all these ‘prayer camps’ so as to able to streamline and control their activities.There should be policies to streamline the activities of the association of traditional medical practitioners (TMPs). Policies should encourage more studies into the practices of TMPs to facilitate the documentation of the concepts and practices of traditional medicine. Lastly, opportunity should be created for better collaboration between the traditional practitioners and orthodox practitioners. Patients are entreated to seek from qualified health agencies and not to involve in self-medication.
The study reveals that, the NHIS has improved access to healthcare services to different category of people the Kwabre East District by removing significant financial barriers to access. Thus, the scheme has potentially reduced out-of-pocket payments at the point of service use. The NHIS has improved and increase access to modern health care services and likelihood of delivery at a health facility and being assisted by trained health personnel. The researcher suggest that increasing access and coverage to the National Health Insurance Scheme and removal of geographical barriers to health care will promote better health and overall health outcomes for the people in the district and Ghana as a whole.
It is recommended thatgreater awareness on the benefits of the scheme especially among the largely informal sector and
purposeful targeting of the core poor will help improve on the coverage and membership of the scheme should be endorsed by policy makers. More client-oriented community education on the benefits of the scheme and membership registration at community durbars, major market days be undertaken to improve access and coverage.
The study also recommends registering the informal sector through existing groups and associations in which premium could be paid on installment basis through them. This calls for strengthening of the exemption policy especially for the poor and vulnerable to ensure equity in access to health services which is one of the mandates of the NHIS (NDPC, 2009). There is the need to take a critical look at expanding geographical access to quality health care in the rural areas in order to achieve universal coverage. There is also the need to establish permanent and functional structures of arbitration to constantly engage the scheme management, healthcare providers and subscribers in order to minimize the mistrust and improve uptake and service delivery.
For instance, access to NHIS has a significant influence on the use of maternal and child care services in the district and has the potential to improve the attainment of MDGs 4 and 5 as insured women are more likely to deliver at a health facility and supervised by a trained health personnel and pay less than the non-insured.
Apart from that other obstacles affecting are institutional and operational challenges including: delays in the registration process and issuance of identity cards, registration centre far away and lack of trust in the organizers of the scheme. Trust in the integrity and competence of managers of the scheme. These bottlenecks, when addressed can help improve the coverage and membership of the scheme. The scheme in the district adheres to the minimum benefit package in the insurance law with respondents benefiting from wide range of services. Barriers to use cause differences which calls for a policy designed to spread health care services. An implicit assumption of a public policy for equitable distribution is that it increases accessand ultimately results in an improvement in the general health status of the population.
Health of every nation is paramount to achieving higher economic growth; therefore the government of Ghana and stakeholders in health should give premium attention to policy implications to ensure that demand for health care facilities is set up.
Table 3. The Spearman’s Rank Correlation Test for Heterocedasticity
Visits gender age duration health~etransp~twaitin~e NHIS health~d
Visits 1.0000
Gender -0.1224* 1.0000
Age 0.2645* -0.0064 1.0000
Duration0.1820* 0.0195 0.1942* 1.0000
Healthrate0.2349* -0.0434 0.3335* 0.2243* 1.0000
Transportc~t0.0879*0.0173 0.0807 0.0909* -0.0610 1.0000
Waiting time 0.1858* -0.0466 0.0720 0.0 534 0.0835 0.0365 1.0000
NHIS 0.2261* - 0.1087* 0.0977* 0.0073 0.0900* -0.1193* 0.1450* 1.0000
Health expend 0.1217* -0.0457 0.1806* 0.0270 0.0274 -0.0512 0.0666 0.0744 s .0000
Table 4. Correlation Coefficient Matrix Test ForMulticollinearity
Gender age duration health rate transport cost waiting time NHIS Source of funds
Gender 1.0000
Age-0.0319 1.0000
Duration 0.0014 0.2473 1.0000
Healthrate-0.0377 0.3728 0.2736 1.0000
Transportc~t0.0320 0.0558 0.1039 -0.0356 1.0000
Waiting time -0.0406 0.0519 0.1703 0.0685 0.0606 1.0000
NHIS -0.1087 0.1118 0.0039 0.0942 -0.1526 0.1172 1.0000
Funds source - 0.0459 -0.0678 - 0.0055 0.0373 -0.0818 -0.05320.0737 1.0000
Correlate gender, age, duration, health status, transport cost, waiting time, NHIS, health finance (Observation =500)
References
[1] Akin, J .S., Guilkey, D.K and Denton, E.H( 1981) “Quality of Services and Demand for Health Care in Nigeria”Social Science Medicine. 1981 Jun;40(11):1527-37.
[2] Asenso,O. (1995): “Financing health care in Ghana”, World Health Forum, 1995; 16(1):86-91
[3] Arcury, P. (2005): Public spending onhealth care in Africa: do the poor benefit?Bulletin of the World Health Organization, 2005, 78(1). [4] Canagarajah, A and Xiao Ye (2001) ‘Public Health and
Education Spending in Ghana in 1992-98.Quarterly Journal of Economics 106 (2), 407–443.
[5] Ching, A and Stephen, F(1996): “Cost Recovery,Health Policy and Planning in Ghana”.Econometrica, 1996 , 44 : 249 - 256 [6] Demery, L (1995): ‘Benefit incidence. A practitioner’s Guide,’
Poverty and Social Development Group, Africa Region, The World Bank.
[7] Ghana Statistical Service (2007) ‘Pattern and Trends of Poverty in Ghana: 1991-2006’.
[8] Glick, P and Razakamanantsoa, M (2005) ‘The Distribution of Education and Health Services in Madagascar over the 1990s: Increasing Progressivity in an Era of Low Growth; Journal of African Economies, Vol. 15, pp399-433.
[9] Mattson, J (2010): “Public Expenditure in Malaysia: Who Benefits and Why?The World Bank, Oxford University Press, New York.
[10] William,G(2002). "Convenient estimators for the panel probit model: Further results," Working Papers, New York University, Leonard N. Stern School of Economics.
[11] Sahn, D., Stephen, Y and Garance, G (1993): The Demand for
Health Care Services in Rural Tanzania, Oxford Bulletin of Economics and Statistics, 62 (2): 0305-9049
[12] Paqueo, A (1977); Incidence of Social Spending in Ghana.’ PSP Discussion Papers Series No. 82, Poverty and Social Policy Department, The World Bank (November).
[13] Rimando, L (1970) ‘Gender and Public Social Spending Disaggregating Benefit Incidence, Poverty and Social Policy Department; World Bank.
[14] Sahn, D and Stephen, Y (2003)‘ Estimating the Incidence of Indirect Taxes in Developing Countries’ .The World Bank, Washington, DC.
[15] Societal and Individual Determinants of Medical Care Utilization in the United States (Andersen &Newman 1973 and Wolinsky, 1988b))
[16] Transport, Distance, and Health Care Utilization for Older Adults in Rural and Small Urban Areas (Jeremy Mattson, North Dakota state University, Fargo; December 2010). [17] The National Health Insurance Scheme in Ghana: Prospects
and challenges: a Cross-Sectional Evidence; Freeman F.K. Gobah and Zhang Liang; March 15, 2011).
[18] Trivedy, S and Marcelo, J (2009): “Who Benefits from Government Expenditures? A Case Study of Colombia”, Oxford University Press, New York, 1979
[19] Van, D. B., Valentina, M andNsowah, N(2004),“Health-care Provision and Self-medication in Ghana” Institute of Statistical, Social and Economic Research, ISSER, University of Ghana, Legon, Ghana; SOW-VU, Amsterdam, The Netherlands.
[20] World Health Organization, WHO Database, 19 September 2008 and GHS annual report 2011; Ghana.