Volume 2011, Article ID 412647,13pages doi:10.1155/2011/412647
Research Article
Fingerprint Smear Detection Based on
Subband Feature Representation
Xiukun Yang
College of Information and Communication, Harbin Engineering University, Harbin 150001, China
Correspondence should be addressed to Xiukun Yang,yangxiukun@hrbeu.edu.cn
Received 5 July 2010; Revised 17 January 2011; Accepted 11 February 2011
Academic Editor: A. Enis Cetin
Copyright © 2011 Xiukun Yang. This is an open access article distributed under the Creative Commons Attribution License, which permits unrestricted use, distribution, and reproduction in any medium, provided the original work is properly cited.
Fingerprint smear detection has become a challenging issue due to the erratic texture of the smear tissue and its similarity to normal finger area. This paper presents a novel fingerprint image smear detection approach integrating symmetric wavelet transform (SWT), gray level co-occurrence matrix, and DCT. A feature extraction algorithm is first proposed by utilizing SWT to decompose each fingerprint and characterizing local texture features of defective finger tissue with the SWT coefficients in subbands 4∼19. Concurrence matrix-based texture features are incorporated into the feature vector to further improve the texture classification sensitivity. The concatenated feature vector is then fed into a pretrained genetic neural network classifier, which identifies smears by labeling fingerprint subblocks into different categories. Finally, DCT decomposition is used to detect abnormalities in fingerprint images containing small smear areas and abrupt breakages. Experimental results indicate that the hybrid method can effectively identify various types of fingerprint smears.
1. Introduction
Fingerprint identification has long been used as a key biometric technique in many criminal and civil applications such as crime investigation, physical access control, background check, information system security, and customs
and immigration, with a very high level of confidence [1–4].
In recent years, Live Scan systems offer a new dimension
in electronic capture of high-resolution digital fingerprint
images [5]. Because the live scan process requires no ink and
uses advanced electronics to ensure accurate image capture, relatively better quality fingerprint images can be acquired than with traditional inked fingerprint methods. Plus, multiple records can be generated from a single fingerprint capture and then transmitted directly to an Automatic Fingerprint Identification System or remote identification
bureau for faster processing [6, 7]. After the fingerprint
images are captured, an automatic quality control process is used to determine the quality of each image. Image Quality
Assurance calculation during capture is supposed to offer
visual and audible feedback to the operator without slowing down the booking process. Images that fail to meet the
standard must be either rescanned or annotated [8].
For most biometric applications, fingerprint quality has
a clear effect on matcher accuracy [9–12]. When scanning
rolled fingerprints, the finger’s occasional slipping could cre-ate some defective tissue featuring fictitious ridge patterns,
thereafter called “smear”, as shown inFigure 1. While
unin-tentional slippage is unavoidable, failure to detect smears in
fingerprint images can seriously affect the performance of
Live Scan systems by causing mismatch and false rejection.
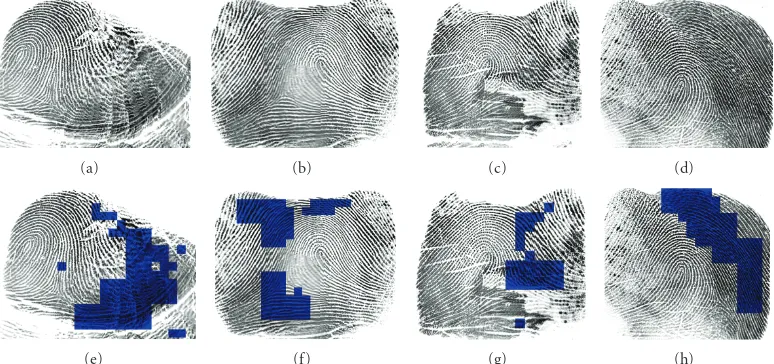
The major difficulty of fingerprint smear detection
lies in the great similarity between real smear areas and
relatively poor quality finger areas. Figures2(a)and2(b)are
considered to be simply bad quality finger areas because the
ridges are not clearly separated, while Figures2(e)and2(f)
are supposed to be identified as smears. Another challenge is
that some smear areas such as Figures2(g)and2(h)also have
well-cut ridges and good contrast, which highly resemble the
normal image tissues such as Figures 2(c) and 2(d). Due
to the erratic texture of the defective tissue and its great similarity to normal fingerprint area in multiple aspects, conventional fingerprint quality evaluation algorithms are
not capable of differentiating smear areas effectively from
(a) (b)
Figure1: Defective fingerprint images with smears.
(a) (b) (c) (d)
(e) (f) (g) (h)
Figure2: Smear identification challenges. (a)–(d) normal tissues and (e)–(h) defective tissues.
evaluation [13]. In August 2004, NIST issued the Fingerprint
Image Quality (NFIQ) algorithm as part of the NIST
Biometric Image Software [14], which generates the quality
map by measuring the quality of localized regions according to the ridge directional flow, regions of low contrast, low ridge flow, and high curvature. The information in these blocks is then integrated into one quality map containing 5 levels of quality (4 being the highest and 0 being the
lowest). Wu et al. [15] proposed limited ring-wedge spectral
measure to estimate the global fingerprint image features, and inhomogeneity with directional contrast to estimate
local fingerprint image features. Uchida [16] computes a
spatial changing pattern of gray level profile along with the frequency pattern of the images for feature extraction and classifies fingerprint images into two categories. Zhao et al.
[17] discussed the influence to fingerprint quality from the
range of gray-scale, dry, wet to deflection. Chen et al. [18]
used the FFT power spectrum to generate fingerprint quality indices in the frequency and measures the coherence in local regions as quality indices in the spatial domain. Shen
et al. [19] computed a bank of Gabor filter responses for
each image block and determined the image quality with the standard deviations of all the Gabor responses. Lim et
al. [20] calculated the local orientation certainty level using
due to the resemblance of smear tissue to the good-quality finger blocks in terms of ridge clarity, orientation flow as well as some FFT-based frequency domain features. Fingerprint image quality evaluation methods used in most fingerprint systems, such as the open source NFIQ (NIST Fingerprint
Image Quality) software [14], can be useful in detecting
smear fingerprints if the smear areas happen to contain low contrast blocks, high curvature ridge flow, or weak ridge and valley structures. However, many of the smear fingerprint images may not necessarily be of poor quality or contain
low contrast ridges (see Figures2(g)and2(h)). The existing
quality analysis approaches proposed by the above research works were not aimed at solving the problem of smear detection. The goal of this paper is to introduce the problem of fingerprint smear and to develop appropriate algorithms to identify smear automatically.
To address the smear issue, we need to not only detect fingerprint images containing defective areas, but also accurately identify and label the specific defective pixels within these images, so that the operator can be informed promptly about a defective image and re-enroll fingerprint if necessary.
Due to the unpredictable causes of smear in fingerprint scanning as well as the texture varieties in fingerprint images, smear identification falls into a tough image texture classification problem. Among a wide variety of image processing techniques, texture analysis has been intensively used to classify, detect, or segment images based on intrinsic properties such as roughness, granulation, and regularity
[21]. Traditionally, fixed transforms like Fourier, Haar,
Cosine, Sine, and co-occurrence matrix [22] are used in
image texture analysis. In recent years, there has been a growing interest in the application of wavelet transform to a broad range of signal and image processing applications
[23–25]. Arivazhagan and Ganesan [26] compared the
texture classification performance using a combination of wavelet statistical features and co-occurrence features of
wavelet transformed images with different feature databases.
Sebe and Lew [27] investigated the problem of texture
classification by taking into account the texture model, noise distribution, and interdependence of texture features. Livens
et al. [28] elaborated texture analysis and image classification
based on discrete and continuous wavelet decompositions. For many natural signals, the wavelet transform proves to be
a more effective tool than the Fourier transform, especially
in terms of representing specific texture features unique to
different tissues, because the wavelet transform provides a
multiresolution representation using a set of analyzing
func-tions that are dilafunc-tions and translafunc-tions of a few wavelets [25].
Every transform algorithm and selection of filter banks or texture features proposed by the above papers is optimal for the specific class of inputs studied in its respective field. However, in this case of fingerprint smear identification, not a single fixed transform or filtering-based technique provides satisfactory solution for the range of possible inputs generated by variable defective fingerprint tissues. The
accurate differentiation of fingerprint smear from normal
tissue is difficult due to the small interclass variability and the
large intraclass variability in fingerprint patterns. Moreover,
Figure3: Visualization of SWT decomposition.
fingerprint images often contain a large amount of noise and distortion, which makes the classification task even more
difficult. There are many ambiguous fingerprints whose
exclusive membership cannot be reliably stated even by human experts.
In this paper, we present a novel hybrid method inte-grating SWT, co-occurrence matrix, and DCT to achieve the accurate detection of unacceptable smears in scanned rolled fingerprints. One of the key advantages of our approach in smear detection lies in the fact that our hybrid method
effectively integrates the capability of certain parameters
generated from SWT & GLCM in characterizing large smear tissue with the potential of some DCT-based features in
differentiating small and sharp smear tissue from normal
finger areas. Furthermore, the SWT & GLCM combined with DCT proposed by this research successfully compensate each other in capturing both the critical higher-frequency com-ponents in smear areas and characterizing the unique lower frequency smear feature patterns, which are both essential in accurate smear detection. By assuring the quality of captured images and eliminating severely damaged fingerprints, the performance of Live Scan system can be further improved.
This paper is organized as follows:Section 2introduces the
proposed texture feature extraction algorithms based on
SWT, GLCM, and DCT, respectively.Section 3describes the
fingerprint smear detection and presents implementation
details as well as experimental results. Finally, Section 4
concludes the paper.
2. Feature Extraction
Since smear identification falls into a difficult texture
classification problem, the effective representation of texture
features for fingerprint smear is a critical step in separating defective finger tissues from normal ones.
2.1. SWT-Based Subband Decomposition. The wavelet trans-form decomposition scheme used in this study is consistent with the symmetric wavelet transform (SWT) used in the first-generation FBI standard Wavelet-Scalar Quantization
(WSQ) fingerprint compression [29–31]. In the SWT step,
(a) (b) (c) (d)
(e) (f) (g) (h)
Figure4: Defective tissue versus normal tissue. (a)–(d) defective tissues and (e)–(h) normal tissues.
The analysis filter bank is cascaded several times until it decomposes the image into the desired 64 spatial frequency
subbands.Figure 3is a visualization of the SWT
decomposi-tion process.
To obtain features reflecting differences between smear
area and normal finger tissue, the subband energies and
mean values of the SWT coefficients are computed and then
normalized to characterize local texture properties. These
wavelet signatures (ei and mi) reflect the distribution of
energy along the frequency domain.
ei=
Esum−energyi
Esum
, whereEsum=
19
i=4
energyi,
mi= (Msum−meani )
meani
, whereMsum=
19
i=4
meani.
(1)
By analyzing and experimenting with a large variety of
nonoverlapping fingerprint subimages of size 90×90, we
found that the energy signatures as well as mean values of
wavelet-coefficients from the subband range of 4∼19 contain
most critical information in differentiating defective smear
texture from normal finger ridge texture. Figure 5
demon-strates the discriminatory power of subband energy/mean
signatures in differentiating typical smears in Figure 4(b)
from normal finger areas in Figure 4(f). These signatures
prove to be effective feature parameters to characterize
defective smear tissue and classify different finger textures
according to natural frequencies of finger ridges.
However, these parameters are not always sensitive enough to discriminate some particular types of smears with higher frequency texture patterns from extremely poor quality fingerprint tissues, especially the noisy area in fin-gerprint images. For Instance, the above SWT-based feature
parameters have difficulties in differentiating some smears in
Figures6(a)–6(d)from bad quality finger tissues in Figures
6(e)–6(h). As illustrated in Figure 7, the subband energies
and mean values for Figures 6(b)and6(f)are too close to
differentiate. Thus the SWT-based feature parameters alone
are not sufficient for accurate identification of these special
types of smears.
On the other hand, the traditional gray level co-occurrence matrix (GLCM) probability features are not as sensitive to impulsive noise as the above-described SWT-based algorithms despite the fact that GLCM is not appro-priate for estimating lower-frequency features in fingerprint images. Thus we can take advantage of GLCM’s capability in capturing higher-frequency signatures in fingerprint images to compensate for SWT’s drawbacks.
2.2. Supplementary Features from GLCM. To further increase the smear identification sensitivity, we introduce a subband feature concatenation strategy by incorporating additional texture features including Entropy, Angular Second moment
(Energy), Contrast, and Inverse Difference Moment
com-puted from gray level co-occurrence matrix.
A co-occurrence matrix is a square matrix with elements corresponding to the relative frequency of occurrence of pairs of gray level of pixels separated by a certain distance in a given
direction [32,33]. Formally, the elements of aG×G gray
level co-occurrence matrixPdfor a displacement vectord=
(dx,d y) is defined as
Pd
i,j=((r,s), (t,v)) :I(r,s)=i,I(t,v)=j , (2)
whereI (·,·) denotes an image of sizeN×N withGgray
values, (r,s), (t,v)∈N×N, (t,v)=(r+dx,s+d y), and| · |
is the cardinality of a set.
Puetz and Olsen [34] discussed 14 measures of Haralick
0 0.2 0.4 0.6 0.8
Energ
y
1 1.2
1 3 5
Normal Slippage
7 9 11 13 15
SWT subbands (4∼19)
(a) Energy
0 0.2 0.4 0.6 0.8
Me
an
1 1.2
1 3 5
Normal Slippage
7 9 11 13 15
SWT subbands (4∼19)
(b) Mean
Figure5: Normalized feature values for Figures4(b)and4(f).
(a) (b) (c) (d)
(e) (f) (g) (h)
Figure6: Smear images versus normal images. (a)–(d) smear images with high-frequency texture patterns and (e)–(h) normal images of poor qualities.
matrices, and each represents certain image properties as coarseness, contrast, homogeneity, and texture complexity. To reduce the computational complexity, we only selected the following 3 features with most discriminatory power in terms of detecting high frequency fingerprint smears.
(1)Contrast.
CON=
i
j
i−j2pi,j. (3)
Contrast feature is a measure of the image contrast or the amount of local variations present in an image.
(2)Angular Second Moment.
ASM=
i
j
pi,j 2. (4)
0 0.2 0.4 0.6 0.8
Energ
y
1 1.2
1 3 5
Normal Slippage
7 9 11 13 15
SWT subbands (4∼19)
(a) Energy
0 0.2 0.4 0.6 0.8
Me
an
1 1.2
1 3 5
Normal Slippage
7 9 11 13 15
SWT subbands (4∼19)
(b) Mean
Figure7: Normalized feature values for Figures6(b)and6(f).
disorders in textures. The value of angular second moment for homogeneous textures turns out to be small compared to nonhomogeneous ones.
(3)Inverse Difference Moment.
IDM=
i
j 1
1 +i−j2p
i,j. (5)
In (3)–(5), p(i,j) refers to the normalized entry of the
co-occurrence matrices. That is,p(i,j)=Pd(i,j)/RwhereR
is the total number of pixel pairs (i,j). For a displacement
vectord=(dx,d y) and image of sizeN×M,Ris given by
(N−dx)(M−d y).
In this paper, each SWT image of size 90×90 is further
divided into 9 nonoverlapping subblocks of size 30×30.
Angular Second Moment, Contrast, and Inverse Difference
Moment were extracted for each of these subblocks as addi-tional feature parameters, yielding 27 addiaddi-tional probability
parameters for each 90×90 image. Figure 8illustrates the
discriminatory power of these parameters in differentiating
higher frequency smears from normal tissue in poor quality fingerprint areas.
SWT-based feature parameters extracted from subband
variances and mean values of wavelet coefficients were
combined with features extracted from GLCM, including
energy, contrast, and inverse difference moment, for the
same range of subbands between 4∼19. A texture region
in fingerprint image is now characterized by the mean and
variances of the wavelet transform coefficients as well as
additional feature parameters extracted from GLCM. Finally, a concatenated 59-dimensional feature vector
F = (E,M,G) for each subblock of size 90×90 is
con-structed using subvectorE,MandGas components, where
E(e1,. . .,e16) denotes 16 variances of SWT coefficients from
subbands 4∼19;M(m1,. . .,m16) denotes 16 mean values of
SWT coefficients from subbands 4∼19;G(g1,. . .,g27) stands
for 27 additional feature parameters derived from GLCM.
2.3. DCT-Based Feature Representation. The granularity of this SWT-based method is relatively course because the tree structured wavelet transform algorithm does not leave
further room for reduction of the subblock size from 90×
90 in order to represent crucial texture features of the fingerprint regions. As a result, image blocks labeled as smears may include normal pixels, while some of the small smear areas around image borders could be misclassified as normal tissue. Particularly, some defective fingerprint images with only one single sharp change between ridge lines, hereafter referred to as “ridge breaks”, can hardly be detected,
as shown inFigure 9, because there are no clear SWT-based
texture learning patterns for the subsequent classifier to identify this particular type of anomaly tissue containing sharp broken ridges.
The traditional DCT algorithm provides a decompo-sition of the original image in the frequency domain.
Therefore, DCT coefficients form a natural representation of
texture in the original image [35]. Based on this ability to
differentiate textures in an image, the DCT decomposition is
often used to detect abnormalities that differ from the usual
background [36,37].
The mathematical expression of DCT is given in (6),
which is used to compute the 2D DCT of a given input image f(x,y) of sizem×n.
C(u,v)=α(u)β(v)
m−1
x=0
n−1
y=0 fx,y
×cos
(2x+ 1)uπ
2m
cos 2y+ 1
vπ 2n
0 0.1 0.2 0.3 0.4 0.5 0.6
Angular
se
cond
m
oment
0.8 0.9 1
1 2 3
Normal Slippage
4 5 6 7 8 9
0.7
Subimage grid
(a) Second angular moment
0 0.1 0.2 0.3 0.4 0.5 0.6
In ve rs e d iff er enc e moment
0.8 0.9
1 2 3
Normal Slippage
4 5 6 7 8 9
0.7
Subimage grid
(b) Inverse different moment
0 0.2 0.4 0.6 0.8
Con
tr
as
t
1 1.2
1 2 3
Normal Slippage
4 5 6 7 8 9
Subimage grid
(c) Contrast
Figure8: Normalized feature values for Figures6(b)and6(f).
foru=0, 1,. . .,m−1,v=0, 1,. . .,n−1,α(u) andα(v) are
defined as (7)
α(u)= ⎧ ⎪ ⎪ ⎪ ⎪ ⎪ ⎨ ⎪ ⎪ ⎪ ⎪ ⎪ ⎩ 1
m, u=0,
2
m, u=1, 2,. . .,m−1,
α(v)= ⎧ ⎪ ⎪ ⎪ ⎪ ⎪ ⎨ ⎪ ⎪ ⎪ ⎪ ⎪ ⎩ 1
n, v=0,
2
n, v=1, 2,. . .,m−1.
(7)
While the DC coefficient represents the average energy
of the block, the value of each AC coefficient reflects the
variation in gray level values in certain directions at a certain rate.
Since the discrete cosine transform helps separate the
image into parts (or spectral subbands) of differing
impor-tance (with respect to the image’s visual texture differences)
[38], we could utilize the changes of energy and directional
information in the DCT domain to differentiate smear areas
from normal fingerprint areas, most importantly, with a smaller block size than SWT.
(a) (b)
Figure9: Smear images with abrupt discontinuity.
First, the DCT coefficient of the luminance part of each block
is compared with its spatial neighbors. Then (8) and (9) are
applied to detect abrupt ridge break in the neighborhood of the suspected block by searching in the neighboring blocks for high-frequency components. If the presence of strong ridge breaks is found in the neighborhood, the broken ridge
line direction is computed by (10). From the ridge line
information obtained, we compare the energy along the ridge line direction again, if the DCT energy variation is still higher than a certain threshold, the block is most likely to contain a sharp smear tissue. Our experiment indicates that the average DCT energy of image blocks changes abruptly in defective fingerprint smear areas with abrupt edges and broken ridges. We thereby decide to employ the relationship information of fingerprint image blocks to determine the presence of abnormal changes in a certain fingerprint area.
At first, each fingerprint image is split into 32 by 32 subblocks for DCT processing. Based on our observation that the sharp ridge break information from a certain fingerprint area can be extracted by some feature parameters generated
from the AC coefficients of each block in the DCT frequency
domain, a DCT-based approach is proposed in this paper to detect relatively small smear tissue containing ridge breaks whose texture properties can hardly be captured by the DWT-GLCM method.
Since most information required for differentiating the
sharp smear area from normal fingerprint tissue was found
in high-frequency-order DCT coefficients, in this research
we elect to extract first 20 higher-frequencies coefficients
from the Discrete Cosine Transform to represent the special features of the smear areas containing abnormal ridge breaks. Additionally, the changes of DCT domain orientation information between the neighboring blocks are also utilized to detect the sharp ridge breaks in smear area such as
Figure 9.
To take advantage of the discriminative power of
partic-ular DCT coefficients to capture the high-frequency texture
features, some statistical derivatives of the DCT spectral
coefficients can be derived within an image subblock in
frequency domain. In our approach, we derive specific discriminatory information from high-frequency DCT
com-ponents by computing local energy coefficients as well as the
standard deviation of respective energy coefficients of the
DCT of a sub-image according to (8) and (9), respectively.
E= 1
s2
s
u=0
s
v=0
|C(u,v)|(u,v)=/(0, 0), (8)
V =
s u=0
s
v=0(C(u,v)−E)2
s2 , (9)
where s stands for the size of DCT domain image block.
To obtain a feature vector containing additional information
which is crucial in differentiating sharp smear from
finger-print normal fingerfinger-print texture, we also utilize the following
equation of “DCT” coefficients to characterize ridge line
orientation information:
tanθ=
s
v=1C0v
s
u=1Cu0
. (10)
The above 3 DCT values are calculated for each 8 × 8
DCT block after normalization, which yields a vector of 48
features for each 32×32 fingerprint sub-image containing
16 nonoverlapping DCT blocks. Thus each individual finger-print sub-image is represented by a feature vector of 48 DCT derived values and used as input of the subsequent classifier to identify smaller fingerprint smear blocks containing abrupt edges or sharp broken ridges.
3. Smear Detection Using EGANN
Encoding
W11W12 V11 · · ·Vi· · ·
W V
· · ·Wi· · ·
Figure10: Encoding of the weight values into a string.W: weight matrix from input layer to hidden layer,V: weight matrix from hidden layer to output layer.
3.1. Genetic Neural Networks Model. Enhanced Genetic Neu-ral network (EGANN) is used in this paper as the training algorithm for Neural Network Classifier. Experiment results
by Yang et al. [39] demonstrate that EGANN significantly
outperformed BP in Convergence speed and classification accuracy due to the enhanced genetic algorithm’s superior optimization and global search ability as well as potential
parallelism [39,40].
The structure of EGANN, shown in Figure 10, is to
map connection weights of the Neural Network into a chromosome, for example, a string of genes representing element of the weight matrices. Weights are encoded in full binary form, by row. Mean Square error is used as the fitness function in the genetic algorithm.
In order to prevent the premature convergence problem that often occurs in conventional GA algorithm and improve
the training quality and efficiency of neural networks, an
enhancement technique called VPC (varying population crossover) is used in weights evolution process.
Suppose population is composed ofNindividuals:P1−
PN, and the length of each chromosome isl, so
Pi=
P1
i· · ·Pil
. (11)
Then the average individual of this population is
P= 1
N×L
N
i=1
l
j=1
Pij. (12)
The variety of the whole group can be computed by the following equation:
Dp= 1
N×L
N
i=1
l
j=1
Pij−P j2
. (13)
At the beginning of GANN evolution, the variety of
the original population D0 was calculated, and the initial
crossover ratePcwas set to 40%. At generationi, if the variety
of the group is represented byDi, thenPc was dynamically
adjusted according to the following formula.
Pc=Pc+
Di−1−Di
D0 ×0.4
. (14)
3.2. Experimental Setup. Because classification occurs at the subblock level, training samples are manually selected block by block from fingerprint images. An attempt was made to select the most representative blocks for both smear and normal areas.
3.2.1. SWT-GLCM-Based Smear Detection. We have an unbalanced data set containing 1786 fingerprint images, of which only 208 images have smear problems. A total of 328 subblocks (including 164 normal blocks and 164 smear blocks) were used for training, which were sampled from 105 fingerprint images (including 57 smear images and 58 normal images). The rest 1681 images were used as testing images, independent of the105 training images.
Through the genetic evolution process, an optimized weight matrix for the EGANN is obtained. Training error on this dataset is always below 0.1%, far superior to the results we obtained through neural network trained by conventional Back Propagation (BP) algorithm. This is due to the EGANN’s excellent global searching abilities, which makes it very suitable for dealing with the image processing and pixel classification problems involving large data sets and high-dimensional feature vectors.
A concatenated feature vector containing the combina-tion of fingerprint texture feature parameters extracted from SWT and GLCM is used as input to a pretrained three-layer (59 : 18 : 2) EGANN classifier. Based on EGANN outputs,
subblocks of size 90×90 are classified as either defective or
nondefective.Figure 11 demonstrates the detection results.
Smears are labeled with blue blocks of size 90×90.
A classification is considered accurate if a majority of the smear tissue was correctly labeled. A classification is considered false positive if a majority of the identified area is normal pixel. Evaluation of accuracy was based on the defect detection results on the 1681 test images. For smear detection on image level, correct detection rate is 90.1% and false positive rate is 0.13%.
3.2.2. DCT-Based Smear Detection. In order to effectively identify small smear tissue which is located around the image border or contains abrupt discontinuity, the EGANN classifier is trained separately on the small size DCT blocks to capture the unique features existing in this particular type of
smear areas. A total of 232 subblocks of size 32×32
(a) (b) (c)
(d) (e) (f)
Figure11: SWT-GLCM-based smear detection results.
(a) (b) (c) (d)
(e) (f) (g) (h)
Figure12: DCT-based smear detection results.
training, which were sampled from 104 fingerprint images (including 52 smear images and 52 normal images). The rest 1682 images were used as testing images, independent of the 104 training images. The training process is similar to what is described in 3.2.1. Each fingerprint subblock is classified into smear or normal fingerprint region according to the EGANN’s output. Accuracy of DCT smear detection was estimated on the 1682 test images. For smear detection
on fingerprint image level, a correct detection rate of 88.5% is achieved and the false positive rate is 0.19%.
One of the key advantages of DCT is that it works well with small smears and sharp changes among normal
finger ridges (Figures12(e)and12(f)), particularly the types
of small defective blocks around image borders that can
hardly be covered by SWT blocks (Figures12(g)and12(h)).
(a) (b) (c) (d)
(e) (f) (g) (h)
Figure13: SWT-GLCM-DCT hybrid smear detection results.
large concentrated smear areas, especially those with vertical
repeating patterns or irregular shapes (Figure 12(h)).
3.3. SWT-GLCM-DCT Hybrid Smear Detection. Since SWT and DCT each has its own advantages and drawbacks in detecting smear in fingerprint images, these two methods were adeptly integrated in this study to complement each
other in accurately identifying various smears. Figure 13
demonstrates some of the smear detection results by effi
-ciently combining SWT-, GLMC-, and DCT-based features. Experiments were performed on the 1681 test images, independent of the 105 images which were previously used for SWT-GLCM and DCT training. Results indicate that this hybrid method correctly detects 97.4% of the defective finger images with smears, while keeping false positive rate as low as 0.26%.
Experimental result indicates that the hybrid method can achieve more accurate smear detection on the image level than either of the two algorithms alone. The correct smear detection rate achieved by the SWT-GLMC-DCT hybrid method proposed by this research was 7.3% higher than the detection rate achieved by SWT and GLCM alone. As to the identification, for example, labeling of specific smear regions on the finger image, false positive does occur
due to the following reason. As illustrated by Figure 13(e),
some blocks identified as smears by DCT may be just extremely poor quality or distorted high-contrast areas on fingerprint images, rather than smears, since the texture
features extracted from DCT coefficients for these two
types of areas are too close to differentiate. Adjustment
of some threshold values in the proposed algorithm can further reduce false positives, while sacrificing identification sensitivity.
In order to further compare the performance of the pro-posed approach with the existing fingerprint image quality detection algorithm, we also implemented NIST Fingerprint Image Software (NFIS2) to detect smear fingerprint images
in our database. The MINDTCT package of NFIS2 [14]
generates image quality map by computing the quality
of localized regions in the fingerprint image. The NFIQ measures fingerprint quality by 5 classes, where class one refers to “excellent” and class five to “poor”, and the “NFIQ value” output by NFIQ algorithm serves as a quality indicator of the input fingerprint. In this research, we set NFIQ threshold value to 4 to separate good quality fingerprint images from defective smear images.
The comparison of smear detection performance between the methods proposed in this research and NFIQ
is shown inTable 1. Experimental results indicate that the
proposed algorithms can differentiate smear fingerprints
from normal fingerprints much better than NFIQ. At a low false positive rate of 0.26%, 94.7% of the smear fingerprints were successfully detected using our SWT-GLCM-DCT hybrid approach, but only 33% of them were detected by NFIQ at a false positive rate of 1.83%. One of the reasons for the low smear detection accuracy by the widely used NFIQ algorithm was because many smear fingerprint images may pass NFIQ fingerprint quality control software as the texture patterns in these smear areas do not necessarily reduce the finger image quality measured by conventional fingerprint quality evaluation software. For instance, the smear area in
Figure 2(h)is assigned the highest quality level of 1 by the NFIQ software.
4. Conclusions
In this paper, the challenging smear detection problem in Live Scan fingerprint images is systematically analyzed and investigated, and a novel fingerprint texture classifi-cation method is proposed to detect smear automatically.
The difficult issues existing in fingerprint smear detection
are addressed and successfully solved by integrating SWT, GLCM, and DCT algorithms. Texture signatures extracted
from SWT based subband coefficients were fused with
GLCM features and then fed into an EGANN classifier
to effectively differentiate large smear areas from normal
Table1: Performance comparison of the four methods on 1681 test fingerprint images.
Methods SWT-GLCM DCT SWT-GLCM-DCT NFIQ
True detection rate 90.1% 88.5% 97.4% 33.1%
False positive rate 0.13% 0.19% 0.26% 1.83%
areas with abrupt discontinuity, DCT-based texture features were incorporated to accurately discriminate such areas.
In the future work, studies on the optimum fusion of feature parameters may be necessary to further improve finger texture classification accuracy.
Acknowledgment
This work was supported in part by the National Sci-ence Foundation of Heilongjiang Province under Grant 42400621-1-09130.
References
[1] A. Swaminathan, M. Wu, and K. J. R. Liu, “Digital image forensics via intrinsic fingerprints,” IEEE Transactions on Information Forensics and Security, vol. 3, no. 1, pp. 101–117, 2008.
[2] J. Gu, J. Zhou, and C. Yang, “Fingerprint recognition by combining global structure and local cues,”IEEE Transactions on Image Processing, vol. 15, no. 7, pp. 1952–1964, 2006. [3] A. K. Jain, S. Prabhakar, L. Hong, and S. Pankanti,
“Filterbank-based fingerprint matching,” IEEE Transactions on Image Processing, vol. 9, no. 5, pp. 846–859, 2000.
[4] D. Maltoni, D. Maio, A. Jain et al.,Handbook of Fingerprint Recognition, Springer, New York, NY, USA, 2003.
[5] H. T. Peter, “Standards for the electronic submission of fingerprint cards to the FBI,”Journal of Forensic Identification, vol. 45, no. 4, pp. 409–418, 1995.
[6] L. O’Gorman, “Practical systems for personal fingerprint authentication,” IEEE Computer, vol. 33, no. 2, pp. 58–60, 2000.
[7] S. C. Dass, “Assessing fingerprint individuality in presence of noisy minutiae,”IEEE Transactions on Information Forensics and Security, vol. 5, no. 1, pp. 62–70, 2010.
[8] A. Jain, L. Hong, and S. Pankanti, “Biometrics Identification,” Communications of the ACM, vol. 43, no. 2, pp. 91–98, 2000. [9] C. Wilson and R. A. Hicklin, “Fingerprint vendor technology
evaluation,” Analysis Report, DRAFT, 2004.
[10] A. K. Jain, A. Ross, and S. Pankanti, “Biometrics: a tool for information security,” IEEE Transactions on Information Forensics and Security, vol. 1, no. 2, pp. 125–143, 2006. [11] P. Grother and E. Tabassi, “Performance of biometric quality
measures,”IEEE Transactions on Pattern Analysis and Machine Intelligence, vol. 29, no. 4, pp. 531–543, 2007.
[12] G. Aguilar, G. S´anchez, K. Toscano, M. Nakano, and H. P´erez, “Multimodal biometric system using fingerprint,” in Proceedings of the International Conference on Intelligent and Advanced Systems (ICIAS ’07), pp. 145–150, November 2007. [13] F. Alonso-Fernandez, J. Fierrez, J. Qrtega-Garcia et al., “A
comparative study of fingerprint image-quality estimation methods,” IEEE Transactions on Information Forensics and Security, vol. 2, no. 4, pp. 734–743, 2007.
[14] E. Tabassi, C. Wilson, and C. Watson, “Fingerprint image quality,” Tech. Rep. 7151, NISTIR, 2004.
[15] C. Wu, S. Tulyakov, and V. Govindaraju, “Image quality mea-sures for fingerprint image enhancement,” inProceedings of the International Workshop on Multimedia Content Representation, Classification and Security (MRCS ’06), vol. 4105 ofLecture Notes in Computer Science, 2006.
[16] K. Uchida, “Image-based approach to fingerprint acceptability assessment,” inProceedings of the 1st International Conference on Biometric Authentication (ICBA ’04), pp. 294–300, 2004. [17] Y. Zhao, C. Jiang, and W. Xu, “Research and application
of fingerprint image quality estimation,” in Proceedings of the International Conference on Information Engineering and Computer Science (ICIECS ’09), pp. 1–5, December 2009. [18] Y. I. Chen, S. C. Dass, and A. K. Jain, “Fingerprint quality
indices for predicting authentication performance,” in Pro-ceedings of the 5th International Conference on Audio and Video-Based Biometric Person Authentication (AVBPA ’05), pp. 160–170, July 2005.
[19] L. Shen, A. Kot, and W. Koo, “Quality measures of fingerprint images,” in Proceedings of the5th International Conference on Audio and Video-Based Biometric Person Authentication (AVBPA ’01), pp. 266–271, 2001.
[20] E. Lim, X. Jiang, and W. Yau, “Fingerprint quality and validity analysis,” in Proceedings of the International Conference on Image Processing (ICIP ’02), pp. 469–472, September 2002. [21] N. Vasconcelos, “Minimum probability of error image
retrieval,”IEEE Transactions on Signal Processing, vol. 52, no. 8, pp. 2322–2336, 2004.
[22] M. Partio, B. Cramariuc, M. Gabbouj, and A. Visa, “Rock texture retrieval using gray level co-occurrence matrix,” in Proceedings of the 5th Nordic Signal Processing Symposium (NORSIG ’02), Hurtigruten, Norway, October 2002.
[23] M. Unser, “Texture classification and segmentation using wavelet frames,”IEEE Transactions on Image Processing, vol. 4, no. 11, pp. 1549–1560, 1995.
[24] K. E. Huang and S. Aviyente, “Information-theoretic wavelet packet subband selection for texture classification,” Signal Processing, vol. 86, no. 7, pp. 1410–1420, 2006.
[25] Z. Z. Wang and J. H. Yong, “Texture analysis and classification with linear regression model based on wavelet transform,” IEEE Transactions on Image Processing, vol. 17, no. 8, pp. 1421– 1430, 2008.
[26] S. Arivazhagan and L. Ganesan, “Texture classification using wavelet transform,”Pattern Recognition Letters, vol. 24, no. 9-10, pp. 1513–1521, 2003.
[27] N. Sebe and M. S. Lew, “Wavelet based texture classification,” IEEE Multimedia, pp. 947–950.
[28] S. Livens, P. Scheunders, G. Van de Wouwer, and D. Van Dyck, “Wavelets for texture analysis, an overview,” inProceedings of the 6th International Conference on Image Processing and Its Applications (IPA ’97), vol. 1, pp. 581–585, IEE Publication, July 1997.
[30] J. Tang and X. Liu, “An improved WSQ fingerprint image compression algorithm,” inProceedings of the 42nd Asilomar Conference on Signals, Systems and Computers (ASILOMAR ’08), pp. 1267–1271, October 2008.
[31] C. M. Brislawn, J. N. Bradley, R. J. Onyshczak, and T. Hopper, “FBI compression standard for digitized fingerprint images ,” inApplications of Digital Image Processing XIX, vol. 2847 of Proceedings of SPIE, pp. 344–355, August 1996.
[32] D. A. Clausi and H. Deng, “Design-based texture feature fusion using Gabor filters and co-occurrence probabilities,” IEEE Transactions on Image Processing, vol. 7, no. 14, pp. 925– 936, 2005.
[33] L. D. O. Bastos, P. Liatsis, and A. Conci, “Automatic texture segmentation based on k-means clustering and efficient calculation of co-occurrence features,” inProceedings of the 15th International Conference on Systems, Signals and Image Processing (IWSSIP ’08), pp. 141–144, June 2008.
[34] A. M. Puetz and R. C. Olsen, “Haralick texture features expanded into the spectral domain,” in Algorithms and Technologies for Multispectral, Hyperspectral, and Ultraspectral Imagery XII, vol. 6233 ofProceedings of SPIE, p. 623311, May 2006.
[35] R. C. Gonzalez and R. E. Woods, Digital Image Processing, Addison-Wesley, Reading, Mass, USA, 3rd edition, 2008. [36] H. D. Lin and D. C. Ho, “Automated tiny surface defect
detection using DCT based enhancement approach for statis-tical textures,” inProceedings of the IEEE/ASME International Conference on Advanced Intelligent Mechatronics (AIM ’05), pp. 373–378, July 2005.
[37] A. Latif-Amet, A. Ert¨uz¨un, and A. Erc¸il, “Efficient method for texture defect detection: sub-band domain co-occurrence matrices,”Image and Vision Computing, vol. 18, no. 6-7, pp. 543–553, 2000.
[38] G. Sorwar, A. Abraham, and L. S. Dooley, “Texture classifica-tion based on DCT and soft computing,” inProceedings of the 10th IEEE International Conference on Fuzzy Systems, pp. 545– 548, Melbourne, Australia, December 2001.
[39] X. Yang, X. Chen, and C. Ma, “Study on automated color inspection of apples using genetic neural networks,” Trans-actions of the Chinese Society of Agricultural Engineering, February 1997.