HANDBOOK OF
HANDBOOK OF
NETWORK AND SYSTEM
ADMINISTRATION
Edited by
Jan Bergstra
Informatics Institute, University of Amsterdam Amsterdam, The Netherlands
Mark Burgess
Faculty of Engineering, University College Oslo Oslo, Norway
Elsevier
Radarweg 29, PO Box 211, 1000 AE Amsterdam, The Netherlands Linacre House, Jordan Hill, Oxford OX2 8DP, UK
First edition 2007
Copyright © 2007 Elsevier B.V. All rights reserved
No part of this publication may be reproduced, stored in a retrieval system or transmitted in any form or by any means electronic, mechanical, photocopying, recording or otherwise without the prior written permission of the publisher
Permissions may be sought directly from Elsevier’s Science & Technology Rights Depart-ment in Oxford, UK: phone (+44) (0) 1865 843830; fax (+44) (0) 1865 853333; email: [email protected]. Alternatively you can submit your request online by visiting the Elsevier website athttp://elsevier.com/locate/permissions, and selecting Obtaining per-mission to use Elsevier material
Notice
No responsibility is assumed by the publisher for any injury and/or damage to persons or property as a matter of products liability, negligence or otherwise, or from any use or operation of any methods, products, instructions or ideas contained in the material herein. Because of rapid advances in the medical sciences, in particular, independent verification of diagnoses and drug dosages should be made
Library of Congress Cataloging-in-Publication Data
A catalog record for this book is available from the Library of Congress
British Library Cataloguing in Publication Data
A catalogue record for this book is available from the British Library
ISBN: 978-0-444-52198-9
For information on all Elsevier publications visit our website at books.elsevier.com
Printed and bound in The Netherlands
Preface
The volume, of which you are in some doubt could reasonably be called a book to be held in human hands, is a collection of chapters sampling the current State of the Art of network and system administration or management. It is written by researchers, for researchers, educators and advanced practitioners.
The field of Network and System Administration is (some would claim) still an emerging field, one that bridges disciplines, and challenges the traditional boundaries of computer science. It forces us to confront issues like partial predictability and partial reliability that are more commonly associated with engineering disciplines in an uncertain environment. It does so because human–computer networksarecomplex and uncertain environments. In other words, it rediscovers the lesson that other sciences have already made peace with: thatapproximationis the only realistic approach to its difficulties.
Whatever the novelty of the field, there is already a large body of knowledge about it, contained in a diverse array of sources. This has only recently begun to be formalized how-ever, in the way we conventionally expect of an academic discipline. Much of it has been only sketchily formulated and does not lend itself to future development by researchers and designers. We hope to partially rectify that situation with this volume.
So what is administration or management? This is a difficult question to answer in full, but it clearly covers few themes:
• Making choices and decisions about design, implementation, practice and operations.
• Provision of resources.
• Infrastructure and service design.
• Maintenance and change management.
• Verification and validation of specifications.
• Economic usage and business integration.
Within the list above, we also find the foundations for more abstract concerns like secu-rity and commerce. We have not been able to cover every aspect of the field in this book, but we have hopefully covered enough to take us forward.
OurHandbook of Network and System Administrationis not a textbook for day-to-day practitioners. It is aimed at those who are seeking to move beyond recipies and principles, on to creative innovation in application, development or research; it offers a solid scientific and engineering foundation for the field. We hope that it will also inspire less experienced readers. For them we recommend a background for this volume in a number of recent textbooks:
• For a technical introduction to the principles and techniques of system administra-tion one hasPrinciples of Network and System Administration, Mark Burgess. Wiley (2000,2004).
vi Preface
• An introduction to the heuristics and day to day practices of system administration is found inThe Practice of System and Network Administration, T.A. Limoncelli and C. Hogan. Addison Wesley (2002).
• Advanced matters of modelling and in-depth understanding of systems can be found inAnalytical Network and System Administration, Mark Burgess. Wiley (2004). In addition to this educationally honed sequence, there are numerous resources on specific technologies, for instance in the ‘animal series’ of books by the publisher O’Reilly.
If we add to the above a book of collected papers, which documents the early work in system administration,
• Selected Papers in Network and System Administration, Erik Anderson, Mark Burgess and Alva Couch, Eds. Wiley (2001).
and a book of chapters on the early parts of Network Management
• Network and Distributed Systems Management, Morris Sloman, Ed. Addison Wes-ley (1994).
then we could present this volume as the next piece of a series covering the academic spectrum in the field.
An editor quickly discovers that soliciting contributions is harder than one might think. Shamelessly appealing to the vanity of contributors only goes so far in coaxing words onto pages. Those who have practiced network and system management, in particular, rarely like to write down their knowledge. This has made our volume end up being more forward-looking than historical, although we have succeeded in covering a few examples of classic materials, such as E-mail and backup. It has left us to try to mention the omissions in our commentary, with obvious limitations. Fortunately many traditional topics are already discussed in the books above.
Our book is already quite thick, so let us not prolong the introduction unnecessarily. We simply invite you to read the chapters and we offer some brief commentary along the way.
Acknowledgements
Jan Bergstra acknowledges support from the NWO-Jacquard grant Symbiosis. The Sym-biosis project focuses on IT sourcing in general and software asset sourcing more specifi-cally.
Mark Burgess acknowledges support from the EC IST-EMANICS Network of Excel-lence (#26854).
List of Contributors
Badonnel, R.,LORIA, Lorraine, France(Ch. 3.2)
Bandara, A.,Imperial College London, London, UK(Ch. 4.3)
Bergstra, J.A., University of Amsterdam, Amsterdam, and Utrecht University, Utrecht, The Netherlands(Ch. 5.4)
Bethke, I.,University of Amsterdam, Amsterdam, The Netherlands(Ch. 5.4) Bishop, M.,University of California at Davis, Davis, CA, USA(Ch. 4.2) Brenner, M.,Ludwig Maximilians University, Munich, Germany(Ch. 7.3) Brown, A.B.,IBM Software Group, Somers, NY, USA(Ch. 1.3)
Burgess, M.,University College Oslo, Oslo, Norway(Chs. 1.2, 5.2, 6.2, 6.3) Canright, G.S.,Telenor R&D, Fornebu, Norway(Ch. 3.3)
Chalup, S.R. (Ch. 8.2)
Choi, M.-J.,POSTECH, Pohang, South Korea(Ch. 2.4)
Couch, A.L.,Tufts University, Medford, MA, USA(Chs. 1.4, 5.3) Damianou, N.,Imperial College London, London, UK(Ch. 4.3)
Delen, G.,Amsterdam School of ICT, Amsterdam, The Netherlands(Ch. 7.5)
Dreo Rodosek, G., University of Federal Armed Forces Munich, Munich, Germany (Ch. 7.3)
Dulay, N.,Imperial College London, London, UK(Ch. 4.3) Engø-Monsen, K.,Telenor R&D, Fornebu, Norway(Ch. 3.3) Fagernes, S.,University College Oslo, Oslo, Norway(Ch. 8.3) Festor, O.,LORIA, Lorraine, France(Ch. 3.2)
Frisch, Æ.,Exponential Consulting, Wallingford, CT, USA(Ch. 2.6)
Hanemann, A.,Leibniz Supercomputing Center Munich, Munich, Germany(Ch. 7.3) Hausheer, D., ETH Zürich, Computer Engineering and Networks Laboratory, TIK,
Switzerland(Ch. 7.2)
Hegering, H.-G.,Leibniz Supercomputing Center Munich, Munich, Germany(Ch. 7.3) Hellerstein, J.L.,Microsoft Corporation, Redmond, WA, USA(Ch. 1.3)
Hong, J.W.,POSTECH, Pohang, South Korea(Ch. 2.4)
Hoogeveen, D., Verdonck, Klooster & Associates B.V., Zoetermeer, The Netherlands (Ch. 7.6)
Keller, A.,IBM Global Technology Services, New York, NY, USA(Ch. 1.3) Koenig, R.,Ludwig Maximilians University, Munich, Germany(Ch. 7.3)
viii List of Contributors
Koymans, C.P.J.,University of Amsterdam, Amsterdam, The Netherlands(Chs. 2.3, 2.5) Koymans, K.,University of Amsterdam, Amsterdam, The Netherlands(Ch. 3.5)
Kristiansen, L.,University of Oslo, Oslo, Norway(Ch. 5.2) Lupu, E.,Imperial College London, London, UK(Ch. 4.3) Martin-Flatin, J.-P.,NetExpert, Gland, Switzerland(Ch. 2.7) Pras, A.,University of Twente, Enschede, The Netherlands(Ch. 2.7) Reitan, T.,University of Oslo, Oslo, Norway(Ch. 6.4)
Ribu, K.,University College Oslo, Oslo, Norway(Ch. 8.3) Scheerder, J. (Chs. 2.3, 2.5)
Scheffel, P.F.L.,Waterford Institute of Technology, Waterford, Ireland(Ch. 7.4) Schönwälder, J.,Jacobs University Bremen, Bremen, Germany(Ch. 2.8) Sloman, M.,Imperial College London, London, UK(Ch. 4.3)
State, R.,LORIA, Lorraine, France(Ch. 3.2) Stav, K.,IBM Corporation, USA(Ch. 2.2)
Stiller, B.,University of Zürich and ETH Zürich, Switzerland(Ch. 7.2) Strassner, J.,Motorola Labs, Schaumburg, IL, USA(Chs. 3.4, 7.4) Sun, Y.,Tufts University, Medford, MA, USA(Ch. 5.3)
Contents
Preface v
List of Contributors vii
1. The Arena 1
1.1. Commentary 1
1.2. Scaling data centre services 3
M. Burgess
1.3. Automating system administration: Landscape, approaches and costs 43 A.B. Brown, J.L. Hellerstein and A. Keller
1.4. System configuration management 75 A.L. Couch
2. The Technology 135
2.1. Commentary 135
2.2. Unix and z/OS 137
K. Stav
2.3. Email 147
C.P.J. Koymans and J. Scheerder
2.4. XML-based network management 173
M.-J. Choi and J.W. Hong
2.5. Open technology 197
J. Scheerder and C.P.J. Koymans
2.6. System backup: Methodologies, algorithms and efficiency models 205 Æ. Frisch
2.7. What can Web services bring to integrated management? 241 A. Pras and J.-P. Martin-Flatin
2.8. Internet management protocols 295 J. Schönwälder
3. Networks, Connections and Knowledge 329
3.1. Commentary 329
3.2. Management of ad-hoc networks 331 R. Badonnel, R. State and O. Festor
3.3. Some relevant aspects of network analysis and graph theory 361 G.S. Canright and K. Engø-Monsen
3.4. Knowledge engineering using ontologies 425 J. Strassner
3.5. Application integration using semantic Web services 457 J. Vrancken and K. Koymans
x Contents
4. Policy and Constraint 471
4.1. Commentary 471
4.2. Security management and policies 473 M. Bishop
4.3. Policy-based management 507
A. Bandara, N. Damianou, E. Lupu, M. Sloman and N. Dulay
5. Computational Theories of System Administration 565
5.1. Commentary 565
5.2. On the complexity of change and configuration management 567 M. Burgess and L. Kristiansen
5.3. Complexity of system configuration management 623 Y. Sun and A. Couch
5.4. Predictable and reliable program code: Virtual machine-based projection
semantics 653
J.A. Bergstra and J. Bethke
6. System Science 687
6.1. Commentary 687
6.2. System administration and the scientific method 689 M. Burgess
6.3. System administration and micro-economic modelling 729 M. Burgess
6.4. System reliability 775
T. Reitan
7. Business and Services 811
7.1. Commentary 811
7.2. State-of-the-art in economic management of internet services 813 B. Stiller and D. Hausheer
7.3. Service provisioning: Challenges, process alignment and tool support 855 M. Brenner, G. Dreo Rodosek, A. Hanemann, H.-G. Hegering and R. Koenig
7.4. IT service management 905
P.F.L. Scheffel and J. Strassner
7.5. Decision and control factors for IT-sourcing 929 G. Delen
7.6. How do ICT professionals perceive outsourcing? Factors that influence
the success of ICT outsourcing 947
D. Hoogeveen
8. Professional and Social Issues 959
8.1. Commentary 959
8.2. Systems administration as a self-organizing system: The professionalization of SA via interest and advocacy groups 961 S.R. Chalup
8.3. Ethical, legal and social aspects of systems 969 S. Fagernes and K. Ribu
1. The Arena
1.1.
Commentary
The arena of system management is as broad as it is long. What began in consolidated computer centres has spread to the domestic arena of households and even to the outdoors, through a variety of personal consumer electronic items. It is an open question how much management such computing devices need in such different milieux.
In this part the authors describe some of the issues involved in the administration of systems in a more traditional organizational settings. Many matters have been left out; others are covered in later chapters, such as Chapter 3.2 about ad hoc networking in Part 3. During the 1970s one spoke of computer operations, during the 1980s and 1990s ‘system administration’ or sometimes ‘network administration’ was the preferred appellation. Now in the 2000s we have becomeservice orientedand departments and businesses are service providers. The organization is required to provide a service to customers within a ‘business’ framework.
Efficiency and productivity are key phrases now, and most computers in a business or university environment are located within some kind of data centre. Since the limits of performance are constantly being pushed Automation is an important approach for scala-bility. From an economic perspective, automation is a good investment for tasks that are frequently repeated and relatively easy to perform. As they become infrequent or difficult, the economics of automation become less attractive.
– 1.2 –
Scaling Data Centre Services
Mark Burgess
Faculty of Engineering,University College Oslo,Room 707,Cort Adelers Gate 30,0254 Oslo,Norway E-mail:mark.burgess@iu.hio.no
1. Introduction
The management of computer resources is a key part of the operation of IT services. Its trends tend to proceed in cycles of distribution and consolidation. Today, the data centre plays an increasingly important role in services: rather than managing computer resources in small private rooms, many companies and organizations are once again consolidating the management of systems into specialized data centres. Such organized management is linked to the rise of de facto standards like ITIL [4,25,26] and to the increased use of outsourcing and service oriented computing which are spreading through the industry. Management standards like ITIL are rather abstract however; this chapter offers a brief technical overview of the data centre environment.
2. Computing services
Computing services are increasingly required to be scalable and efficient to meet levels of demand. The delivery of high levels of computing service is associated with three common phrases:
• High Performance Computing (HPC).
• High Volume Services (HVS).
• High Availability Services (HAS). These phrases have subtly different meanings.
HANDBOOK OF NETWORK AND SYSTEM ADMINISTRATION Edited by Jan Bergstra and Mark Burgess
© 2007 Elsevier B.V. All rights reserved
4 M. Burgess Part 1
2.1. High performance computing
HPC is the term used to describe a variety of CPU intensive problems. This often involves supercomputers and/or networked clusters of computers to take a large computational prob-lem, divide it into to smaller chunks and solve those chunks in parallel. HPC requires very high-capacity and/or low-latency connections between processors. The kinds of problems solved in this way are typically of a scientific nature, such as massive numerical problems (e.g., weather and climate modelling), or search problems in bioinformatics.
For problems that require massive computational power but which are less time-critical, another strategy is Grid computing, an extension of the idea in which the sharing takes place over anything from a short cable to a wide area network.
2.2. High volume services
This refers to applications or services, normally based on content provision, that are de-signed to handle large numbers of transactions. HVS are a generalization of HPC to non-specifically CPU-oriented tasks. High volume services are achieved by implementing strategies for workload sharing between separate server-hosts (often called load balancing). HVS focuses on serving large volumes of requests, and must therefore address scalabil-ity. System throughput demands a careful analysis of system bottlenecks. Load-sharing is often required to attain this goal. HVS includes the economics and the performance tuning of services. The ability to deliver reliable service levels depends on both the resources that are available in the data centre and the pattern of demand driven by the users.
2.3. High availability services
These are applications designed formission-criticalsituations, where it is essential that the service is available for the clients with alow latency, or short response time. To achieve this, a mixture of redundancy and fault detection is implemented in the system. HAS is about ensuring that a service is available with an assured quality of response time, with target service level. One must decide what ‘available’ means in terms of metric goals (e.g., upper bound response time).
3. Resources
To achieve a high performance (and hence high volume) computing we need resource management. The resources a computer system has to utilize and share between different tasks, users and processes are:
• CPU.
Ch. 2 Scaling data centre services 5
• Memory.
• Network capacity.1
Many technologies are available to do optimization and perform this sharing, as noted in the forthcoming sections.
Computer processing is limited bybottlenecksor throughput limitations in a system. Sometimes these performance issues can be separated and conquered one by one, other times interdependencies make it impossible to increase performance simply by making changes to components. For instance, some properties of systems areemergent, i.e., they are properties of the whole system of all components, not of any individual part.
3.1. CPU
For CPU intensive jobs, the basic sharing tools are:
• Multi-tasking and threading at the operating system level.
• Multi-processor computers, vector machines and Beowulf clusters which allow paral-lelism.
• Mainframe computing.
• Grid Engine job distribution systems for parallel computing.
• MPI (Message Passing Interface) programming tools.
Flynn’s taxonomy is a classification scheme for parallel computers based on whether the parallelism is exhibited in the instruction stream and/or in the data stream. This classifi-cation results in four main categories, SISD (single instruction single data), SIMD (single instruction multiple data), MISD (multiple instruction single data) and MIMD (multiple in-struction multiple data). Different strategies for building computers lead to designs suited to particular classes of problems.
Load-balancing clusters operate by having all workload come through one or more load-balancing front ends, which then distribute work to a collection of back end servers. Al-though they are primarily implemented for improved performance, they commonly include high availability features as well. Such a cluster of computers is sometimes referred to as a server farm.
Traditionally computers are built over short distance buses with high speed communi-cations. Dramatic improvements in network speeds have allowed wide area connection of computer components. Grid computing is the use of multiple computing nodes connecting by such wide area networks. Many grid projects exist today; many of these are designed to serve the needs of scientific projects requiring huge computational resources, e.g., bioin-formatics, climate and weather modelling, and the famous Search for Extra-terrestrial In-telligence (SETI) analysis project.
3.2. Disk
Fast, high volume storage is a key component of delivery in content based services. Be-cause disk-storage requires mechanical motion of armatures and disk heads, reading from
6 M. Burgess Part 1
and writing to disk is a time-consuming business, and a potential bottleneck. Disk services that cache pages in RAM can provide a large speed-up for read/write operations.
RAID includes a number of strategies for disk performance and reliability. Redundant Arrays of Independent Disks2 are disk arrays that have special controllers designed to optimize speed and reliability. RAID deals with two separate issues: fault tolerance and parallelism. Fault tolerant features attempt to reduce the risk of disk failure and data-loss, without down-time. They do this using redundant data encoding (parity correction codes) or mirroring. Parallism (mirroring and striping of disks) is used to increase data availability. These are often conflicting goals [11,15,16,31].
Disk striping, or parallelization of data access across parallel disks can result in an up-to-N-fold increase in disk throughput forNdisks in the best case.
Error correction, sometimes referred to asparity, is about reliability. Error correction technology adds additional search and verification overheads, sometimes quoted at as much as 20% to the disk search response times. It can be a strategy for increasing up-time how-ever, since RAID disks can be made hot-swappable without the need for backup.
Ten years ago networks were clearly slower than internal databuses. Today network speeds are often faster than internal databuses and there is a potential gain in both perfor-mance and administration in making disk access a network service. This has led to two architectures for disk service:
• Storage Area Networks (SAN).
• Network Attached Storage (NAS).
A Storage Area Network is an independent network of storage devices that works in place of disks connected on a local databus. This network nevertheless appears as a low level disk interface, usually SCSI. Disk storage appears as locally attached device in a computer operating system’s device list. The device can be formatted for any high level filesystem.
SAN uses ISCSI (SCSI over Internet) using a dedicated network interface to connect to a storage array. This gives access to an almost unlimited amount of storage, compared to the limited numbers of disks that can be attached by the various SCSI versions. SAN can also use Fibre channel, which is another fibre-based protocol for SCSI connection.
NAS works more like a traditional network service. It appears to the computer as a filesystem service like NFS, Samba, AFS, DFS, etc. This service is mounted in Unix or attached as a logical ‘drive’ in Windows. It runs over a normal network protocol, like IP. Normally this would run over the same network interface as normal traffic.
3.3. Network
Network service provision is a huge topic that evolves faster than the timescale of publish-ing. Many technologies compete for network service delivery. Two main strategies exist for data delivery:
• Circuit switching.
• Packet switching.
Ch. 2 Scaling data centre services 7
These are roughly analogous to rail travel and automobile travel respectively. In circuit switching, one arranges a high-speed connection between certain fixed locations with a few main exchanges. In the packet switching, packets can make customized, individually routed journeys at the expense of some loss of efficiency.
Network throughput can be improved by adapting or tuning:
• Choice of transport technology, e.g., Fibre, Ethernet, Infiniband, etc.
• Routing policies, including the strategies above.
• Quality of service parameters in the underlying transport.
Most technological variations are based on alternative trade-offs, e.g. high speed over short distances, or stable transport over wide-areas. The appropriate technology is often a matter of optimization of performance and cost.
4. Servers and workstations
Computer manufacturers or ‘vendors’ distinguish between computers designed to be ‘workstations’ and computers that are meant to be ‘servers’. Strictly speaking, a server is aprocessthat provides a service not necessarily a whole computer; nevertheless, this appellation has stuck in the industry.
In an ideal world one might be able to buy a computer tailored to specific needs, but mass production constraints lead manufacturers to limit product lines for home, businesses and server rooms. Home computers are designed to be cheap and are tailored for gaming and multi-media. Business computers are more expensive versions of these with different design look. Servers are designed for reliability and have their own ‘looks’ to appeal to data centre customers.
A server computer is often designed to make better use of miniaturization, has a more robust power supply and better chassis space and expansion possibilities. High-quality hardware is also often used in server-class systems, e.g. fast, fault tolerant RAM, and com-ponents that have been tested to higher specifications. Better power supply technology can lead to power savings in the data centre, especially when many computers are involved in a large farm of machines.
We sometimes think of servers as ‘large computers’, but this is an old fashioned view. Any computer can now act as a server. Basic architectural low-level redundancy is a selling point for mainframes designs, as the kind of low-level redundancy they offer cannot easily be reproduced by clustering several computers.
4.1. Populating a data centre
8 M. Burgess Part 1
One decision to be made in choosing hardware for a server function is the following. Should one:
• Buy lots of cheap computers and use high-level load sharing to make it perform?
• Buy expensive computers designed for low-level redundancy and performance? There is no simple answer as to which of these two approaches is the best strategy. The answer has fluctuated over the years, as technological development and mass production have advanced. Total cost of ownership is usually greater with custom-grown systems and cheap-to-buy computers. The cost decision becomes a question of what resources are most available in a given situation. For a further discussion of this see the chapter on System Administration and Business in this volume.
Computer ‘blades’ are a recent strategic design aimed at data centres, to replace normal chassis computers.
• Blades are small – many of these computers can be fitted into a small spaces specially designed for racks.
• Power distribution to blades is simplified by a common chassis and can be made redundant (though one should often read the small-print).
• A common switch in each chassis allows efficient internal networking.
• VLANs can be set up internally in a chassis, or linked to outside network.
• Blade chassis are increasingly designed for the kind of redundancy that is needed in a large scale computing operation, with two of everything provided as options (power, switch, etc.).
• They often have a separate network connection for an out-of-band management con-sole.
The blade servers are a design convenience, well suited to life in data centre where space, power and cooling are issues.
4.2. Bottlenecks – why won’t it go faster?
Service managers are sometimes disappointed that expensive upgrades to not lead to im-proved performance. This is often because computing power is associated with the CPU frequency statistics. Throwing faster CPUs at service tasks is a naive way of increasing processing. This will only help if the service tasks are primarily CPU bound.
So where are the main performance bottlenecks in computers? This is probably the wrong question to ask. Rather we have to ask, where is the bottleneck in anapplication? The resources needed by different applications are naturally different. We must decide whether a process spends most of its time utilizing:
• CPU?
• Network?
• Disk?
• Memory?
We also need to understand whatdependenciesare present in the system which could be a limiting factor [6].
Ch. 2 Scaling data centre services 9
the resources being used and choose a technology which solves the problem we are facing. Technologies have design trade-offs which we have to understand. For instance, we might choose Infiniband for short connection, high-speed links in a cluster, but this would be no good for connecting up a building. Distance and speed are often contrary to one another.
Read versus write performance is a key factor in limiting throughput. Write-bound op-erations are generally slower than read-only opop-erations because data have to be altered and caching is harder to optimize for writing. Redundancy in subsystems has a performance cost, e.g., in RAID 5 data are written to several places at once, whereas only one of the copies has to be read. This explains why RAID level 5 redundancy slows down disk writ-ing, for example. The combination of disk striping with each disk mirrored is often chosen as the optimal balance between redundancy and efficiency.
Applications that maintaininternal stateover long-termsessionsversus one-off trans-actions often have complications that make it harder to share load using high-level redun-dancy. In such cases low-level redundancy, such as that used in mainframe design is likely to lead to more efficient processing because the cost of sharing state between separate computers is relatively high.
5. Designing an application architecture
5.1. Software architecture
In an ideal world, software engineers would be aware of data centre issues when writing application software. Service design involves concerns from the low-level protocols of the network to the high-level web experiences of the commercial Internet.
While low-level processor design aims for greater and greater integration, the dominant principle in soft-system architecture is theseparation of concerns. Today’s architypical design for network application services is the so-calledthree tier architecture: webserver, application, database (see Figure 1).
Service design based entirely on the program code would be a meaningless approach in today’s networked environments. A properly functioning system has to take into ac-count everything from the user experience to the basic resources that deliver on the service promises. Design considerations for services include:
• Correctness.
• Throughput and scalability.
• Latency (response time).
• Reliability.
• Fault tolerance.
• Disaster recovery.
10 M. Burgess Part 1
Fig. 1. A three tier architecture.
5.2. Scalability
Like security, scalability is a property of systems that researchers and designers like to claim or even boast, backed up with at best spurious evidence, as if the mere mention of the word could bring fortune. Like security, it has become a word to mistrust. Part of the problem is that very little attention has been given to defining what scalability means. This chapter is not the place for a comprehensive discussion of scalability, but we can summarize some simple issues.
Scalability is about characterizing the output of a system as a function of input (usually a task). The ability of a system to complete tasks depends on the extent to which the task can be broken up into independent streams that can be completed in parallel, and thus the topology of the system and its communication channels. Some simple ideas about scala-bility can be understood using the flow approximation of queueing systems (see chapter of System Administration and the Scientific Method in this volume) to see how the output changes as we vary the input.
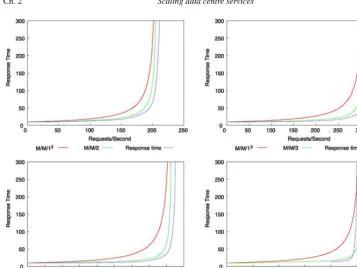
We shall think of scalability as the ability of a system to deal with large amounts of input, or more correctly, we consider how increasing the input affects the efficiency with which tasks are discharged at the output. This sounds somewhat like the problem posed in queueing theory. However, whereas queueing theory deals with the subtleties of random processes, scalability is usually discussed in a pseudo-deterministic flow approximation.
If we think of rain falling (a random process of requests) then all we are interested in over time is how much rain falls and whether we can drain it away quickly enough by introducing a sufficient number of drains (processors or servers). Thus scalability is usually discussed as throughput as a function of load. Sometimes the input is a function of a number of clients, and sometimes the output is a function of the number of servers (see Figure 2). There are many ways to talk about scaling behavior.
Ch. 2 Scaling data centre services 11
Fig. 2. The topology for low-level load sharing using a commercial dispatcher.
in performance, as a result of parallelizing part of the processing (load balancing) between
Nprocessors as:
S= tserial tparallel =
t (1)
t (N ). (1)
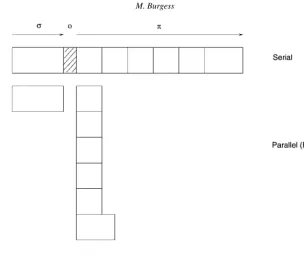
Suppose a task of total sizeσ +π, which is a sum of a serial part σ and a paralleliz-able partπ, is to be shared amongstN servers or processors and suppose that there is an overheadoassociated with the parallelization (see Figure 3). Amdahl’s law says that:
S= σ+π
σ+π/N+o. (2)
In general, one does not know much about the overheadoexcept to say that it is positive (o0), thus we write
S σ+π
σ+π/N. (3)
This is usually rewritten by introducing units of theserial fraction,f ≡σ/(σ+π ), so that we may write:
S 1
f +(1−f )/N. (4)
This fraction is never greater than 1/f, thus even with an infinite number of processors the task cannot be made faster than the processing of the serial part. The aim of any application designer must therefore be to make the serial fraction of an application as small as possible. This is called the bottleneck of the system.
12 M. Burgess Part 1
Fig. 3. Representation of Amdahl’s law. A typical task has only a fraction that is parallelizable. The serial part cannot be sped up using parallel processing or load balancing. Note that one is not always able to balance tasks
into chunks of equal size, moreover there is an overhead (shaded) involved in the parallelization.
• The serial fraction of the task.3
• The processor entropy or even-ness of the load balancing.
Amdahl’s law was written with High Performance Computing in mind, but it applies also to server load balancing for network services. If one thinks of an entire job as the sum of all requests over a period of time (just as drain-water is a sum of all the individual rain-drops) then the law can also be applied to the speed up obtained in a load-balancing architecture such as that shown in Figure 2. The serial part of this task is then related to the processing of headers by the dispatcher, i.e., the dispatcher is the fundamental limitation of the system.
Determining the serial fraction of a task is not always as straightforward as one thinks. Contention for dependent resources and synchronization of tasks (waiting for resources to become available) often complicates the simple picture offered by the Amdahl law.
Karp and Flatt [21] noted that the serial part of a program must often be determined empirically. The Karp–Flatt metric is defined as the empirically determined serial fraction, found be rearranging the Amdahl formula (4) to solve for the serial fraction.
f =S
−1−N−1
1−1/N . (5)
Ch. 2 Scaling data centre services 13
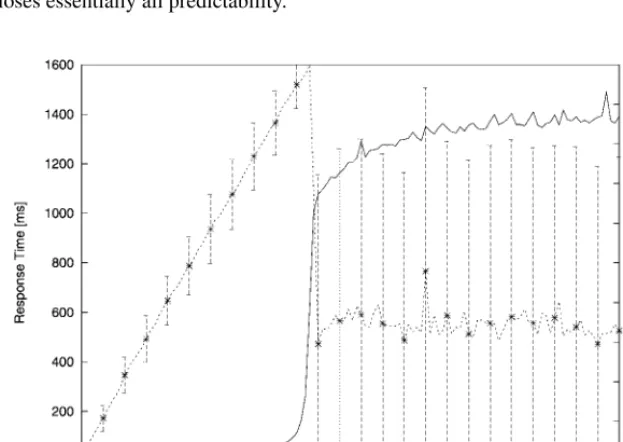
Here we assume no overhead (it will be absorbed into the final effective serial fraction). Note that, as the number of processors becomes large, this becomes simply the reciprocal of the measured speed up. This formula has no predictive power, but it can be used to measure the performance of applications with different numbers of processors. IfSis small compared toNthen we know that the overhead is large and we are looking for performance issues in the task scheduler.
Another way of looking at Amdahl’s law in networks has been examined in refs. [7,8] to discuss centralization versus distribution of processing. In network topology, serializa-tion corresponds to centralizaserializa-tion of processing, i.e. the introducserializa-tion of a bottleneck by design. Sometimes this is necessary to collate data in a single location, other times design-ers centralize workflows unnecessarily from lack of imagination. If a centralized server is a common dependency ofNclients, then it is clear that the capacity of the serverChas to be shared between theNclients, so the workflow per client is
W C
N. (6)
We say then that this architecture scales like 1/N, assumingC to be constant. AsN be-comes large, the workflow per client goes to zero which is a poor scaling property. We would prefer that it were constant, which means that we must either scale the capacityC
in step withN or look for a different architecture. There are two alternatives:
• Server scaling by load balancing (in-site or cross-site)C→CN.
• Peer-to-peer architecture (client-based voluntary load balancing)N→1.
There is still much mistrust of non-centralized systems although the success of peer to peer systems is now hard to ignore. Scaling in the data centre cannot benefit from peer to peer scaling unless applications are designed with it in mind. It is a clear case where application design is crucial to the scaling.
5.3. Failure modes and redundancy
To gauge reliability system and software engineers should map out the failure modes of (or potential threats to) the system [6,18] (see also the chapter on System Reliability in this volume). Basic failure modes include:
• Power supply.
• Component failure.
• Software failure (programming error).
• Resource exhaustion and thrashing.
• Topological bottlenecks.
• Human error.
14 M. Burgess Part 1
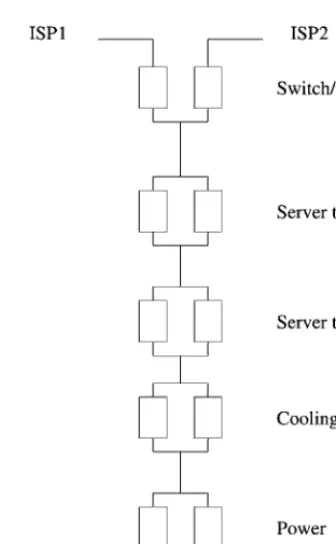
Fig. 4. Load balancing is a tricky matter if one is looking for redundancy. A load balancer is a tree – which is a structure with many intrinsic points of failure and bottlenecks.
Fig. 5. Redundancy folk theorem.
afterwards). This can cure some problems, but there might still be points of failure left over (Figure 4(b)). Ideally one tries to eliminate these through further redundancy, e.g., redundant Internet service provision, redundant power supplies, etc. One should not forget the need for human redundancy in this reckoning: human resources and competence are also points of failure. Redundancy is the key issue in handling quality of service: it answers the issues of parallelism for efficiency and for fault tolerance.
When planning redundancy, there are certain thumb rules and theorems concerning sys-tem reliability. Figure 5 illustrates the folk theorem about parallisms which says that re-dundancy at lower system levels is always better than rere-dundancy at higher levels. This follows from the fact that a single failure at a low level could stop an entire computing component from working. With low-level redundancy, the weakest link only brings down a low-level component, with high-level redundancy, a weakest link could bring down an entire unit of dependent components.
Ch. 2 Scaling data centre services 15
Fig. 6. Minimum strategy for complete redundancy.
Security is another concern that can be addressed in terms of failure modes. It is of-ten distinguished from system failure due to ‘natural causes’ by being a ‘soft failure’, i.e., a failure relative to a policy rather than continuation. The distinction is probably unneces-sary, as we can simply consider all failures relative to policy.
A secure system can be defined as follows [6]: A secure system is one in which all the risks have been identified and accepted as a matter of policy.See also the chapter by Bishop in this volume. This definition underlines the point that there is always an arbitrary threshold (or policy) in making decisions, about when faults are sufficiently serious to warrant a change of attitude, or a response.
An important enemy in system reliability ishuman error, either by mistake or incompe-tence. Human fault paths deal with many issues. Hostile parties expose us to risk through:
• Greed.
• Vanity.
• Bribery and blackmail.
• Revenge.
• Vandalism.
• Warfare.
Friends, on the other hand, expose us to risk by:
• Forgetfulness.
16 M. Burgess Part 1
• Confusion/stress/intoxication.
• Arrogance.
• Ignorance/carelessness.
• Slowness of response.
• Procedural errors.
• Inability to deal with complexity.
• Inability to cooperate with others.
The lists are long. It is also worth asking why such incompetence could be allowed to surface. Systems themselves are clearly at fault in many ways through:
• Design faults – inadequate specification.
• Run-time fault – system does not perform within its specification.
• Emergent faults – behavior that was not planned for or explicitly designed for, often provoked by the environment.
• Changing assumptions – about technology or the environment of the system, e.g., a system is designed for one scenario that becomes replaced by another.
Documentation of possible fault modes should be prioritized by their relative likelihood.
5.4. Safe and reliable systems
The construction of safe systems [5,6] is both controversial and expensive. Security has many interpretations, e.g., see ISO 17799 [3] and RFC 2196 (replacing RFC 1244), or The Orange Book Trusted Computer Security Evaluation Criteria (TSEC) (now somewhat dated).
Security, like fault analysis, begins with a threat evaluation. It includes issues from hu-man interface design to resistance to hostile actions. In all cases a preventative response is arisk reducing strategy.
There are many unhealthy attitudes to security amongst system designers and even ad-ministrators, e.g. ‘Encryption solves 90% of the world’s security problems’ as stated by a naive software analyst known to the author. Security is a property of complete systems, not about installable features. Encryption deals with only a risk of information capture, which is one part of a large problem that is easily dealt with. Encryption key management, on the other hand, is almost never addressed seriously by organizations, but is clearly the basis for the reliability of encryption as a security mechanism.
Just as one must measure fault issues relative to a policy for severity, security requires us to placetrust boundaries. The basis of everything in security is what we consider to be trustworthy (see the definition in the previous section). Technology can shift the focus and boundaries of our trust, but not eliminate the assumption of it. A system policy should make clear where the boundaries of trust lie. Some service customers insist on source code-review of applications as part of their Service Agreement. Threats include:
• Accidents.
• Human error, spilled coffee, etc.
• Attacks.
• Theft, spying, sabotage.
Ch. 2 Scaling data centre services 17
• Human–computer interfaces.
• Software functionality.
• Algorithms.
• Hardware.
• Trust relationships (the line of defense).
Restriction of privilege is one defense against these matters. Access is placed on a ‘need to know/do’ basis and helps one to limit the scope of damage. System modelling is an important tool in predicting possible failure modes (see chapters on System Administration and the Scientific Method by the author, and the chapter on Security Management and Policies by Bishop).
In short, a well-designed system fails in a predictable way, and allows swift recovery.
6. Data centre design
The data centre is a dry and noisy environment. Humans are not well suited to this envi-ronment and should try to organize work so that they do not spend more time there than necessary. Shoes and appropriate clothing shall be worn in data centres for personal safety and to avoid contaminating the environment with skin, hair and lost personal items. Un-authorized persons should never be admitted to the data centre for both safety and security reasons.
Data centres are not something that can be sold from a shelf; they are designed within the bounds of a specific site to cope with a specific tasks. Data centres are expensive to build, especially as performance requirements increase. One must consider power supply, cooling requirements, disasters (flooding, collision damage, etc.) and redundancy due to routine failure. This requires a design and requirement overview that companies rarely have in advance. The design process is therefore of crucial importance.
It is normal for inexperienced system administrators and engineers to underestimate the power and cooling requirements for a data centre. Today, with blade chassis computers and dense rack mounting solutions it is possible to pack even more computers into a small space than ever before, thus the density of heat and power far exceeds what would be required in a normal building. It is important to be able to deliver peak power during sudden bursts of activity without tripping a fuse or circuit-breaker.
With so much heat being generated and indeed wasted in such a small area, we have to think seriously in the future about how buildings are designed. How do we re-use the heat? How can cooling be achieved without power-driven heat-exchangers?
6.1. Power in the data centre
18 M. Burgess Part 1
Every electrical device generates heat, including cooling equipment. Electrical power is needed to make computers run. It is also needed for lighting and cooling. Once power needs have been estimated for computers, we might have to add up to 70% again for the cost of cooling, depending on the building. In the future buildings could be designed to avoid this kind of gratuitous compounding of the heat/energy problem with artificial air-conditioning by cooling naturally with underground air intakes.
Power consumption is defined as the flow of energy, per unit time, into or out of a system. It is measured in Joules per second, or Watts or Volt-Amperes, all of which are equivalent in terms of engineering dimensions. However, these have qualitatively different interpretations for alternating current sources.
Computers use different amounts of electrical current and power depending on where they are located. Moreover, since electricity companies charge by the current that is drawn rather than the power used, the current characteristics of a device are important as a poten-tial source of cost saving.
Electronic circuitry has two kinds of components:
• Resistive componentsabsorb and dissipate power as heat. They obey Ohm’s law.
• Reactive componentsabsorb and return energy (like a battery), by storing it in electro-magnetic fields. They include capacitors (condensers) and inductors (electro-electro-magnetic coils).
Reactive components (inductors and capacitors) store and return most of the power they use. This means that if we wait for a full cycle of the alternating wave, we will get back most of what we put in again (however, we will still have to pay for the current). Resistive components, on the other hand, convert most of the energy going into them into heat.
In direct current (DC) circuits, the power (energy released per unit time) is simply given by P =I V, whereI is the constant current and V is the constant voltage. In a device where a DC current can flow, reactive components to not have an effect and Ohm’s law applies:V =I R, whereRis the electrical resistance. In this case, we can write
P =I V=I2R=V 2
R . (7)
For an alternating current (wave) source, there are several cases to consider however. Ohm’s law is no longer true in AC circuits, because capacitors and inductors can bor-row power for a short time and then return it, like a wave shifting pebbles on a beach. The voltage and current are now functions of time:I (t ), V (t ). The instantaneous power con-sumption (the total energy absorbed per unit time) is stillP =I V =I (t )V (t ). However, mains power is typically varying at 50–60 Hz, so this is not an true reflection of the long term behavior, only what happens on the scale of tenths of a second.
For a system driven by a single frequency (clean) wave, the short term borrowing of current is reflected by a phase shift between the voltage (wave) and the current, which is the response of the system to that driving force (pebbles). Let us call this phase shiftφ.
V (t )=V0sin(2πf t ),
(8)
Ch. 2 Scaling data centre services 19
wheref is frequency andT =1/f is the period of the wave. We can compute the average power over a number of cyclesnT by computing
Pφ=
1
nT
nT
0
I (t ) V (t )dt. (9)
We evaluate this using two trigonometric identities:
sin(A+B)=sinAcosB+cosAsinB, (10) sin2X=1
2(1−cos 2X) (11)
Using the first of these to rewriteI (t ), we have
P =I0V0 nT nT 0 sin2
2πt T
cosφ+sin
2πt T
cos
2πt T
sinφ
dt. (12)
Rewriting the first term with the help of the second identity allows us to integrate the expression. Most terms vanish showing the power that is returned over a whole cycle. We are left with:
Pφ=
1
2I0V0cosφ. (13)
In terms of the normally quoted root-mean-square (RMS) values:
Vrms=
1 nT nT 0
V (t ) 2. (14)
For a single frequency one has simply:
Vrms=V0/
√
2,
(15)
Irms=I0/
√
2,
Pφ=IrmsVrmscosφ. (16) The RMS values are the values returned by most measuring devices and they are the values quoted on power supplies. The cosine factor is sometimes called the ‘power factor’ in electrical engineering literature. It is generalized below. Clearly
Pφ>0Pφ=0. (17)
20 M. Burgess Part 1
6.2. Clipped and dirty power
A direct calculation of the reduction in power transfer is impractical in most cases, and one simply defines a power factor by
PF=cosφ≡ P IrmsVrms
. (18)
More expensive power supply equipment is designed with ‘power factor corrected’ elec-tronics that attempt to reduce the reactance of the load and lead to a simpleφ=0 behavior. The more equipment we put onto a power circuit, the more erratic the power factor is likely to be. This is one reason to have specialized power supplies (incorporated with Uninter-ruptible Power Supplies (UPS)).
Actual data concerning power in the computer centres is hard to find, so the following is based on hearsay. Some authors claim that power factors of cosφ=0.6 have been ob-served in some PC hardware. Some authors suggest that a mean value of cosφ=0.8 is a reasonable guess. Others claim that in data centres one should assume that cosφ=1 to correctly allow for enough headroom to deal with power demand.
Another side effect of multiple AC harmonics is that the RMS value of current is not simply 1/√2=1/1.4 of the peak value (amplitude). This leads to a new ratio called the ‘crest factor’, which is simply:
Crest= I0
Irms
. (19)
This tells us about current peaking during high load. For a clean sinusoidal wave, this ratio is simply√2=1.4. Some authors claim that the crest factor can be as high as 2–3 for cheap computing equipment. Some authors claim that a value of 1.4–1.9 is appropriate for power delivered by a UPS. The crest factor is also load dependent.
6.3. Generators and batteries
Uninterruptible Power Supplies (UPS) serve two functions: first to clean up the electrical power factor, and second to smooth out irregularities including power outages. Batteries can take over almost instantaneously from supply current, and automatic circuit breakers can start a generator to take over the main load within seconds. If the generator fails, then battery capacity will be drained.
UPS devices require huge amounts of battery capacity and even the smallest of these weighs more than a single person can normally lift. They must be installed by a competent electrician who knows the electrical installation details for the building.
Ch. 2 Scaling data centre services 21
6.4. Cooling and airflow
Environmental conditions are the second design priority in the data centre. This includes cooling and humidity regulation. Modern electronics work by dumping current to ground through semi-conducting (resistive) materials. This is the basic transistor mode of opera-tion. This generates large amounts of heat. Essentially all of the electrical power consumed by a device ultimately becomes heat.
The aim of cooling is to prevent the temperature of devices becoming too great, or changing too quickly. If the heat increases, the electrical and mechanical resistance of all devices increases and even more energy is wasted as heat. Eventually, the electrical properties of the materials will become unsuitable for their original purpose and the device will stop working. In the worst case it could even melt.
Strictly speaking, heat is not dangerous to equipment, but temperature is. Temperature is related to the density of work done. The more concentrated heat is, the higher the tem-perature. Thus we want to spread heat out as much as possible.
In addition to the peak temperature, changes in temperature can be dangerous in the data centre. If temperature rises or falls too quickly it can result in mechanical stress (expansion and contraction of metallic components), or condensation in cases of high humidity.
• Polymer casings and solder-points can melt if they become too hot.
• Sudden temperature changes can lead to mechanical stresses on circuits, resulting in cracks in components and circuit failures.
• Heat increases electrical and mechanical resistance, which in turn increases heat pro-duction since heat power conversion goes like∼I2R.
Air, water and liquefied gases can be used to cool computing equipment. Which of these is best depends on budget and local environment. Good environmental design is about the constancy of the environment. Temperature, humidity, power consumption and all variables should be evenly regulated in space and time.
6.5. Heat design
Cooling is perhaps the most difficult aspect of data centre design to get right. The flow of air is a complicated science and our intuitions are often incorrect. It is not necessarily true that increasing the amount of cooling in the data centre will lead to better cooling of servers.
Cooling equipment is usually rated in BTUs (British Thermal Units), an old fashioned measurement of heat. 1 Watt=3413 BTUs. A design must provide cooling for every heat generating piece of equipment in the data centre, including the humans and the cooling equipment itself. Temperature must be regulated over both space and time, to avoid gra-dient effects like condensation, disruptive turbulence and heat-expansion or contraction of components.
like-22 M. Burgess Part 1
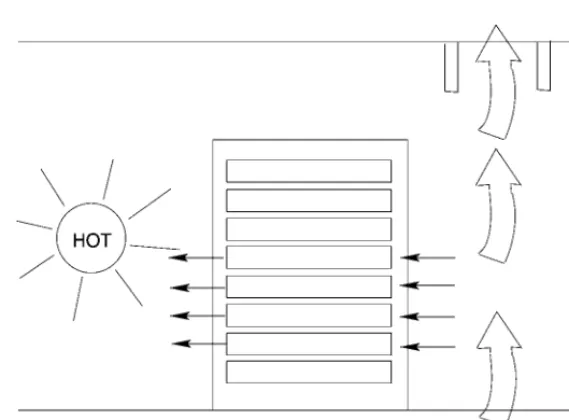
Fig. 7. A bad cooling design. Too much cold air comes through the floor, driving all the cold air past the racks into the extractor instead of passing through them. This leaves hot spots and wastes most of the cooling capacity.
lihood with increasing humidity and is both harmful to the computing equipment and can even lead to bacterial growth which is a health hazard (e.g., Legionnaires disease).
If air moves too quickly past hot devices, it will not have time to warm up and carry away heat from hot spots; in this case, most of the air volume will simply cycle from and back to the cooling units without carrying away the heat. If air moves too slowly, the temperature will rise. (See Figures 7 and 8.)
As everyone knows, hot air rises if it is able to do so. This can be both a blessing and a curse. Raised flooring is a standard design feature in more advanced data centres which allows cool air to come up through holes in the floor. This is a useful way of keeping air moving in the data centre so that no hot spots can develop. However, one should be careful not to have cold air entering too quickly from below, as this will simply cause the hot air to rise into the roof of the centre where it will be trapped. This will make some servers too hot and some too cold. It can also cause temperature sensors to be fooled into misreading the ambient temperature of the data centre, causing energy wastage from over cooling, or over regulation of cooling.
Ch. 2 Scaling data centre services 23
Fig. 8. A good cooling design. A trickle cold air comes through the floor, spreading out near the racks into the room where has time to collect heat. The air circulates from the cold aisle into the warm aisle where it is extracted
and recycled.
6.6. Heat, temperature and humidity
Heat and temperature are related through the specific heat capacity (symbolcs, also called
specific heat) of a substance is defined as heat capacity per unit mass. The SI unit for specific heat capacity is the Joule per kilogramme Kelvin, J kg−1K−1or J/(kg K), which is the amount of energy required to raise the temperature of one kilogram of the substance by one Kelvin. Heat capacity can be measured by using calorimetry.
For small temperature variations one can think of heat capacity as being a constant prop-erty of a substance, and a linear formula for the relates temperature and heat energy.
Q=mcsT , (20)
whereQis a change of heat energy (Watts×time). In other words temperature increase
T, in a fixed massmof any substance, is proportional to the total power output and the time devices are left running.
If air humidity is too high, it can lead to condensation on relatively cool surfaces. Al-though a small amount of clean, distilled water is not a serious danger to electrical equip-ment, water mixed with dust, airborne dirt or salts will conduct electricity and can be hazardous.
24 M. Burgess Part 1
than 30% humidity, there is a risk of static electrical discharge, causing read errors or even unrecoverable runtime failures.
Heat is transmitted to and from a system by three mechanisms:
• Conductionis the direct transfer of heat by material contact (molecular vibration). For this, we use the heat capacity formula above.
• Convectionis a transport of gas around a room due to the fact that, as a gas is heated its density decreases under constant pressure, so it gets lighter and rises. If the hot air rises, cooler air must fall underneath it. This results in a circulation of air called convection. If there is not enough space to form convection cells, hot air will simply sit on top of cold air and build up.
• Radiationis the direct transfer of heat without material contact. Electromagnetic radi-ation only passes through transparent substances. However, a substance that is trans-parent to visible light is not necessarily transtrans-parent to heat (infra-red), which has a much longer wavelength. This is the essence of the Greenhouse effect. Visible light can enter a Greenhouse through the glass walls, this energy is absorbed and some of the energy is radiated back as heat (some of it makes plants grow). However not all of the long wavelength heat energy passes through the glass. Some is absorbed by the air and heats it up. Eventually, it will cool off by radiation of very long wavelengths, but this process is much slower than the rate at which new energy is coming in, hence the energy density increases and temperature goes up.
If a material is brought into contact with a hotter substance, heat will flow into it by conduc-tion. Then, if we can remove the hotter substance e.g. by flow convection, it will carry the heat away with it. Some values ofcs for common cooling materials are shown in Table 1.
Water is about four times as efficient at carrying heat per degree rise in temperature than is air. It is therefore correspondingly better at cooling than air.
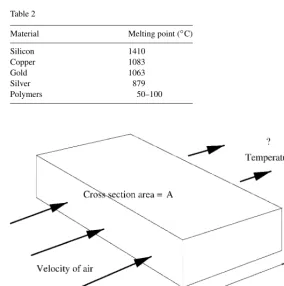
Melting temperatures in Table 2 show that it is not likely that data centre heat will cause anything in a computer to melt. The first parts to melt would be the plastics and polymers and solder connections (see Table 2).
Today’s motherboards come with temperature monitoring software and hardware which shuts the computer off the CPU temperature gets too hot. CPU maximum operating tem-peratures lie between 60 and 90◦C.
Table 1
Substance Phase Specific heat capacity (J/(kg K))
Air (dry) gas 1005
Air (100% humidity) gas 1030
Air (different source) gas 1158
Water liquid 4186
Copper (room temp) solid 385
Gold (room temp) solid 129
Ch. 2 Scaling data centre services 25
Table 2
Material Melting point (◦C)
Silicon 1410
Copper 1083
Gold 1063
Silver 879
Polymers 50–100
Fig. 9. Schematic illustration of air flowing through and around a rack device.
6.7. Cooling fans
Fans are place in computers to drive air through them. This air movement can also help to keep air circulating in the data centre. Rack doors and poorly placed fans can hinder this circulation by generating turbulence.
Cooling fans exploit the same idea as convection, to transport energy away by the actual movement of air (or sometimes fluid). The rate of flow of volume is proportional to the fixed area of the channel cross-section and the length per unit time (velocity) of the coolant passing through it.
dV
dt ∝A
dx
dt, (21)
F ∝Av. (22)
You should bear in mind that:
26 M. Burgess Part 1
• The temperature of the air coming out depends on many factors, including the ambient temperature around the box, the rate of air flow through the device and around it, the amount of convection in and around the device, humidity etc.
• Air is a poor carrier of heat, so if air is getting hot, you know that the metallic com-ponents are sizzling! Also, air is a good insulator so it takes some time to warm up. If air moves too fast, it will not carry away the heat.
In very high speed computers that generate large amounts of heat quickly, liquids such as water and nitrogen are use for cooling, piped in special heat exchangers. The density of a liquid means that it is able to carry much more heat, and hence a smaller flow is needed to carry a larger amount of waste power. Water-based cooling is many times more expensive than air-cooling.
6.8. Placement of cooling flow ducts
The use of raised flooring is common in datacentres. Cold air usually passes underneath raised flooring from compressors and escapes into the data centre through holes in the floor. If cold air rose from everywhere quickly and evenly, hot air would simply rise to the roof and there would be no circulation (see Figure 7). A standard strategy to maintain convectional circulation is to limit the number of holes in flooring to prevent air from circulating too quickly, and the have alternating hot and cold aisles. In a cold aisle, there are holes in the floor. In a hot aisle there are no holes in the floor, but there are cooling intakes (see Figure 8).
To ensure sufficient circulation, there should be at least ten centimetres of clearence between racks in the roof and computer racks should not be within a metre or more of cooling units.
6.9. Fire suppression
A data center fire suppression system uses gas rather than water or foam. There are many gaseous suppression systems that use gases hazardous to humans and environment and are therefore unsuitable. The gas used to suppress the fire should not be toxic to people nor damage the equipment causing data to be lost. Inergen and Argonite are both gasses com-monly used in data centers. Inergen is a gaseous mixture composed of nitrogen, argon and carbon dioxide. Argonite is a gas composed of argon and nitrogen. Since the fire suppres-sion systems is based on gas one should make sure that in case of gas release there is no leakage to the outside.
6.10. Tier performance standards
Ch. 2 Scaling data centre services 27
data center. A system is as good as the weakest link and hence terms like ‘near 4 Tier’ or ‘Tier 3 plus’ do not exist.
The ratings use the phrasescapacity componentsanddistribution paths. Capacity com-ponents are active comcom-ponents like servers which deliver the service provided by the data centre. Distribution paths refer to communication infrastructure, such as network.
The Tier 1 describes a basic site, i.e., a non-redundant data center. Communication paths, cabling, power and cooling are non-redundant, the computer system is affected by a com-ponent failure and the system has to be shut down to do maintaince work.
Tier 2 describes a data center that has redundant capacity components, but non-redundant distribution paths. The computer system might be affected by a capacity com-ponent failure, and will certainly be affected by a path failure. The system might be inop-erative during maintenance work.
Tier 3 describes a concurrently maintainable data center. In other words, the data center is equipped with redundant capacity components and multiple distribution paths (of which one is always active). The computer system will not be affected either in case of a capacity component failure or path failure and does not require shutdown to do maintaince work, but interruptions could occur.
Tier 4 describes a fault tolerant data center. In other words, the data center is equipped with redundant capacity component sand multiple distribution active paths. The computer system will not be affected of any worst-case failure of any capacity system or distribution element and does not require to be shut down to do maintaince work, no interruptions may occur.
7. Capacity planning
Simple results from queueing theory can be used as estimators of the capacity needs for a system [2,9]. Most service delivery systems are I/O bound, i.e. the chief bottleneck is input/output. However, in a data centre environment we have another problem that we do not experience on a small scale: power limitations.
Before designing a data center we need to work out some basic numbers, the scales and sizes of numbers involved.
• How fast can we process jobs? (CPU rate and number of parallel servers.)
• How much memory do we need: how many jobs will be in the system (queue length) and what is the average size of a job in memory?
• How many bytes per second of network arrivals and returns do we expect?
• How many bytes per second of disk activity do we expect?
• What is the power cost (including cooling) of running out servers?
7.1. Basic queueing theory
28 M. Burgess Part 1
mean rate ofλtransactions per second, and they are added to a queue, whereupon they are serviced at a mean rateμtransactions per second by a processor.
Generalizations of this model include the possibility of multiple (parallel) queues and multiple servers. In each case one considers a single incoming stream of transaction re-quests; one then studies how to cope with this stream of work.
As transaction demand is a random process, queues are classified according to the type of arrival process for requests, the type of completion process and the number of servers. In the simplest form, Kendall notation of the form A/S/n is used to classify different queueing models.
• A: the arrival process distribution, e.g., Poisson arrival times, deterministic arrivals, or general spectrum arrivals.
• S: the service completion distribution for job processing, e.g., Poisson renewals, etc.
• n: the number of servers processing the incoming queue.
The basic ideas about queueing can be surmised from the simplest model of a single server, memoryless queue:M/M/1 (see chapter by Burgess, System Administration and the Scientific Method in this volume).
Queues are described in terms of the statistical pattern of job arrivals. These processes are often approximated by so-called memoryless arrival processes with mean arrival rateλ
jobs per second and mean processing rateμjobs per second. The quantityρ=λ/μ <1 is called the traffic intensity [6,19]. The expected length of the simplestM/M/1 queue is
n =
∞
n=0 pnn=
ρ
1−ρ. (23)
Clearly as the traffic intensityρapproaches unity, orλ→μ, the queue length grows out of control, as the server loses the ability to cope.
The job handling improves somewhat for s servers (here represented by the M/M/s
queue), where one finds a much more complicated expression which can be represented by:
n =sρ+P (ns) ρ
1−ρ. (24)
The probability that the queue length exceeds the number of serversP (ns)is of order
ρ2for small loadρ, which naturally leads to smaller queues.
It is possible to show that a single queue withsservers is always at least as efficient as
sseparate queues with their own server. This satisfies the intuition that a single queue can be kept moving by any spare capacity in any of itssservers, whereas an empty queue that is separated from the rest will simply be wasted capacity, while the others struggle with the load.
7.2. Flow laws in the continuum approximation