Design and Development of Low Speed Probe
Calibration Wind Tunnel
Arjun Garg, Dhaivat Dholakiya, Suyash Pandya
U.G. Student, Department of Mechanical Engineering, Institute of Technology, Nirma University, Gujarat, India
* Corresponding Author
ABSTRACT: Based on a numerical study of the potential flow through contractions of chosen geometry, a method is given to obtain the shape of contraction which gives small adverse pressure gradients and low non uniformity in the velocity distribution at the exit. From the literature that we have read, we concluded that It may be observed that, due to large acceleration, nozzles with large contraction ratios are tolerant to any irregularities at the low velocity end, such as separation-induced thick boundary layers and unsteadiness. On the other hand, nozzles with smaller CR (say 4 or 5) demand greater attention to be given to avoid separation. Thus,a contraction with area ratio of eight is taken and designed using two and three degrees equations of and is investigated experimentally. There are two criteria which have to be satisfied at the narrow end of a nozzle: the maximum acceptable flow nonuniformity and the avoidance of separation. In most practical cases,the nonuniformity, will be required to be no more than 2 percent.
It is found that there is no separation of flow, the thickness of the boundary layer at the exit is small and the non-uniformity in velocity at the exit is small. The procedure consists of first computing the potential flow field and hence the pressure distributions along the walls of a contraction of given size and shape. Thus, an iterative design procedure has been followed to construct a small, low-speed wind tunnel.
KEYWORDS: Wind blow Tunnel, Wind Nozzle, Air blower.
I. INTRODUCTION
The report describes the design and construction of a low speed probe calibration tunnel. This instrument is designed to collect low speed airflow measurements, pressures and velocities from a probe over a range of pitch and yaw angles. The duct sections of the assembly consist of an intake, settling section, contraction section, diffuser section, and the blower. The test section is fabricated for flow visualization and use of appropriate instrumentation and fixtures for data acquisition in a wide range of experiments. The functions are used to teach applied fluid mechanics, demonstrate how mathematical models compare to experimental results, demonstrate flow patterns, and learn and practice the use of instruments in measuring flow characteristics such as velocity, pressures, and torques. There are other uses of wind tunnels which vary from ordinary to special: these include uses for Subsonic, supersonic and hypersonic studies of flight; for propulsion and icing research; for the testing of models and full-scale structures, etc. The final design and construction of the velocity probe calibration tunnel are discussed with the aim of illustrating how this project was carried out
II. RELATEDWORK
Sargison & Walker [Design and calibration of a wind tunnel with a two dimensional contraction]
The research helped us solve the analysis in 2 dimensions. This also helped us realise the significance of CFD as CFD has been used to optimise the design of a wind tunnel contraction.
The use of CFD has increased the flexibility of shapes considered, and allowed the use of a sixth order polynomial to define the profile.
Fig 2.1.1 velocity profile
The figure 2.1.1 is the best result, producing the most uniform velocity profile at inlet to the working section, and preventing separation of the flow within the contraction, was obtained when the point of inflection was located as far downstream as possible.
Thus, our analysis also focussed on preventing separation of flow within the contraction.
Siddique [Design, Development and CFD Validation of a Subsonic Wind Tunnel]
This paper gave the direction to use the setup of Fluent solver and design criteria the researcher used for designing the tunnel. It gave us the theory behind the turbulence model as it stated that Governing equations for mass and momentum for subsonic flow along with the equations for turbulence and porous flow are to be solved using RNG k -epsilon turbulence model.
Fig 2.1.2 Assembly drawing of wind tunnel
The figure 2.1.2 is the drawing of the final design of their subsonic wind tunnel which they designed. K-epsilon turbulence model is the simplest complete model in which the solution of two separate transport equations allows the turbulence velocity and length scales are determined. This semi-empirical model based on equations for the turbulence kinetic energy (k) and its dissipation rate (epsilon) that assumes fully turbulent flow.
2. Construction of Nozzle
Tulapurkara & Bhalla [Experimental Investigation of Morel's Method for Wind Tunnel Contractions]
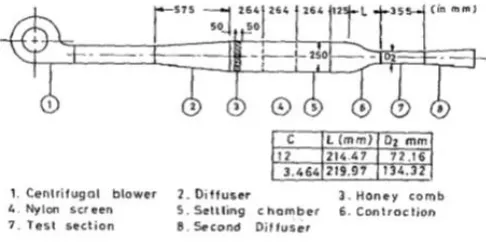
Fig 2.2.1 Contraction shapes as obtained by morel’s method
This research helped us obtained the shape of nozzle. The contraction ratio that we have chosen is 8 (in contrast to the contraction ratios chosen by them). The research also gave us the broad view of the final setup which is to be constructed. The figure attached below is the experimental setup of their final assembly.
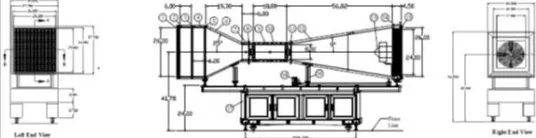
Fig 2.2.2 Morel’s experimental setup
The fig. 2.2.2 depicts the experimental setup from Morel’s experiment. It describes the components of the exp. setup. It consists of the blower, set of diffusers the settling chamber as well the contraction throat of the pertinent setup. This setup was intuitively helpful in the selection of the components to be used in our research.
This is another research which channelled us in the right direction. This research gave us the idea of the probes placement. Moreover, the paper concluded with the final design which consisted of several key components, including a probe manipulator with two rotational degrees of freedom, a blower-type flow channel with an axial flow fan, and a drive shaft system powered by a treadmill motor. The probe manipulator was designed for a ±79 degree range in pitch, a ±85 degree range in yaw, and a degree turning accuracy. It was also designed to be compatible with both pressure and hot wire probes. The achieved ranges in pitch and yaw were on par with the ranges of other devices described in the literature, but were slightly below the ±90 degrees described in the project objectives. The drive system for the axial flow fan was designed with the ability to produce a test section flow velocity of 55 mps, which satisfied the maximum flow velocity objective for the rig.
The mechanical drawings helped us in modifying our setup according to our application. The design of chamber made is cylindrical.
Morel [Comprehensive Design of Axisymmetric Wind Tunnel Contractions]
The concept of match point mentioned in this research paved us to obtain the final shape of nozzle. The research describes the generation of match point after joining two equations of different degrees smoothly. Thus, the research stated that the one parameter family of wall shapes formed of two smoothly joined cubics (with the match point location X as the parameter) is a suitable choice for a wall contour. It is very efficient— it achieves the prescribed Cp's
within a relatively short nozzle length L.
III. DESIGNANDDEVELOPMENTOFCOMPONENTS
Nozzle:
In the tunnel, one can carefully control the flow conditions which affect mass flow rate, velocity, temperature at the exit. Our calibration tunnel is designed for a specific purpose and speed range. The engineers operate the tunnel from a control valve.
The scope of work includes, design and preparation of suitably scaled calibration tunnel model.
A method to obtain the shape of contraction is given which gives small adverse pressure gradients and low non uniformity in the velocity distribution at the exit. Contraction with area ratio of 8 is designed using this method and is investigated experimentally. It is found that there is no separation of flow, the thickness of the boundary layer at the exit is small and the non-uniformity in velocity at the exit is smaller than the predicted value. Low open area screens usually create instabilities. The contraction area is perhaps the most important part of a wind tunnel’s design. Its main purpose is to make the flow more uniform. It also increases the flow at the test section, which allows flow conditioning devices to be at lower flow section with less pressure drop.
practical contractions, which are of finite length, one finds that (i) adverse pressure gradients are present at the ends of the contraction, (ii) the axial velocity is higher than the velocity near the wall at the entry to the contraction and (iii) at the exit the velocity near the wall (i.e., outside the boundary layer) is higher than that on the axis. Thus for a good performance the nozzle contour should give low adverse pressure gradients at the ends of contraction so that no separation of flow takes place, the boundary layer thickness at the exit should be small and the non-uniformity in the velocity distribution at the exit (i.e. difference between velocity near the wall and that on the axis) must be small. A good contour should achieve these with a small length (Z,) to upstream diameter (D1) ratio.
The nozzle contour is obtained by two power-law curves matched at a point xm and having their apexes at either ends of the contraction. During preliminary trials he finds that the cubic curves give the best results. Potential flow inside the contour is computed for values of contraction ratio (c) ranging from 6 to 14, the ratio L/Dx from 0.5 to 1.25 and the ratio X (=xm/L) from 0.1 to 0.5.
The equations used in plotting the contour of nozzle are obtained by two power-law curves which are matched at a point xm (having their apexes at either ends of the contraction):
Hence,
D=D2+(D1-D2)(1-X)2 X (1-x)3 or D=D2+(D1-D2)(1-X)2 X (x)3
Here,
D1: Inlet diameter X: (xm)/L D2: Outlet diameter L: length x: distance on x axis
c: Contraction Ratio (A2/A1)
THEORETICAL DIMENSIONS: ACTUAL DIMENSIONS:
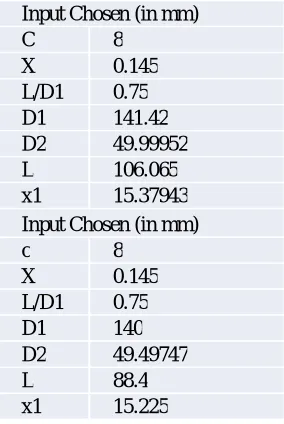
Input Chosen (in mm)
C 8 X 0.145 L/D1 0.75 D1 141.42 D2 49.99952 L 106.065 x1 15.37943
Input Chosen (in mm)
c 8 X 0.145 L/D1 0.75 D1 140 D2 49.49747 L 88.4 x1 15.225
Table 3.1.1 & 3.1.2 Comparison :Theoretical and Actual Dimensions of Nozzle
The ratio L/D1 and X are obtained by hit and trial method and by observing where the two contours will join each other smoothly.
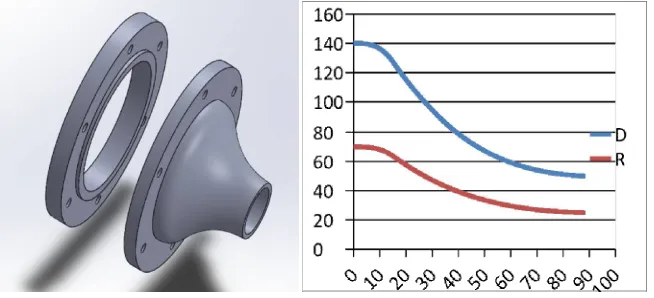
Fig 3.1.1 (a) Contraction Shape of Nozzle (D vs L) (b) 3-D CAD Model of Proposed Nozzle
Here, in Fig. 3.1.1(a) the contraction shape of the proposed nozzle is shown. This curve can be construed as the cylindrical symmetric cross section of the nozzle, or else the generating profile contour of the proposed nozzle. Using this profile a 3-D CAD model of the nozzle is prepared, which is shown in the Fig 3.1.1(b).
Settling chamber
In such types of tunnels we want to generate uniform air flows, with low turbulence intensity. Functions:
To achieve uniform, high quality flow in the test section, the settling chamber and the contraction area are used to smooth the flow.
The role of the settling chamber, which is upstream of the contraction area, is to eliminate swirl and unsteadiness from the flow.
The shape is such that it has to break up large eddies into smaller ones.
The shape designed will have lower turbulence and the flow is more uniform eventually.
The CFD simulation of vessel with nozzle helped us reach the dimension of chamber which can be manufactured. CFD analysis gave us the detailed view of the air flow through the chamber and its flow outside it. The flow of air outside the nozzle helped us track velocity profile. The design of chamber is made in Ansys itself. The co-ordinates file which is prepared in notepad. It has been imported in Ansys-Fluent. The separate groups have been created for each curve- be it a straight line or any curve. The numerous iterations which are carried out are shown.
Fig 3.1.2 (a) Pressure Contour of Proposed tunnel and nozzle (b) Pressure Contour of Proposed tunnel and nozzle
The analysis is done by importing a 2D sketch, and further creating a surface in Ansys. The reason why 2D is chosen is as the component is symmetrical throughout the results obtained can be inferred directly for the whole component.
i. The contour plots of velocity are shown which gave us a broad view of eddy formations (the place where sudden changes in velocity is observed) and velocity at each and every point.
ii. The streamline plots of velocity are also shown below which gave us the broad view of path lines through which air will flow.
Out of the numerous iterations which have been carried out, some of them have been plotted before arriving at the final shape of the tunnel. The shapes obtained below are discarded as:
a. The flow achieved is not uniform and smooth.
b. The swirls are not eliminated and unsteadiness can be easily seen in some of the figures from the flow. c. The shape is not that it is breaking up large eddies into smaller ones at sharper edges.
d. The shape designed does not have lower turbulence and the flow is not uniform eventually.
Fig 3.1.3 (a) Nozzle Tunnel Assembly
The Fig. 3.1.3 shows the manufactured and the assembled tunnel and the nozzle assembly with the saddle attached by welding at the bottom of the tunnel. This assembly in turn will be connected to the main table frame along with the selected air blower and other piping accessories. The selection procedure of the reqired air blower is described as below.
Selection of Air Blower
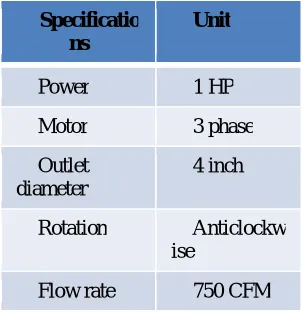
the settling chamber with air velocity of 35 m/s, the blower is selected accordingly. The flow rate of blower corresponding to this velocity is 750 CFM
Specificatio ns
Unit
Power 1 HP
Motor 3 phase
Outlet diameter
4 inch
Rotation Anticlockw
ise
Flow rate 750 CFM
Table 3.1.2 Specifications of the Air Blower
As the velocity will be varied according with the help of two valves, thus the contour and velocity plots are obtained and shown below. Thus the velocity is varied from 35m/s to 10 m/s. The 2 inch valve is used for minute control
Fig 3.1.4 (a) Blower (b) Final Assembly
The figures above depicts the images of the blower (fig. 3 (a)) and the final assembly containing the developed tunnel, the selected blower as well the nozzle attached to the tunnel.
IV. CONCLUSION
A low speed, open circuit, sub-sonic wind tunnel has been designed for a particular velocity. The air velocity and pressures were measured using Pitot tube and three manometers. CFD analysis was performed using a commercial CFD software Fluent. The measured pressure drop and velocities were compared with CFD analysis results showing reasonable agreement.
This report outlines the process of design optimisation, using Computational Fluid Dynamics (CFD) to model the contraction. The parameters that were varied were the location of the point of inflection, the angles at which sides of tunnel are inclined, length of tunnel, the flow rate of blower, and the curvature at the contraction nozzle. The optimisation was based on flow uniformity throughout the component, prevention of separation in the contraction and minimising the boundary layer thickness at entrance to the working section.
Calibration of the wind tunnel after construction has been done by using three hole probe transverse mechanism and the value of the design process are to be validated which should satisfactorily comply with CFD predictions.
REFERENCES
1. A. Abdelhamed, Y. Yassen, & M. Elsakka (2015). Design optimization of three dimensional geometry of wind tunnel contraction. Ain Shams Engineering Journal, 6(1), 281-288.
2. S. Siddique. Design, Development and CFD Validation of a Subsonic Wind Tunnel. 3. J.H.Bell and R.D. Mehta, Boundary Layer Predictions for Small Low Speed Contraction. 4. J. N. Libii, Wind Tunnels in Engineering Education.
5. Morel , Thomas . "Design of Two-Dimensional Wind Tunnel Contractions." Journal of Fluids Engineering 99.2 (1977): 371. 6. J.E. Sargison, G.J. Walker, R. Rossi. Design and calibration of a wind tunnel with a two dimensional contraction.