Numerical Study on Improvement of COP of
Vapour Compression Refrigeration System
Sanath Kumar K H1, Arun Kumara K S2, Nissar Ahmed3
Assistant Professor, Department of Mechanical Engineering, VVIT, Bangalore, Karnataka, India1
P.G. Student, Department of Mechanical Engineering, NMIT, Bangalore, Karnataka, India2
Principal, Government ITI College, Tumkur, Karnataka, India3
ABSTRACT:Refrigeration is a process of cooling or reducing the temperature of a substance below that of the surrounding atmosphere and maintaining this lower temperature within the boundary of a given space. To improve the coefficient of performance (COP), it is require decreasing the compressor work and increasing the refrigerating effect. Experimental analysis on vapour compression refrigeration (VCR) system with R134A (tetra fluoro ethane) refrigerant was done and their results were recorded. The effects of the main parameters of performance analysis are mass flow rate of refrigerant, suction pressure of compressor, delivery pressure of compressor, temperature of evaporator and condenser. The result from vapour compression refrigerant plant was taken where the variables like suction pressure of compressor, delivery pressure of compressor, temperature of evaporator and condenser were noted and coefficient of performance (COP) was calculated. The results obtained will be validated through CFD simulation. Further diffuser has been introduced in between compressor and condenser so that power input to the compressor has been reduced there by enhancing COP, the enhancement will be done through CFD simulation.
KEYWORDS: Vapour compression refrigeration system, coefficient of performance, suction and delivery pressure of compressor, Super Heating and Sub-Cooling of Liquid.
I. INTRODUCTION
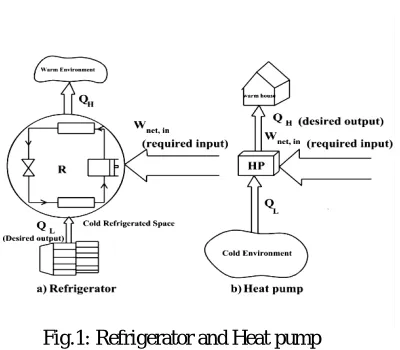
In thermodynamics, Refrigeration is the major application area, in which the heat is transferred from low temperature to high temperature region. The equipment which produces refrigeration is known as Refrigerator the cycle on which it operates is called refrigeration cycles. Vapour compression refrigeration cycle is most regularly used refrigeration cycle, in which the refrigerant is alternately vaporized and condensed and in the vapour phase it is compressed. GRC is the well-known refrigeration cycle.
Fig.1: Refrigerator and Heat pump
II. ACTUALVAPOUR-COMPRESSIONREFRIGERATIONCYCLE
Owing to the frequent irreversibility’s that happened in various components, in various ways an AVCR cycle differs from the ideal one. Two general sources of irreversibility’s are heat transfer to or from the surrounding and fluid friction (causes pressure drops).
Fig.2: AVC Cycle (T-s diagram) Fig.3: Vapour Compression Refrigeration Systems
Fig 2 and 3 shows the AVC cycle on T-s diagram and Vapour Compression Refrigeration Systems
Process 1-2-3 it shows the refrigerant through evaporator, with 1-2 indicating gain of latent heat of vaporization and2-3. Process 3-4-5-6-7-8 Path 3-4 represents the throttling action that occurs during passage through the suction valves and path 7-8 represents the throttling during passage through exhaust valves. Compression of the refrigerant occurs along the path 5-6, which is actually neither isentropic nor polytrophic. The heat transfer indicated by path 4-5 and 6-7 occurs essentially at constant pressure.
Process 8-9-10-11 This process indicates the flow of refrigerant through condenser with 8-9 removal of superheat, 9-10 removal of latent heat, and 10-11 removal of heat of liquid.
A VCR system is an advanced type of air refrigeration system in which a working substance, known as refrigerant, It condenses and evaporates at temperature and pressure close to the atmospheric conditions. The refrigerants usually used for this purpose are NH3, CO2 and SO2 etc. refrigerant used does not leave the system, but it circulates throughout
the system alternatively condensing and evaporating. During evaporation, latent heat is absorbs from the brine. The refrigerants used are, NH3, CO2, Freon etc. which alternately undergoes condensation and evaporation during the cycle.
When refrigerant enters the evaporator it will be in liquid state and by absorbing latent heat it becomes vapour. Thus the C.O.P of this system is always much higher than air refrigeration system.
III.EXPERIMENTATIONANDMETHODOLOGY
In the ideal cycle, the refrigerant after leaving the evaporator enters in to the compressor as saturated vapour. However, controlling the state of the refrigerants so accurately is not possible. Instead, it is easy for designing of the system such that the refrigerant is slightly superheated at the compressor inlet.
This small overdesign in the system makes sure the refrigerant is totally vaporized when it enters in to the compressor. Also, very long line connects the compressor to the evaporator; thus the drop in pressure caused by heat transfer from the surroundings to the refrigerant and fluid friction can be very important.
Fig.4: Refrigeration Test Rig Fig.5: Line Diagram of Vapour Compression Refrigeration System
The above fig.4 and 5 shows the liquid refrigerant in the evaporator, absorbs the heat from the medium which to be cooled and undergoes a change of phase from liquid to vapour. The vapour at low temperature and pressure is drawn into the compressor where it is compressed to a high pressure and temperature. The compressed vapour then enters the condenser.
Specifications
A.EXPERIMENTAL RESULTS
Table. 1 EXPERIMENTAL RESULTS
Experiments T1
K T2
K T3
K T4
K
Heat Flux W/m2 K 1 281 333.4 310.1 266.8 1146 2 277.7 334.2 307.1 260.4 1405 3 276.5 334.8 308 259.2 1410
B.OBSERVATIONS OF EXPERIMENTAL RESULTS WILL BE VALIDATED THROUGH CFD
Fig.6: Contours of Wall Heat Flux for Experiment 1
The above fig.6 shows the contours of Heat Flux conducted for the Experiment 1
Fig.7:Contours of Wall Heat Flux for Experiment
Fig.8:Contours of Wall Heat Flux for Experiment 2
C. ENHANCEMENT OF COP BY PROVIDING DIFFUSER BETWEEN COMPRESSOR AND CONDENSER WITH DIVERGENCE ANGLE OF DIFFUSER
Fig.9:Vapour Compression Refrigeration System along with diffuser
IV.RESULTS AND DISCUSSION
A. GEOMETRY OF DIFFUSER
Fig.10 shows the Meshed Model of the diffuser and Imported from ICEMCFD to CFX for Analysis
Fig.11: Outlet Pressure for Diffuser angle 100 and 150
Fig.12: Pressure Contours for Diffuser angle 200 Fig.13: Outlet Temperature for Diffuser angle 100 &150
For 20 degree flow analysis through the diffuser showed back flow which has been observed from colour coding from negative plot of numerical values which shows that 20 degree diffuser is not an appropriate design for analysis.
Without Diffuser
Therefore Compressor input = h21 - h1
Refrigeration effect = h1 - h6
For P1 = 137.89 KPa saturation temp. is ts1 = -19.15o C.
But observed temperature is 8o C. Therefore the condition of the refrigerant before compression is Superheat. H1 = hg1 + cp (tsup-ts1) = 238.98 + 0.958 (8-(-19.15)) = 264.99 kJ/kg
Final pressure = P21 = 770 KPa
Final Temperature = 348 K = 348 – 273 = 75o C.
For P21 = 770 KPa saturation temp. is t31 = 29.92o C. The condition of the refrigerant after compression is Superheat.
H21= h31 + cp (tsup-t31) = 266.64 + 0.958 (75- 29.92) = 309.83 kJ/kg
H6 = h5 = 93.155 kJ/kg
COP = Refrigeration Effect / Work Done = (H1 – h6) / (H21– H1)
= (264.99 – 93.155) / (309.83 – 264.99)
With Diffuser Angle 10°
For P1 = 137.89 KPa saturation temp. is ts1 = -19.15o C.
But observed temperature is 8o C. Therefore the condition of the refrigerant before compression is Superheat. H1 = hg1 + cp (tsup-ts1) = 238.98 + 0.958 (8-(-19.15)) = 264.99 kJ/kg
For P2 = 719.9 KPa saturation temp. is ts2 =26.9o C.
But observed temperature is 60.4o C. Therefore the condition of the refrigerant after compression is Superheat. H2 = hg2 + cp (tsup-ts2) = 262 + 0.958 (60.4- 26.9) = 294.093 kJ/kg
h3 = h4 = 93.155 kJ/kg
COP = Refrigeration Effect / Work Done = (H1 – h4) / (H2 – H1)
= (264.99 – 93.155) / (294.093 – 264.99)
= 5.90
Enhancement of COP (compared with 10 degree diffuser) = – = (5.90-3.83)/5.9 = 0.3508 = 35.08%
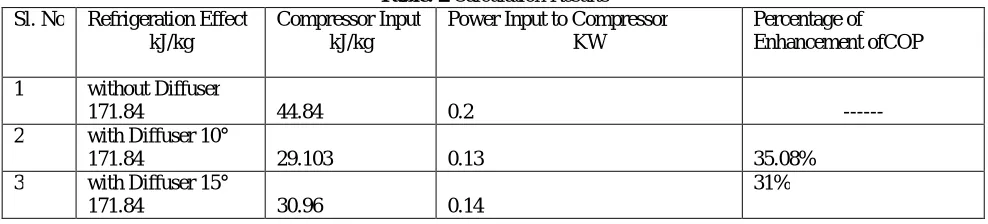
Table. 2 Calculation Results Sl. No Refrigeration Effect
kJ/kg
Compressor Input kJ/kg
Power Input to Compressor KW
Percentage of Enhancement ofCOP
1 without Diffuser
171.84 44.84 0.2 ---
2 with Diffuser 10°
171.84 29.103 0.13 35.08% 3 with Diffuser 15°
171.84 30.96 0.14
31%
V.CONCLUSION
From above analysis following conclusion has been arrived. With the addition of diffuser pressure inlet of refrigerant to the condenser is increased. With the addition of diffuser of an angle 10 degree Coefficient of Performance (COP) enhancement has been increased by 35.08 % when compared without diffuser. With the addition of diffuser of an angle 15 degree Coefficient of Performance (COP) enhancement has been increased by 31.0% when compared without diffuser. Power input to the compressor obtained with diffuser of 10 degree is 0.13 KW. Power input to the compressor obtained with diffuser of 15 degree is 0.14 KW. Power input to the compressor obtained without diffuser is 0.2 KW. Finally conclusion drawn is Coefficient of Performance (COP) can be enhanced by placing diffuser of 10 degree divergent angle. Finally for 20 degree flow analysis through the diffuser showed back flow which shows that 20 degree diffuser is not an appropriate design for analysis.
REFERENCES
1. Amit prakash “TO IMPROVE THE PERFORMANCE OF VAPOUR COMPRESSION REFRIGERATION SYSTEM BY USING
SUBCOOLING AND DIFFUSER” IJEBEA 13-129 2013
2. R. Rejikumar et.al “ENHANCEMENT OF HEAT TRANSFER IN DOMESTIC REFRIGERATOR USING R600a/mineral oil/ nano-AL2O3 AS WORKING FLUID” IJCETR APRIL 2013 VOL 03,ISSUE 04.
3. M. Krishna Prasanna M.E. student, and P.S Kishore “ENHANCEMENT OF COEFFICIENT OF PERFORMANCE (COP) IN VAPOUR COMPRESSION REFRIGERATION SYSTEM”
4. J.K.Dabas et.al “PERFORMANCE CHARACTERISTICS OF VAPOUR COMPRESSION REFRIGERATION SYSTEM UNDER REAL
6. R.T.Saudagar and Dr. U.S. Wankhede “INTRODUCING DIFFUSER AT COMPRESSOR INLET IN A VAPOUR COMPRESSION REFRIGERATION SYSTEM ”
7. P.Thangavel “SIMULATION ANALYSIS OF COMPRESSION REFRIGERATION CYCLE WITH DIFFERENT REFRIGERANTS”
8. A . Baskaran and P.Koshy Mathews “THERMAL ANALYSIS OF VAPOUR COMPRESSION REFRIGERATION SYSTEM WITH R152a