ABSTRACT
HITE, REBECCA LYN. Perceptions of Virtual Presence in 3-D, Haptic-Enabled, Virtual Reality Science Instruction. (Under the direction of M. Gail Jones).
Virtual presence describes the degree of immersion and control a user perceives while immersed in a virtual environment. This dissertation work examined the relationships between cognitive development and adolescents perceptions’ of virtual presence using 3-D, haptic-enabled (HE) virtual reality (VR) science instruction.
Presence is the psychological perception of being (involved and immersed) in a virtual environment despite being physically situated in reality. Four factors comprise presence: control, sensory engagement, distraction, and realism. A mixed-methods design was used to examine virtual presence, cognitive development and learning gains with seventy-five 6th and seventy-six 9th grade students who participated in a learning module about cardiac anatomy and physiology using a 3-D, HE VR technology system. Prior to instruction, participants completed a pre-assessment on cardiac anatomy and physiology and an assessment of Piagetian
development. Upon completion of the learning experience, a presence survey and post-assessment were completed. Data were analyzed by comparing 6th and 9th grade groups,
Perceptions of Virtual Presence in 3-D, Haptic-Enabled, Virtual Reality Science Instruction
by
Rebecca Lyn Hite
A dissertation submitted to the Graduate Faculty of North Carolina State University
in partial fulfillment of the requirements for the Degree of
Doctor of Philosophy
Science Education
Raleigh, North Carolina 2016
APPROVED BY:
_____________________________ _____________________________
Dr. M. Gail Jones Dr. Eric Wiebe
Committee Chair
_____________________________ _____________________________
BIOGRAPHY
Rebecca Hite earned her bachelors in Biology, Geography and Masters in secondary science education degrees from the University of North Carolina at Chapel Hill. She has taught high school science and geography for 13 years in the public schools of North Carolina. During her tenure teaching, she received her National Board Certification, was awarded a Kenan
Fellowship at North Carolina State University, served as American Physiological Society
ACKNOWLEDGEMENTS
This research was generously supported by several partners, sponsors, and individuals who require mention and thanks. First, is the zSpace® company and its director of education and product experience, Elizabeth Lytle. She provided invaluable technical assistance and essential hardware support (loaned machines) throughout the duration of the project. In addition, I would like to recognize the William and Ida Friday Institute for Educational Innovation and the College of Education at North Carolina State University for investing critical resources into this project by providing research space and securing the zSpace® technology. I am confident these assets will prove useful in future research studies and outreach with local students and schools. Also, I would like to say thank you to Dr. Gina Childers, the director of research and development at North Carolina New Schools / Breakthrough Learning. Through our partnership, we were able to provide novel 3-D HE VR technology experiences to under-resourced students in rural North Carolina. Last and not certainly least, I wish to express my most humble and deepest gratitude to my mentor and P.I., Dr. Gail Jones, whose vision saw the zSpace® project from its inception to fruition. She was my source of academic fortitude and strength, providing support and
Graduate students, like scientific endeavor and research itself, stand on the shoulders of giants. During my tenure as a doctoral student at North Carolina State University, I have had the privilege of learning under the tutelage of premier professors who helped me harness and hone the craft of scholarly research. I would like to thank Dr. Gail Jones, Dr. Eric Wiebe, Dr. Meg Blanchard, Dr. Hollylynne Lee, Dr. Lance Fusarelli, Dr. Meghan Manfra, Dr. Andrew
McEachin, Dr. John Nietfeld, Dr. Roger Azevedo, and the late Dr. Jimmy Scherrer for introducing me to a whole new world of intellectual discourse on education as well as
communicating its importance to its practioners and the public. I would also like to thank my fellow graduate students who, each in their own unique way, challenged me or influenced my study of STEM education, Alonzo Alexander, Kemal Akoglu, Osman Aksit, Courtney Behrle, Katherine Chesnutt, Emily Cayton, Gina Childers, Elysa Corin, Tasha Elliott, Megan Ennes, T. Fulya Eyupoglu, Katie Green, Stephanie Grady, Kathleen Gray, Kristie Gutierrez, Sarah Luginbuhl, Jeff Milbourne, Lindsay Patterson, Mariana Pereya, Whitney Richardson, James Sanders, Rebecca Stanley, Kylie Swanson, Mona Tauber, Sam Wheeler, and Jared Williams.
In addition to my graduate school colleagues, I would also like to thank my family, friends, former co-workers, and professional organizations that cheered me on throughout this doctoral journey. I am truly thankful to the many teachers and mentors, past and present, which have helped me on my path of personal and professional growth.
TABLE OF CONTENTS
Page
LIST OF TABLES……….…………..……...……ix
LIST OF FIGURES...………...….xiii
CHAPTER 1: Three Dimensional, Haptic-Enabled, Virtual Reality Science Instruction Introduction and Background……….….1
Statement of the Problem………..…….……….2
Significance of the Study………...……….8
Research Questions………...…….……….9
CHAPTER 2: Theoretical Background Review of the Related Literature……….…….……….11
Presence and Immersion………...……….11
Hardware of 3-D HE VR Technology………...12
Review of Literature Related to the Problem………...……….14
Stages of Cognitive Development……….……14
Cognitive Development and the Prefrontal Cortex………...……15
Contextual Factors Influencing Presence………...…...16
TABLE OF CONTENTS
Page
CHAPTER 3: Methodology
Research Design……….………23
Participants……….………23
Equipment……….……….………24
Instruction/Treatment/Intervention………25
Assessments and Data Analysis …………...….……….………...29
Limitations of the Study……….………….………...35
CHAPTER 4: Results………..………...37
CHAPTER 5: Discussion and Conclusion Discussion of Results………...………....69
Cognitive Development and Perceptions of Presence………...………70
Open Ended Questioning and Cognitive Processes in 3-D HE VR Science Instruction………..72
TABLE OF CONTENTS
Page
Conclusion…………...………...………...…...75
Best Practices in using 3-D HE VR technologies in 6-12 Science Instruction….79 Recommendations for Future Research………..……...81
REFERENCES……….……….……....83
Footnotes………..………....106
APPENDICES………...……...107
Appendix A: Inventory of Piaget’s Developmental Tasks (IPDT)………….…..……..108
Appendix B: Test of Cardiac Knowledge………...…..……..109
Appendix C: Three question prompt on cardiac form and function………….……...114
Appendix D: zAnatomy® Tutorial………...…...115
Appendix E: Presence Survey……….……..……...….118
LIST OF TABLES
Page
Table 1 Four Factors Hypothesized to Contribute to a Sense of Presence……….19 Table 2 Reliability Data for Four Administrations of a Test of Cardiac Knowledge...30
Table 3 Reliability Measures (Cronbach’s Alpha) by Control, Sensory, Distraction, and Realism Items……….…………....32 Table 4 Inventory of Piaget’s Developmental Tasks (IPDT) Cognitive Classifications
(by age) and Construct, Subtest………....………...33 Table 5 Assessments and Analyses Related to Research Questions………....…...37
Table 6 Results of 6th and 9th Grade Student Scores on a Test of Cardiac Knowledge...38 Table 7 Results of 6th and 9th Grade Student Scores on an Open-ended Cardiac
Drawing...39
Table 8 Results of 6th and 9th Grade Student Scores on an Open-ended Assessment of Cardiac Circulation...40
Table 9 Differences in 6th and 9th Grade Student Responses by Presence Control
Construct………...………....41 Table 10 Differences in 6th and 9th Grade Student Responses by Presence Sensory
LIST OF TABLES
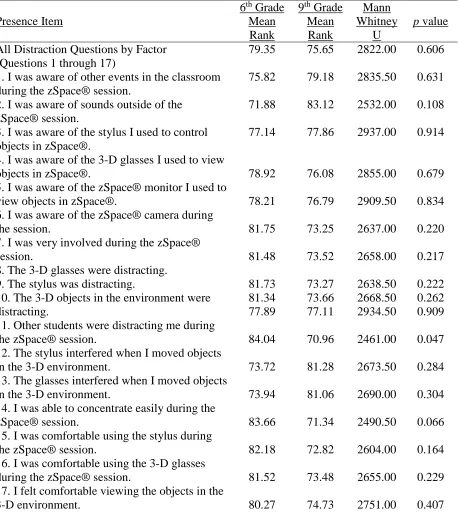
Page
Table 11 Differences in 6th and 9th Grade Student Responses by Presence Distraction Construct………....44 Table 12 Differences in 6th and 9th Grade Student Responses by Presence Realism
Construct………..….…….45 Table 13 Correlations Between Inventory of Piaget's Developmental Tasks (IPDT)
Construct of Laws and Presence Constructs………..……46 Table 14 Correlations Between Inventory of Piaget's Developmental Tasks (IPDT)
Construct of Relations and Presence Constructs………47
Table 15 Correlations Between Inventory of Piaget's Developmental Tasks (IPDT) Construct of Conservation and Presence Constructs………..…………48
Table 16 Correlations Between Inventory of Piaget's Developmental Tasks (IPDT) Construct of Images and Presence Constructs………...…..48
Table 17 Correlations Between Inventory of Piaget's Developmental Tasks (IPDT) Construct of Classification and Presence Constructs………...…..49
Table 18 Correlations Between Inventory of Piaget's Developmental Tasks (IPDT) Cognitive Classifications (proficiency by age) and Presence Constructs…...51
LIST OF TABLES
Page
Table 20 Frequencies of Types of Questions Asked Prior, During, and After Treatment about the Human Heart (9th Grade)………..…..……..53 Table 21 Coded Questions using Chi’s Active-Constructive-Interactive Framework
(6th Grade)………..…………...…………55
Table 22 Coded Questions using Chi’s Active-Constructive-Interactive Framework
(9th Grade)………..………...……56
Table 23 Two-way Analysis of Variance (ANOVA) Between Learning Activities
by Time and Grade Level (6th and 9th Grade)……….…....…..58 Table 24 Correlations Between Student Questioning and Presence Constructs…………..60 Table 25 Correlations Between Inventory of Piaget's Developmental Tasks (IPDT)
Construct of Laws and Student Questioning………...…….…61 Table 26 Correlations Between Inventory of Piaget's Developmental Tasks (IPDT)
Construct of Relations and Student Questioning………..…....………62 Table 27 Correlations Between Inventory of Piaget's Developmental Tasks (IPDT)
Construct of Conservation and Student Questioning………...………62
Table 28 Correlations Between Inventory of Piaget's Developmental Tasks (IPDT)
LIST OF TABLES
Page
Table 29 Correlations Between Inventory of Piaget's Developmental Tasks (IPDT)
Construct of Classification and Student Questioning………...…64 Table 30 Correlations Between Inventory of Piaget's Developmental Tasks (IPDT)
Cognitive Classifications (proficiency by age) and Student Questioning…...…65 Table 31 Three-way Analysis of Variance (ANOVA) of Students’ Pre-test Scores on a
Standardized Cardiac Assessment by Student Questioning (Active, Constructive and Interactive) ………...….……...…65 Table 32 Correlations Between Students’ Scores on a Test of Cardiac Knowledge and
Presence Constructs……….………66 Table 33 Correlations Between Student Test Scores on a Test of Cardiac Knowledge and
Subset Scores on the Inventory of Piaget's Developmental Tasks (IPDT) ……67 Table 34 Correlations Between Student Test Scores on a Test of Cardiac Knowledge and
LIST OF FIGURES
Page
Figure 1 The zSpace® System……….………25
Figure 2 A screenshot of Part 4/8 of zAnatomy® on zSpace®………...….26
Figure 3 A screenshot of Part 7/8 of zAnatomy® on zSpace®…………...…….27 Figure 4 A screenshot of the heart in zExperience® on zSpace®…………...….28
Figure 5 A user interacting with the heart in zExperience® on zSpace®…...….28 Figure 6 ANOVA outputs for active, constructive, and interactive questions
CHAPTER 1: Three Dimensional, Haptic-Enabled, Virtual Reality Science Instruction
Introduction and Background
Educational technology is quickly evolving with the use of three-dimensional (3-D), haptic-enabled (HE), virtual reality (VR) systems. The high costs once associated with this technology and substantial computational power required had previously made this equipment prohibitive in mainstream school settings (Dalgarno & Lee, 2010, p.11). Today, these tools have the potential to promote learning of science concepts using realistic graphics and touch technology in a user-friendly interactive and immersive interface. With the use of high quality graphic images, simulated movements and auditory stimuli, these systems have potential to enable students to visualize abstract science concepts like particle relationships (Uchiyama & Funahashi, 2013), construct large-scale complex models (Sampaio, Ferreira, Rosário, & Martins, 2010) and feel objects beyond their reach in the typical science classroom like the beating of a human heart (Jones, Hite, Childers, Corin, Pereyra, Chesnutt, & Goodale, 2015). This marks a significant departure from traditional means of science instruction: supplanting flat 2-D images and detached multi-media content presentations with robust 3-D imagery and responsive teaching.
A hallmark of modern K-12 education reform is to personalize instruction via technology to provide students with authentic representations of science processes and scientific endeavors. In the field of surgical oncology, VR simulators have instrumental in enhancing doctor’s
technical skills and improving performance in the operating room (Lewis, Aggarwal,
authentic, or equally authentic, to other forms of science instruction, these systems may provide a powerful learning opportunity for students who benefit most from one-on-one instruction coupled with visual scaffolding of complex scientific phenomena (Scutaru, Scapolla, Mustica, Sandu, & Kristaly, 2008). These tools may prove particularly useful for students from
historically under-served or under-performing groups in science including English language learners (Chung, 2012; Davis & Berland, 2013; Lin & Lan, 2015) and students with disabilities (Lota, Yalon-Chamovitz, & Weiss, 2011; Ludlow, 2015; Vasquez, Nagendran, Welch, Marino, Hughes, Koch & Delisio, 2015). A better understanding of how students interact with and perceive the authenticity of VEs produced by these devices as instructional guides is paramount as they become available to teachers and incorporated into classroom practice (Hite, Jones, Childers, Chesnutt, Corin, & Pereyra, 2016; Zudilova-Seinstra, Adriaansen, & van Liere, 2009). Elucidating these relationships between learners’ cognitive attributes and their perception of presence can inform educators about pedagogical strategies to best leverage 3-D HE VR use in K-12 science instruction.
Statement of the Problem
Three-dimensional virtual environments create the visual illusion of objects having depth and realistic qualities (Wann & Mon-Williams, 1996; Dalgarno & Lee, 2010). In Dalgarno and Lee’s (2010) model of learning in 3-D VEs, the quality and authenticity of the display
(representational fidelity) coupled with precise user actions (learner interaction) are paramount features of these unique technology-enhanced (TELE) or computer-enhanced (CELE) learning environments. In the context of this paper, technology- or computer-enhanced learning
lesson (Shapiro, Roskos, & Cartwright, 1995). A unique aspect of superior 3-D VR technologies is that they employ high-fidelity, photorealistic images mimicking the behavioral interactions the user would experience in reality. This type of virtual environment conveys a rich and robust experience that is both compelling (Wouters, van Nimwegen, van Oostendorp, & van der Spek, 2013) and engaging to the user (Graesser, D'Mello, & Strain, 2014). In this type of experience, the user characteristically experiences to some degree a psychological phenomenon described as a diminished sense of one’s immediate surroundings (Bulu, 2012) transposed with a sensation of physical transportation to a simulated realm where the virtual experience feels authentic
(McCreery, Schrader, Krach, & Boone, 2013). This construct is known as virtual presence (Fowler, 2015).
Dalgarno and Lee (2010) argue that “representational fidelity” and “learner interaction” are the two unique characteristics of 3-D, VEs. Representational fidelity refers to the quality of the display whereas high fidelity regards the production of realistic or photorealistic images (Zeltzer, 1992). Realism not only refers to the visual quality of the display, but also the consistency of an object’s behavior through user communication and actions (Fowler, 2015).
In addition to visual modalities, VEs may also incorporate force generating technologies, called haptics (Jones & Minogue, 2006). Haptic-enabled technologies provide touch-based sensory feedback to the user through a hardware interface (grip, stylus or hologram) that provides various tactile sensations (e.g. force or vibrations) to simulate texture, pressure,
2004), and lever systems (Wiebe, Minogue, Jones, Cowley, & Krebs, 2009). Since presence (defined below) is a psychological product of multiple sensory inputs (Witmer & Singer, 1994), touch technology may play an important and promising role in inducing or sustaining presence in VEs.
A key component of learning in VEs is invoking a user’s sense of virtual presence, where representational fidelity and learner interaction foster a unique psychological experience of being within a virtual realm (Zeltzer, 1992). Presence occurs when a person is unable to differentiate the sensory information from a hardware-mediated environment from that of reality, interpreting the virtual input as though it were from the real world (Chertoff, Schatz, McDaniel & Bowers, 2008). Therefore, the efficacy of these devices as instructional tools hinges on their ability to induce perceptions of presence for science learners of all ages, backgrounds, and contexts.
Most research in this area has explored how the design or usability of virtual
environments play a role in inducing presence (Fowler, 2015; Papachristos, Vrellis, Natsis, & Mikropoulos, 2014; Seo & Kim, 2002; Tanaka, 2004; Tromp, Steed, & Wilson, 2003;
these users and enhanced their rating of presence when surveyed. More recent work has shown immersion to be greater in individuals who quickly adapt to and are able to concentrate within the virtual environment (Witmer, Jerome, & Singer, 2005).
An area unexplored by current research are K-12 students and their perceptions of virtual presence during 3-D HE VR experiences. Initial studies explored the affordances of 3-D VR technologies for military preparation (Ludvigsen, & Fjuk, 2001) which has developed into medical training (HsiuMei & ShuSheng, 2011; Thacker, 2003) and university level sciences (Eriksson, Linder, Airey, & Redfors, 2014;), namely chemistry education (Coleman & Gotch, 1998; Limniou, Roberts, & Papadopoulos, 2008; Merchant, Goetz, Keeney-Kennicutt, Cifuentes, Kwok, & Davis, 2013; Merchant, Goetz, Keeney-Kennicutt, Kwok, Cifuentes, & Davis, 2012; Özdilek & Calis, 2010; Stull, Barrett & Hegarty, 2013). In analyses by Krange, Fjuk, Larsen, and Ludvigsen (2002), they found few 3-D VR learning environments specifically designed for K-12 students. A recent meta-analysis by Hew and Cheung (2010) on the use of 3-D immersive virtual worlds in K-16 settings found that most studies were conducted at the polytechnic and university level.
Ryan, 1985; Zimmerman, 2008). When students fail to benefit from learning in computer-based or technology-enhanced learning environments, it is most often due to a lack of SRL skills, knowledge, or motivation (Greene, Moos, & Azevedo, 2011). Therefore, adolescent and younger learners, lacking in developed SRL skills, rely on the VE to provide SRL scaffolding and support to minimize frustration and distraction while using 3-D VR technology (Virvou & Katsionis, 2008). Students reported more intense experiences of virtual presence when support devices for help seeking were integrated into the VE (Schrader & Bastiaens, 2012). Moreover, in seminal work by Malone and Lepper (1987), students’ intrinsic motivations in any learning situation were influenced by challenge, curiosity, fantasy, and control. Even the perception of control, not actual physical control, was found to be significant for mediating intrinsic
motivation. Therefore, for children, even the illusion of control and realism may create powerful effects on motivation and learning. Research by Park, Moreno, Seufert, and Brüken (2011) discovered that content that was non-redundant and interesting, even in a low-load (narrative-based) format, resulted in the most effective learning outcomes for sampled students in the VE.
When comparing affective and cognitive states between children and adults, intellectual development underpins this difference. Piaget (1962) hypothesized there were four sequential stages of intellectual development marked by specific hallmarks of cognitive growth:
(1971) contended that mental development, initially governed by maturation (genetic factors) will yield to experiential input (environment) over the lifespan. In measuring students’ intellectual competence, chronological age should not the determining factor, but rather their developmental stage (Southwell, 1998). Because presence relies on the “user’s ability to perceive virtual information within these remote settings directly as an extension of their own experiences and senses” (McCreery et al., 2013, p.1635), cognitive ability may play a critical role in a user’s perceptions of presence.
Cognitive development invites the question of the efficacy of 3-D, VR environments on K-12 student learning. Bouta and Retalis, (2013) have shown 3-D, VR technology benefits primary students in their understanding of science concepts. Stull, Barrett, & Hegarty (2013) theorized that this is due to the ability of 3-D VR technologies to provide immersive engagement to the user. In addition, 3-D virtual technologies can provide a “wide range of experiences, some of which are impossible to try in the real world because of distance, cost, danger or
Banet, 1996), science teachers (Yip, 1998), and medical students (Badenhorst, Mamede,
Hartman & Schmidt, 2015) all hold misconceptions about the heart and its functions. As cardiac anatomy and physiology becomes embedded into interdisciplinary curricula, the demand for viable instructional options to effectively teach the heart is increasing (Raikos & Waidyasekara, 2014). In training studies, medical students have reported being able to visualize the heart in real-time improved their comprehension of heart sounds (Youn & Sanghvi, 2015) and improved their ability to perform in-hospital cardiopulmonary resuscitation (CPR) during a simulated cardiac arrest with haptic feedback (Abella et al., 2007). Within the body of current research in 3-D HE VR technology, these types of instructional tools have made in-roads in student
engagement in learning science (Bulu, 2012; Jacobson, 2006; Dalgarno & Lee, 2010), and in learning about the human heart (Chen, Lin, Li, Hseih, Du, & Chen, 2015; Silén, Wirell, Kvist, Nylander, & Smedby, 2008).
Significance of the Study
development. In particular in the areas of spatial and rotation, mental functions may aid learning in VE. However, both 6th and 9th grade groups are expected to undergo similar learning
trajectories from active, constructive and interactive activity. This will help inform the use of 3-D HE VR technology in the K-12 classroom that promotes engagement and learning appropriate to student level and cognitive ability.
Research Questions
Research Question 1 – Does a 3-D, haptic-enabled virtual reality technology experience promote understanding of cardiac anatomy and physiology for 6th and 9th grade students?
a. Are there increases in understanding of cardiac anatomy and function?
b. In what ways does 3-D, HE VR experiences influence understanding of cardiac circulation?
Research Question 2 – Are there differences in 6th and 9th grade science students’ perceptions of presence when engaged in 3-D, haptic-enabled virtual reality instruction?
Research Question 3 – Is there a relationship between 6th and 9th grade students’ cognitive dimensions1 and perceptions of presence?
a. What is the relationship between students’ scores on the Inventory of Piaget’s Developmental Tasks (IPDT) constructs2 and subtests3 and perceptions of presence? b. What is the relationship between students’ scores on the Inventory of Piaget’s
Developmental Tasks (IPDT) cognitive classifications4 and perceptions of presence? Research Question 4 – Does 3-D, haptic-enabled virtual reality technology influence learning for 6th and 9th grade students?
b. Are there differences in questioning between 6th and 9th grade students?
c. Is there a relationship between students’ questioning and perceptions of presence? d. Is there a relationship between students’ questioning and students’ scores on the
Inventory of Piaget’s Developmental Tasks (IPDT)?
Research Question 5 – Is there a relationship between 6th and 9th grade students’ understanding of cardiac anatomy and physiology and perceptions of presence?
a. What is the relationship between students’ scores on a test of cardiac knowledge and student’s questioning?
b. What is the relationship between students’ scores on a test of cardiac knowledge and students’ perceptions of presence?
c. What is the relationship between students’ scores on a test of cardiac knowledge and scores on the Inventory of Piaget’s Developmental Tasks (IPDT) constructs2 and subtests3?
d. What is the relationship between students’ scores on a test of cardiac knowledge and scores on the Inventory of Piaget’s Developmental Tasks (IPDT) cognitive
CHAPTER 2: Theoretical Background Review of the Related Literature
Presence and Immersion
This study builds on previous work related to presence, which is defined as participation (Sheridan, 1992) or perception of being in another environment (Slater & Wilbur, 1997). Presence may be defined in a variety of contexts, such as social (Daft & Lengel, 1984), media (Lee, 2004), and gaming (Lombard & Ditton, 1997). Each dimension of presence has its own robust field of study. This research will focus on the environmental and personal aspects of presence defined as virtual presence. This type of presence specifically couples involvement and immersion to have the user “perceive that they are interacting directly, not indirectly or remotely, with the environment” (Witmer & Singer, 1998, p.227). According to Whitner and Singer (1998), both involvement and immersion are necessary for experiencing presence. Involvement is mediated by the users’ ability to control the virtual environment and hold the user’s attention within the virtual realm. Therefore, the display and hardware of technology generating virtual environments should ensure the user is comfortable wearing and using the equipment; if such hardware is cumbersome or confining, the users involvement in the virtual environment will diminish considerably (Witmer & Singer, 1998).
Immersion gauges the quality of the virtual environment to the real world. Continuous or deep immersion relies upon encompassing sensory engagement and realistic features within the virtual realm. Steuer (1992) describes the sensory experience as shaping how real the
even evidence from a study by Biocca, Kim and Choi (2001) that participants reported haptic illusions in the absence of stimuli from the sensory channel interface due a profound sense of immersive presence. A study by Reiner and Hecht (2009) has shown that a visuohaptic presentation (i.e. merged visual and tactile sensory information) of a razor blade generated an object-presence illusion causing participants to move their hand more slowly and applying less force as compared to an identical task without the razor representation. Another study by Weir et al., (2013) found when participants placed their hands in a virtual fire (BurnAR), they reported involuntary warming sensation and a smell of smoke. Due to the profound sense of immersive presence users experience within these VE, they may also invoke negative affective states like fear and anxiety (Dede, 2009), thus underscoring the importance of understanding users varying cognitive dimensions and presence perceptions in the proper and ethical use of this technology.
Hardware of 3-D HE VR Technology
According to Limniou, Roberts, and Papadopoulos (2008) there are four hardware
To avoid distortion and eyestrain, the user should be an optimum distance and angle from the system. Stereoscopic displays are of particular interest in presence research. A study by Price, Lee, Subbarao, Kasal, and Aguilera in 2015 provided 2-D and stereoscopic images of the Milky Way galaxy to museum visitors and assessed their knowledge of its structure and function. Controlling for demographics between both groups, results indicated there were short-term learning gains in both the 2-D and stereoscopic groups yet only the stereoscopic group exhibited long-term learning gains (p. 1137). However, this is balanced with other studies demonstrating that student learning with VR technology is short-lived as long term conceptual change has been unsuccessful (Neulight, Kafai, Kao, Foley, & Galas, 2007).
One major advancement in developing presence is in the hardware design of these devices. Early studies assessing presence found using multiple sensory inputs (e.g. 3-D coupled with head tracking) were associated with higher presence ratings (Arsenault & Ware, 2004; Freeman et al., 1999). Therefore, more technologies are progressively incorporating
According to work by Jones et al. (2015), “augmented experiences that include sight, sound, movement, and haptics all contribute to a more realistic virtual environment” (p. 2). Since 3-D HE VR systems are crafted to couple involvement with deep immersion into a simulated world, it is hypothesized that these tools have a great potential to induce presence for the user (Witmer & Singer, 1998). Presence often serves as a proxy for the potential positive transfer of skills or knowledge learned in a VE to the real world (Mestre & Fuchs, 2006). Research by Osberg (1997) suggests that multi-sensorial input can be challenging for students, especially for those with disabilities. Since the 1990s, the potentiality of these nascent 3-D HE VR systems had been described to significantly “contribute to learning and reasoning in
mathematics and science education” (Pea, 1993, p.60). However, the affordances of
instructional technologies that combine 3-D rendered images coupled with haptic feedback for younger learners is largely unknown.
Review of Literature Related to the Problem Stages of Cognitive Development
where formal operational processing occurs, abstraction of intangible concepts is achieved, and experience over instinct mediates how one views the world beyond themselves.
As age is an inadequate proxy for development, assessments are required to determine Piagetian cognitive development. There are a number of valid interviews and inventories that have been designed to explore the major problem areas of conservation, images, relations, laws, and classification (Patterson & Milakofsky, 1980). Piagetian assessments typically involve “language, logical reasoning, moral judgments, and conceptions of time, space, and number” (Southwell, 1998, p. 4). Other Piagetian concepts included in these assessments involve moral judgment, conservation, and spatial operations (DeLisi, 1979). The difficulty of science
concepts can be categorized in terms of students’ abilities to perform Piagetian tasks (Southwell, 1998). Piagetian inventories have been empirically validated with all age and ability groups including primary students (Bakken, Thompson, Clark, Johnson & Dwyer, 2001), adults in science courses (Bender & Milakofsky, 1982; Coleman & Gotch, 1998) and students with disabilities (Riley, 1989).
Cognitive Development and the Prefrontal Cortex
of presence in adults in VEs; this absence of activity due to underdeveloped prefrontal regions may contribute to an increased experience of presence among children in identical VEs.
In addition to planning and judgment, the prefrontal cortex has also been shown to be related to personality traits (DeYoung et al., 2010). In turn, personality has long been strongly correlated with interest (Ackerman & Heggestad, 1997) which was previously discussed as a cofounding factor in presence (Freeman et al., 1999; Whitmer & Singer, 1998). A study by Weibel and Wissmath (2011) explored the relationship between presence and flow, a construct related to involvement in a gaming environment. Despite their similarities, a factor analysis demonstrated they are distinct constructs with little common variance, with flow focused on specific tasks and presence as overall immersion in the VE. Weibel and Wissmath argue “presence and flow are positively affected by motivation and immersive tendency and in turn influence enjoyment and performance” (p. 11). Overall, perceptions of presence are dependent on the immersive characteristics of the VR system and may be influenced by contextual and psychological factors (Mestre, 2015).
Contextual Factors Influencing Presence
more carefully observe realistic representations of objects such as three-dimensional animals. These findings may inform how children’s visual conceptions can be influenced by these factors in VR settings. Relatively little is known about the influence of interest or prior knowledge and perceptions of presence.
Psychological factors stem from neural imaging research indicating children and adults experience and process virtual presence differently. Adults in virtual environments use self-reflection and experience, cognitive constructs associated with prefrontal regions that are under-developed and inactive in children (Baumgartner et al., 2008). This work suggests that children may experience greater virtual presence due to an inability to self-evaluate the stimulated environment vis-à-vis physical reality. This suggests an individual’s age and level of cognitive development may affect perceptions of presence; yet there is a dearth of research exploring developmental aspects to perceptions of presence. The goal of this research was to examine how cognitive development influences users’ perceptions of presence for experiences in 3-D HE VR technology. Previous research has shown that spatial processing skills are an important
component in cognitive development. A study by Osberg (1997) found that students leveraged their experience in multi-perceptual learning environments to aid in developing spatial concepts and relationships.
lowest quartile of spatial ability had significantly lower performance in a 3-D VR environment. These findings may relate to established research showing the neural architecture segregating activities into specific geographic areas for optimal neural processing. Within the anterior section of the brain, the frontal lobe houses centers known for speech, language processes and executive functions that include working memory, planning, and decision making (Fuster, 2008). The prefrontal cortex is a highly evolved structure that regulates behavior when presented with vivid sensory inputs that are either rapidly changing or unique to one’s prior experience (Miller & Cohen, 2001). Therefore, this region activates when the body is inundated with sensory input to make meaning and judgements of novel or unique experiences. Notably, this region develops with age and experience (Satoshi, 2008) which may provide additional insight as to why adults experience presence differently than children (Baumgartner et al., 2008; Spronk & Jonkman, 2012). Although there are strong connections between neuroscience and presence, there is little research connecting these two domains of knowledge (Sanchez-Vives & Slater, 2005) or
exploring cognitive development, with presence (Jones et al., 2015). Only recently has the progression of cognitive development theorized by Piaget been verified using Piagetian tasks with children and adults using functional magnetic resonance imaging (fMRI) (Leroux et al., 2009).
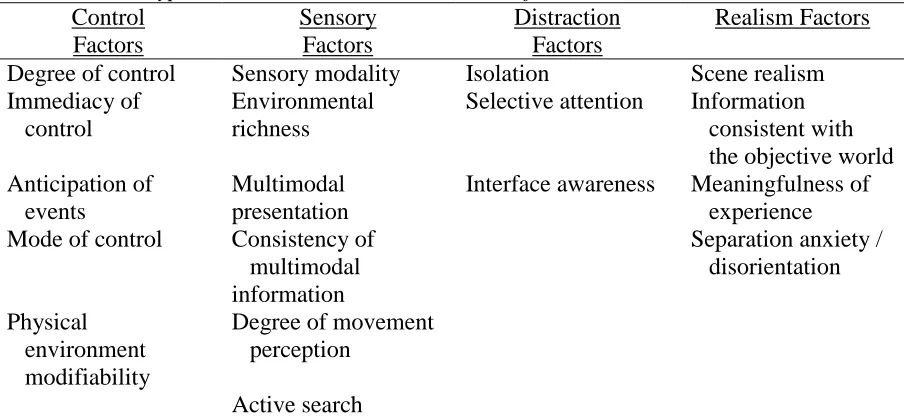
factors) of control, sensory, distraction, and realism. The authors indicated that factors across categories would interrelate, provided they “may exert their influences on presence by affecting either involvement, immersion, or both. We speculate that control factors may affect immersion but not involvement, while Realism Factors should affect involvement but not immersion. We hypothesize that Sensory Factors and Distraction Factors should affect both immersion and involvement” (p. 228). Table 1 provides these factors and aspects related to presence rated by the user (Witmer & Singer, 1998, p.299).
Table 1
Four Factors Hypothesized to Contribute to a Sense of Presence
Control Factors Sensory Factors Distraction Factors Realism Factors Degree of control Sensory modality Isolation Scene realism Immediacy of
control
Environmental richness
Selective attention Information consistent with the objective world Anticipation of
events
Multimodal presentation
Interface awareness Meaningfulness of experience Mode of control Consistency of
multimodal information
Separation anxiety / disorientation Physical
environment modifiability
Degree of movement perception
Active search
Note: Constructs backing Presence Questionnaire designed by Witmer & Singer (1998).
factors of presence to specifically address presence during a 3-D, HE, VR investigation using the zSpace® platform.
Affordances of 3-D HE VR Technology for Science Teaching
In this paper, affordances are defined as the relationship between the properties of an educational intervention (e.g. technology) and the facilitation of learning given specific characteristics (age, cognitive development) of the learner (Dalgarno & Lee, 2010; Kirschner, 2002). Because 3-D HE VR technology strives to replicate the real world, there is a potential for as Ruzic (1999) describes as “individualized, interactive and realistic learning that makes virtual reality a tool for apprenticeship training, providing a unique opportunity for situated learning” (p. 188). Based upon the work of Lave and Wenger (1991) in situated learning, numerous authors have described how 3-D HE VR technologies can replicate the apprenticeship model virtually to engage the learner in legitimate peripheral participation through co-participation with the technology (Bronack, Riedl & Tashner, 2005; Chittaro & Ranon, 2007; McLellan, 2004). Virtual situated learning may provide a powerful opportunity for novices to engage in complex, intricate or potentially hazardous training situations with no repercussions on wasting materials or live specimens (Hempe & Rosmann, 2015; Prokop, Prokop, Tunnicliffe, & Diran, 2007; Shi, Zhang, & Shao, 2008;), patients (Lewis et al., 2011) or to the user (Xu, Lu,
Kumiko, Pyman, & O’Leary, 2011). The majority of the research studies done on 3-D HE VR as instructional tools have been done in medicine and chemistry, for applications that are not easily experienced at the macroscale. However, other disciplines are beginning to incorporate 3-D HE VR experiences in subjects at a variety of student ages including middle grade engineering (Klahr, Triona, & Williams, 2007), elementary earth science (Sun, Lin, & Wang, 2010) and mathematics education (Sarama & Clements, 2009).
Computer-enhanced learning environments that combine vivid and interactive
visualization are hypothesized to promote active processing through a reduction of extraneous cognitive processing in lieu of the learner generating their own mental pictures, resulting in reduced comprehension due to a decrease in cognitive resources available for essential and generative processing (Schwamborn, Thillmann, Opfermann, & Leutner, 2011). Research exploring VR training simulations have seen lower cognitive load (CL) demand than compared to traditional instruction (Andersen et al., 2016), which may prove useful for teaching and learning given the established empirical relationship between lower CL and cognitive retention for science simulations in computer-enhanced learning environments (Lee, Plass, & Homer, 2006).
activities undertaken by a user that is applicable to learning in VE technologies. VR environments are inherently non-passive, where the user must make choices or actions to advance through presented content. Students can describe the type and depth of their learning activity through open-ended questioning which may subsequently be classified as active (activation of existing knowledge, encoding new information), constructive (assimilating or accommodating new knowledge) or interactive (self-construction, sequential or co-construction of knowledge). This framework focuses on understanding how different learning activities can benefit or foster learning (Chi, 2009). Tests of content may only determine students’
CHAPTER 3: Methodology Research Design
This study investigated the relationship between 6th and 9th grade students’ cognitive dimensions on perceptions of virtual presence and sought to further the contemporary
understanding of virtual presence and how it varies among individuals given an identical 3-D HE VR experience. In addition, this study explored the students’ learning gains and activities prior to, during and after 3-D HE VR instruction on cardiac anatomy and physiology. Using the Campbell and Stanley (1963) research design notation, where X represents the exposure of a participants to a measurable experimental variable or event and O refers to the process of observation and measurement, the research design is as follows.
Experimental O1 X O2
Within the O1 condition participants took an Inventory of Piaget’s Developmental Tasks (IPDT) task and pre-test of cardiac knowledge. The treatment condition consisted of participants using the 3-D, haptic-enabled virtual reality system where student engaged in open-ended
questioning to elicit their cognitive engagement in learning activities. The O2 condition
consisted of participants taking a presence survey and a content post-test on cardiac knowledge. Participants and assessments are described in the sections below.
Participants
the formal operational stage (9th grade). Students were recruited for this study through science and health classes via personal visits to their respective schools. Seventy-five 6th grade students participated from a public middle school in an urban setting. Seventy-six 9th grade students participated from an urban (N=50) and a rural (N=26) public high school. Schools were matched by socioeconomic status (SES), race, ethnicity and gender. The pool of 6th grade participants included 29 males and 46 females, who identified as White (N=42), African American (N=24), Asian (N=8), Native American or American Indian (N=8), Hispanic, (N=16), non-Hispanic (N=59), and Native Hawaiian or other Pacific Islander (N=3) with a mean age of 11.22 years (Median=11, Mode=11). The pool of 9th grade participants included 32 males and 44 females who identified as White (N=50), African American (N=19), Asian (N=7), Hispanic, (N=22), non-Hispanic (N=54), and Native American or American Indian (N=5), with a mean age of 14.26 years (Median=14, Mode=14). Students had the opportunity to select more than one racial affiliation which was accounted for in total numbers. Students with consent who completed three assessments (i.e. pre and post cardiac content tests, inventory of Piaget’s developmental tasks, and presence survey) were included in the study.
Equipment
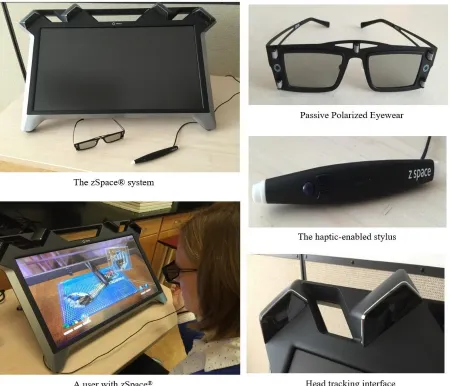
Figure 1 shows the components of the zSpace® system, a close-up view of the 3-D glasses, the 3-button haptic enabled stylus, a close-up view of the head tracking interface, and an individual engaged with the hardware and software of the system during the training session.
Figure 1. The zSpace® System. (Hite, 2016a).
Instruction/Treatment/Intervention
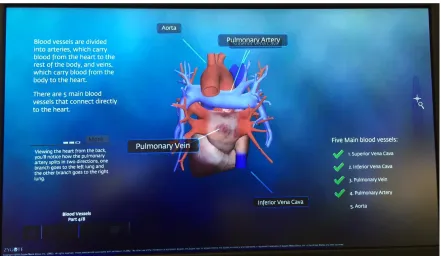
moving, rotating, scaling and dissembling objects using the haptic-enabled stylus, wearing the 3-D eyeglasses, and navigating the virtual environment. During this session, participants had the opportunity to use the system to virtually dissemble a robotic arm, examine butterflies, and dissect various objects (e.g. plants, animals, molecules, microbes, planets, motors, engines, etc.) of their choosing. The second session (treatment) each subject individually interacted with the zSpace® system. Prior to specific instruction on heart anatomy and physiology, students were prompted to write one question about the structure and function of the human heart (see Appendix C). Once completed, students were presented with instruction on cardiac anatomy and function (see Appendix D) called zAnatomy®. This software application included eight scripted slides providing rich images of the cyclic contraction of the human heart while mirroring the heart-beat via haptic vibrations (pulsation) in real time. Figure 2 is a screenshot of
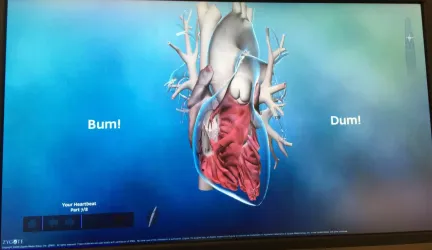
zAnatomy® and Figure 3 shows the haptic feedback feature in zAnatomy®.
Figure 3. A screenshot of Part 7/8 of zAnatomy® on zSpace® (Hite, 2016c).
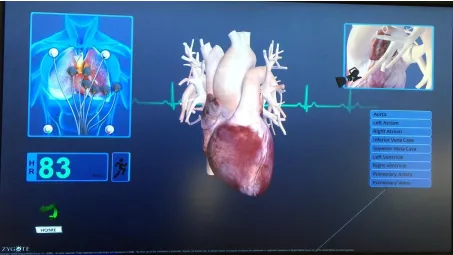
At the conclusion of 25-30 minutes of instruction, students were asked a second time to write a question on the topic of cardiac form and function (Appendix C). After asking their second question, students engaged in a free-choice environment that allowed them to explore the human heart (zExperience®). In this module, students were given a haptic-enabled heart that could be labeled with terminology, made transparent, and closely examined with the use of a user-directed virtual camera. Participants explored the heart at their own pace where they
experienced touch feedback through haptic pulsation, viewed labels and vocabulary, manipulated the heart rate and its position on the screen. Figure 4 is a screenshot of the zExperience® heart on the zSpace® system and Figure 5 demonstrates a user interacting with the heart in
Figure 4. A screenshot of the heart in zExperience® on zSpace® (Hite, 2016d).
Upon completion of 15-20 minutes using zExperience®, participants wrote the third and final question on cardiac form and function (Appendix C). Immediately after completing their experience on the zSpace® system, participants answered the presence survey including of sixty-two 6-point likert scale items that contributed to their virtual presence (e.g. control, sensory factors, distraction, and realism) (see Appendix E). After 3 days (9th grade students) and one to two weeks (6th grade students), study participants were post-tested on cardiac anatomy and physiology concepts related to their experiences in the zSpace® treatment (Appendix B). For middle grade students who were delayed in post-testing, participants were given 2 minutes on the zSpace® Experience® application to remind them of the human heart’s structure and vocabulary. Open-ended questions (1 and 30) of the student cardiac content assessment was scored with a rubric and selected response questions were scored with an answer key (questions 2 through 29) (See Appendix E).
Assessments and Data Analysis
Test of Cardiac Knowledge. A 30 question assessment (28 selected response items and 2 open-ended questions) was created by a team of three science educators and influenced by Dwyer’s research (1972; 1978) on visual strategies teaching and assessing student understanding of the human heart. The test was structured after Dwyer’s (1972) schema of a cardiac
exploit the 3-D, haptic and virtual nature of the instruction (questions 17, 19, 21, 23, 24, 25, 27, 28, 29 and 30) (Appendix B). Reliability for the test of cardiac knowledge was completed using Kuder-Richardson (KR) 20 formula as a check of the internal consistency of test items. KR-20 is a reliability measure sensitive to content heterogeneity; the degree in which the test items measure related characteristics (Reynolds, Livingston, & Willson, 2009). It is most applicable for analysis as these two tests were assessing a single homogenous domain of knowledge in a single, untimed test administration. Therefore, it examines the consistency of responses with varying item difficulties among all individual items on each respective test (Reynolds et al., 2009). For the KR-20 analysis, participant answer choices were recorded as 0 (incorrect) or 1 (correct) for each item and totaled. Each test administration, pre-treatment and post-treatment, were
evaluated for reliability. Twenty-eight selected response items were given to 151 participants with consent twice (prior to and after the zSpace® treatment). The ρKR20 values were calculated as 0.577 for 6th grade and 0.707 for 9th grade. Table 2 below shows KR-20 values for each test administration.
Table 2
Reliability Data for Four Administrations of a Test of Cardiac Knowledge
K ∑(pq) σ2 ρKR20
6th Grade
Pre-test 28 5.20 8.54 0.405
Post-test 28 5.20 18.7 0.749
9th Grade
Pre-test 28 5.20 11.9 0.583
Post-test 28 5.20 26.0 0.830
Note: Kuder and Richardson Formula 20: Values range from 0 to 1. High values indicate reliability, values <0.90 indicates homogenous test. Value of <0.6 is acceptable for research.
Spearman’s rank correlation (rho) coefficients were made to determine relationships between students’ (test scores of) cardiac knowledge and student’s presence scores as well as students’ scores on IPDT tasks.
Questions 1 and 30 on the student cardiac assessment were scored using a rubric created by three science educators and informed by Dwyer (1972; 1978) regarding students’ knowledge of the human heart. For question 1, interrater agreement was completed on 60 out of 302 responses, for a total of 86.0% agreement. For question 30, interrater agreement was completed on 60 out of 302 responses, for a total of 87.6% agreement. A Wilcoxin signed-ranks test was performed to evaluate the significance between pre-treatment and post-treatment administrations.
Presence Survey. The presence survey contained questions designed to understand 6th and 9th grade students’ perceived presence during science-based investigations by recording students’ perceptions of control, sensory, distraction, and realism within the virtual environment. The framework of the presence survey was built from Witmer’s and Singer’s presence questionnaire stem questions (1998, p. 232) and other research on students’ perceptions of presence (Childers & Jones, 2015; Jones et al., 2015). Survey items were categorized into the four presence constructs and additional questions were added to each category to reflect the 3-D and HE capabilities of the zSpace® system. A panel of science educators, middle school students, zSpace® educators and computer programmers with specialized knowledge this technology reviewed and refined each item. Study participants were asked to indicate their level of
heart. The survey is a Likert scale format from 1-6 (i.e. strongly disagree to strongly agree). The presence survey was taken online or on paper and aggregated using Qualtrics software. Presence statements were analyzed by item and by construct using the Mann-Whitney U test (2-tailed, alpha = 0.005) to ascertain significance between age groups within each construct of control, sensory, distraction, and realism, respectively. Cronbach’s alpha was calculated with a reliability value of 0.933, 0.762, 0.769, 0.705 and an overall value of 0.934 for 6th grade student responses and 0.927, 0.776, 0.797, 0.677 for an overall value of 0.953 for 9th grade responses. Values for both groups demonstrate a strong internal consistency of items and responses. Cronbach’s alpha was calculated for both groups was 0.944 (N=151, for 86 total items). Table 3 shows reliability values for 6th and 9th grade student scores on the presence survey. Correlations using
Spearman's rank correlation (rho) coefficients were made to determine relationships between presence scores and IPDT tasks.
Table 3
Reliability Measures (Cronbach’s Alpha) by Control, Sensory, Distraction, and Realism Items
Presence Category 6th Grade (N =75)
9th Grade (N =76)
6th and 9th Grade (N =151)
Control Items (N = 21) 0.933 0.927 0.930
Sensory Items (N = 8) 0.762 0.776 0.768
Distraction Items (N = 17) 0.769 0.797 0.781
Realism Items (N = 15) 0.705 0.677 0.691
Whole Test (N = 82)a 0.934 0.953 0.944
Note: α ≥ 0.9, Excellent; 0.7 ≤ α < 0.9, Good; 0.6 ≤ α < 0.7, Acceptable, 0.5 ≤ α < 0.6, Poor; α
< 0.5, Unacceptable
aContains items not reported here.
distance), 14 items on images (levels, perspective, movement, shadows), 12 items on relations (sequence, seriation, inference), and 14 items on classification (matrix, symbols, classes,
inclusion). Items were scored as correct or incorrect; students demonstrated proficiency in a sub area with a minimum of 75% of questions (three out of four) correct (Patterson & Milakofsky, 1980). Cronbach’s alpha was calculated with a reliability value of 0.791 (N=18) for 6th and 9th grade student responses. This value shows a strong internal consistency of items and responses. Table 4 shows the relationships between construct areas, subtests and item difficulty on the Inventory of Piaget’s Developmental Tasks (IPDT). Correlations using Spearman’s rank correlation (rho) coefficients were made to determine relationships between IPDT constructs, subtests and cognitive classifications to cardiac assessment scores, learning activities and presence scores.
Table 4
Inventory of Piaget’s Developmental Tasks (IPDT) Cognitive Classifications (by age) and Construct, Subtest
Classification (N=16)
Images (N=16)
Conservation (N=16)
Relations (N=12)
Laws (N=12) Low Range (7-8)
(N=24)
Matrix Symbols
Movement Quantity Sequence Seriation
--
Midrange (9-10) (N=24)
-- Levels
Perspective Shadows
Weight Distance
-- Rotation
High Range (11-13) (N=24)
Classes Inclusion
-- Volume Inference Angles
Probability
Note: Each of the 18 subtests contained 4 questions each. Inventory total, N=72
Questions on Cardiac Form and Function. To explore students’ learning about the heart,
when using zSpace®, “When you think about the structure and function of the human heart, what you like to know more about? Please list at least 1 question.” Student responses were recorded on paper, transcribed into Excel® and coded. A second science education researcher coded 120 of 453 student questions and interrater agreement was 95.3%. Responses were coded to capture themes of students’ learning and recoded with a second pass to capture salient features of the data (Creswell & Creswell, 2013), ensuring each student response was correctly categorized to the open codes established after the first pass. On a third round of coding, learning theory was applied to the statements using the active-constructive-interactive framework proposed by Chi (2009) to discern how the learning activities in zSpace® influenced students’ learning trajectories (active, constructive and interactive) of the heart over the course of the intervention. Active questions were defined in the framework as the lowest level of learning activity; underscored by questions where students activated existing knowledge, searched their existing knowledge, incorporated new information into or reorganized cognitive schemas. Active questions included student learning intentions, checks of prior knowledge, questions on heart form (appearance, terminology, shape, size, external features, composition, blood flow, blood volume), and heart function (general, heartbeat, and external structures). Constructive questions, the second level of learning activity, were categorized by student questions that indicated a restructuring of and repair of faulty knowledge or organization of personal knowledge beyond the scope of the presented instruction. Constructive questions included relating heart form to function, advanced functions of the heart (role of valves, regulation of heart rate, process of oxygenation), the role of the heart in overall health, and system relationships (heart-lung relationship, the heart as a
interaction with the technology where new knowledge was generated from an expert’s contributions (zSpace®). Interactive questions included questions beyond the scope of the content presented in the treatment, including heart homology and analogy to other species, aspects of heart malfunction (attack or infarction, failure, diseases or disorders, and arrhythmia), transplantation issues and methods of dissection and modeling. A two-way Analysis of Variance (ANOVA) was performed to explore interactions between student learning activities, grade level and time. A three-way ANOVA was used to determine interaction between prior cardiac
knowledge (pre-test score) and student learning activity. Correlations using Spearman’s rank correlation (rho) coefficients were made to determine relationships between student learning activities and IPDT tasks.
Limitations of the Study
Results of this study are limited to responses of participants who participated in zSpace® sessions and their retrospective reports about using the technology. The degree to which this sample is representative of perceptions of presence in 3-D HE VR is unknown. A limitation cited within existing presence research is the sole reliance on self-report (questionnaire) based measures to describe or generalize virtual presence (Slater 1999; Slater, 2004; Slater & Garau, 2007). Self-report measures, like the presence survey, have been shown to be effective in
measuring user perceptions but not user responses to the virtual environment (Bailenson, Swinth, Hoyt, Persky, Dimov, & Blascovich, 2005, p.390). To address this and similar types of
limitations, Azevedo (2015) recommends converging multiple sources of trace, product, and self-report data to cultivate an accurate model of learning (p.92). Product data (which may include knowledge construction if assessments are open-ended) are commonly used in education
CHAPTER 4: Results
Thirty-four analyses were conducted to explore significant differences, relationships, and interactions between study assessments. In the sections that follow the affordances of 3-D HE VR instruction for learning, comparison between 6th and 9th grade perceptions of presence, relationships between cognitive development and perceptions of presence, influence of 3-D HE VR instruction on conceptual understandings, and the relationship between prior knowledge and perceptions of presence are discussed. Table 5 describes the analyses and assessments related to each research question.
Table 5
Assessments and Analyses Related to Research Questions
Assessments Analyses
Research Question 1
Does a 3-D, haptic-enabled virtual reality technology experience promote understanding of cardiac anatomy and physiology for 6th and 9th grade
students?
Test of Cardiac Knowledge
Paired T-Test (Table 6) Wilcoxin Signed Ranks Test (Tables 7, 8)
Research Question 2
How do 6th and 9th grade science students compare in their perceptions of presence when engaged in 3-D, haptic-enabled virtual reality instruction?
Presence Survey Mann-Whitney U (Tables 9, 10, 11, 12)
Research Question 3
Is there a relationship between 6th and 9th grade students’ cognitive dimensions and perceptions of presence?
Inventory of Piagetian Developmental Tasks (IPDT) Presence Survey
Spearman’s Rho Correlation (Tables 13, 14, 15, 16, 17, 18)
Research Question 4
Does 3-D, haptic-enabled virtual reality technology influence learning for 6th and 9th grade students?
Student Questions Presence Survey IPDT
The analysis of the cardiac knowledge test for 6th and 9th grade students showed there were significant learning gains for both 6th and 9th grade (Table 6). For the 6th grade group, the pre-assessment mean was 30.17, (SD = 10.40) and the post assessment mean was 38.17 (SD = 15.62) with an alpha value of p < 0.05. Values for pre and post cardiac test scores for 9th grade were also significantly different (pre-assessment mean of 33.97 (SD = 12.85) and a post
assessment mean of 49.90 (SD = 19.02)). These differences from pre to post instruction suggest the zSpace® system was effective in teaching students about cardiac anatomy and function at both grade levels.
Table 6
Results of 6th and 9th Grade Student Scores on a Test of Cardiac Knowledge
Mean Standard Deviation
Degrees of Freedom
Test Statistic p-value 6th Grade
Pre-test 30.17 10.40 74 -4.60 0.000*
Post-test 38.17 15.62
9th Grade
Pre-test 33.97 12.85 75 -8.90 0.000*
Post-test 49.90 19.02
Note: Paired T-Test for 2 sample means: Alpha 2-tailed, * p < 0.05.
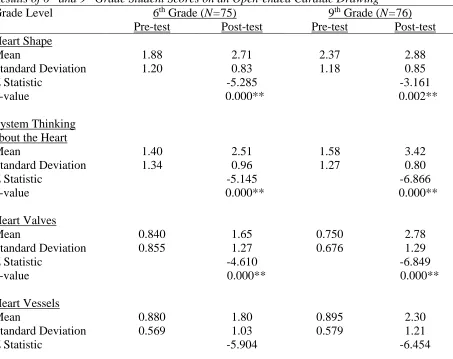
The open-ended cardiac drawing test, asked students to sketch and label the human heart from memory and the assessment was scored for five categories (heart shape, systems thinking,
Table 5 Continued
ANOVA (Table 23)
Spearman’s Rho Correlation (Tables 24, 25, 26, 27, 28, 29, 30)
Research Question 5
Is there a relationship between 6th and 9th grade students’ content knowledge and perceptions of presence?
Test of Cardiac Knowledge Presence Survey IPDT
ANOVA (Table 31)
heart valves, heart vessels and heart chambers). The Wilcoxin signed ranked test showed there were significant learning gains for both 6th and 9th grade students (Table 7). The analysis showed that the zSpace® treatment resulted in differences in 6th grade that were statistically different for spatial understandings of heart shape (Z = 5.285, p = 0.000), systems thinking of the heart (Z = -5.145, p = 0.000), heart valves (Z = -4.610, p = 0.000), heart vessels (Z = -5.904, p = 0.000), and heart chambers (Z = -5.143, p = 0.000). There was a significant change in 9th grade students’ spatial understandings of heart shape (Z = 3.161, p = 0.002), systems thinking of the heart (Z = -6.866, p = 0.000), heart valves (Z = -6.849, p = 0.000), heart vessels (Z = -6.454, p = 0.000), and heart chambers (Z = -6.446, p = 0.000).
Table 7
Results of 6th and 9th Grade Student Scores on an Open-ended Cardiac Drawing
Grade Level 6th Grade (N=75) 9th Grade (N=76)
Pre-test Post-test Pre-test Post-test Heart Shape
Mean 1.88 2.71 2.37 2.88
Standard Deviation 1.20 0.83 1.18 0.85
Z Statistic -5.285 -3.161
p-value 0.000** 0.002**
System Thinking about the Heart
Mean 1.40 2.51 1.58 3.42
Standard Deviation 1.34 0.96 1.27 0.80
Z Statistic -5.145 -6.866
p-value 0.000** 0.000**
Heart Valves
Mean 0.840 1.65 0.750 2.78
Standard Deviation 0.855 1.27 0.676 1.29
Z Statistic -4.610 -6.849
p-value 0.000** 0.000**
Heart Vessels
Mean 0.880 1.80 0.895 2.30
Standard Deviation 0.569 1.03 0.579 1.21
Table 7 Continued
p-value
0.000**
0.000** Heart Chambers
Mean 1.19 1.96 1.38 2.87
Standard Deviation 0.849 1.10 1.10 1.14
Z Statistic -5.143 -6.446
p-value 0.000** 0.000**
Note: Wilcoxin Signed Ranked Test: Alpha 2-tailed, * p < 0.05, ** p < 0.01 The highest possible score per category is 4, the lowest a 0.
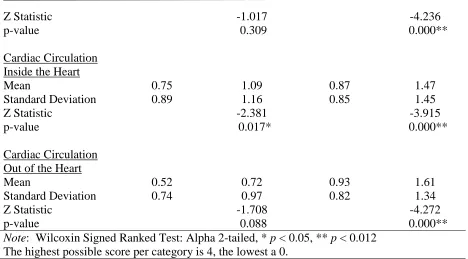
An assessment of open-ended assessment of cardiac circulation asked 6th and 9th grade students to trace the cardiac blood flow in three categories (circulation to the heart, within the heart and out of the heart). The Wilcoxin Signed Ranked Test showed there were significant learning gains for both 6th and 9th grade students for cardiac physiology and function (Table 8). For 6th grade students, there were no significant changes in their conceptual understanding of cardiac blood flow into the heart (Z = 1.017, p = 0.309) and blood flow out of the heart (Z = -1.708, p = 0.088). However, there was a significant change in conceptual understanding of blood flow inside the heart (Z = -2.381, p = 0.017). There were significant differences in pre and post assessment scores for 9th grade students for their conceptual understanding of cardiac blood flow into the heart (Z = -4.236, p = 0.000), blood flow inside the heart (Z = -3.915, p = 0.000), and blood flow out of the heart (Z = -4.272, p = 0.000).
Table 8
Results of 6th and 9th Grade Student Scores on an Open-ended Assessment of Cardiac Circulation
Grade Level 6th Grade
(N=75)
9th Grade (N=76)
Pre-test Post-test Pre-test Post-test Cardiac Circulation
Into the Heart
Mean 0.80 0.95 1.12 1.80
Table 8 Continued
Z Statistic -1.017 -4.236
p-value 0.309 0.000**
Cardiac Circulation Inside the Heart
Mean 0.75 1.09 0.87 1.47
Standard Deviation 0.89 1.16 0.85 1.45
Z Statistic -2.381 -3.915
p-value 0.017* 0.000**
Cardiac Circulation Out of the Heart
Mean 0.52 0.72 0.93 1.61
Standard Deviation 0.74 0.97 0.82 1.34
Z Statistic -1.708 -4.272
p-value 0.088 0.000**
Note: Wilcoxin Signed Ranked Test: Alpha 2-tailed, * p < 0.05, ** p < 0.012 The highest possible score per category is 4, the lowest a 0.
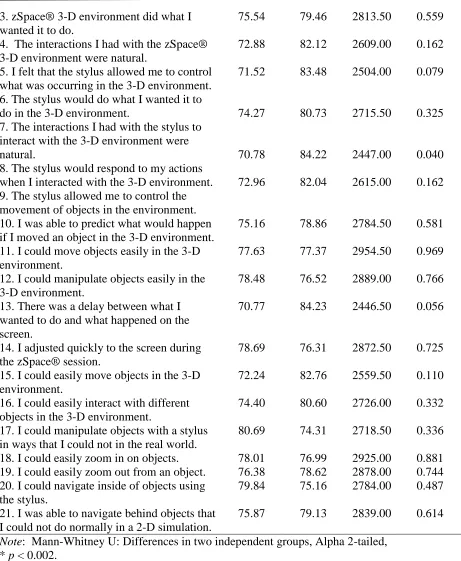
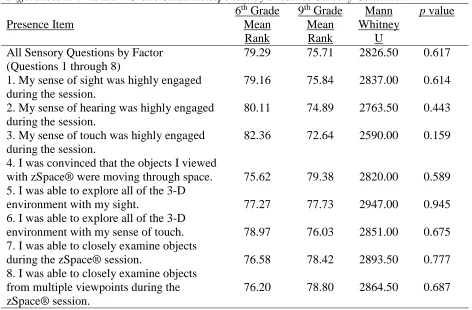
Tables 9, 10, 11 and 12 show the comparisons between 6th and 9th grade science students for perceptions of presence when engaged in 3-D, haptic-enabled virtual reality instruction. Using the Mann-Whitney U test to compare mean scores of perceived presence between 6th and 9th grade students, no significant differences were found for any items within the four presence constructs of control (Table 9), sensory (Table 10), distraction (Table 11), or realism (Table 12).
Table 9
Differences in 6th and 9th Grade Student Responses by Presence Control Construct
Presence Item
6th Grade Mean Rank
9th Grade Mean Rank
Mann Whitney
U
p value All Control Questions by Factor
(Questions 1 through 21)
1. I felt that I was in control of zSpace® 3-D environment during the session.
2. zSpace® 3-D environment would respond to my actions.