Gene Duplication and Spectral Diversification of Cone
Visual Pigments of Zebrafish
Akito Chinen, Takanori Hamaoka, Yukihiro Yamada and Shoji Kawamura
1Department of Integrated Biosciences, Graduate School of Frontier Sciences, The University of Tokyo, Chiba 277-8562, Japan Manuscript received September 30, 2002
Accepted for publication November 11, 2002
ABSTRACT
Zebrafish is becoming a powerful animal model for the study of vision but the genomic organization and variation of its visual opsins have not been fully characterized. We show here that zebrafish has two red (LWS-1 and LWS-2), four green (RH2-1, RH2-2, RH2-3, and RH2-4), and single blue (SWS2) and ultraviolet (SWS1) opsin genes in the genome, among whichLWS-2,RH2-2, andRH2-3are novel.SWS2, LWS-1, andLWS-2 are located in tandem andRH2-1, RH2-2, RH2-3, and RH2-4 form another tandem gene cluster. The peak absorption spectra (max) of the reconstituted photopigments from the opsin cDNAs differed markedly among them: 558 nm (LWS-1), 548 nm (LWS-2), 467 nm (RH2-1), 476 nm (RH2-2), 488 nm (RH2-3), 505 nm (RH2-4), 355 nm (SWS1), 416 nm (SWS2), and 501 nm (RH1, rod opsin). The quantitative RT-PCR revealed a considerable difference among the opsin genes in the expression level in the retina. The expression of the two red opsin genes and of three green opsin genes,RH2-1,RH2-3, andRH2-4, is significantly lower than that ofRH2-2,SWS1, andSWS2. These findings must contribute to our comprehensive understanding of visual capabilities of zebrafish and the evolution of the fish visual system and should become a basis of further studies on expression and developmental regulation of the opsin genes.
V
ISUAL pigments are photoreceptive molecules that and Bremiller1984). In a horizontal plane of the pho-occur in rod and cone photoreceptor cells in the toreceptor layer, the four types of cones are highly orga-retina and characterize the vision of an animal. They nized in a regular mosaic fashion (Robinsonet al.1993). consist of a protein moiety, opsin, and a chromophore, The spectral characteristics of the cone and rod cells either 11-cisretinal or 11-cis3,4-dehydroretinal in verte- are investigated with microspectrophotometry (MSP; brates. Vertebrate opsins have been classified into five Nawrockiet al.1985; Robinsonet al.1993; Cameron phylogenetic groups: rod opsin or the rhodopsin group 2002) (Table 1). Zebrafish has all five groups of the (RH1), ultraviolet-blue or the short-wave-sensitive-1 opsins and produces them all in the retina: RH1 in rods, cone-opsin group (SWS1), blue or the short-wave-sensi- LWS/MWS (red) in the long members of double cones, tive-2 cone-opsin group (SWS2), green or the rod-opsin- RH2 (green) in the short members of double cones, like cone-opsin group (RH2), and red-green or the long- SWS2 (blue) in long-single cones, and SWS1 (ultravio-to-middle-wave-sensitive cone-opsin group (LWS/MWS; let) in short-single cones (Raymond et al. 1993; V ih-Yokoyama2000). telic et al.1999). The cDNAs of all five groups of the Zebrafish (Danio rerio) is an excellent animal model opsins are cloned from the zebrafish retina including featuring high fecundity, rapid oviparous development, two subtypes of RH2 opsins (Vihtelicet al.1999). How-embryonic transparency, and mutant screening feasibil- ever, it has remained unknown whether the two RH2 ity (Detrichet al.1999). Zebrafish plays a pivotal role pigments show distinct absorption spectra and whether in our understanding of molecular mechanisms of the zebrafish has yet additional visual pigments.vertebrate visual system (Malicki2000) and the basic We previously isolated a rod opsin gene (RH1) from architecture of its retina has been well investigated. Ze- the zebrafish genome (Hamaoka et al. 2002). In this brafish has rods and four morphologically distinct study we aimed to examine the zebrafish genome for classes of cones in the retina: the long (or principal) the cone opsin genes, determine the absorption spectra and short (or accessory) members of double cones, of all visual pigments, and compare the expression level long-single cones, and short-single cones (Branchek among opsin genes in the retina to establish the
molecu-lar basis of visual capabilities of zebrafish.
Sequence data from this article have been deposited with the DDBJ/ EMBL/GenBank Data Libraries under accession nos. AB087803–10.
MATERIALS AND METHODS
1Corresponding author:Department of Integrated Biosciences,
Gradu-ate School of Frontier Sciences, The University of Tokyo, Seimeitou
Genomic library screening: A zebrafish genomic library was
#502, 5-1-5 Kashiwanoha, Kashiwa, Chiba 277-8562, Japan.
E-mail: [email protected] constructed previously from a strain (AB) of zebrafish using
The resulting DNA fragment was cloned into pBluescript II
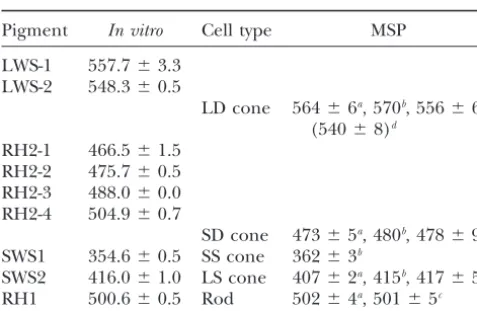
TABLE 1
(SK⫺) (designated as PCR-RH2-4, see Figure 1) and was
sub-Themax values (nanometers) of the zebrafish visual jected to DNA sequencing as described above. The DNA
se-pigments measured byin vitroreconstitution quence was confirmed in duplicate PCRs.
and MSP methods Southern hybridization:The genomic DNA was extracted
from a zebrafish (strain Tuebingen). Approximately 1g per lane of the zebrafish genomic DNA was digested with a restric-Pigment In vitro Cell type MSP
tion enzyme, electrophoresed on a 0.5% agarose gel, and LWS-1 557.7⫾3.3 transferred to a positively charged nylon membrane (Biodyne LWS-2 548.3⫾0.5 B, Pall) by using the VacuGene vacuum-blotting system (Phar-macia, Piscataway, NJ). For the probe preparation, the first LD cone 564⫾6a, 570b, 556⫾6c
361 bp of the coding region of zfgr1 (RH2-1), corresponding (540⫾8)d
to its exon 1, was PCR amplified from its full-length cDNA RH2-1 466.5⫾1.5
clone used in the library screening.Likewise, the exon 1 por-RH2-2 475.7⫾0.5
tions of zfgr2 (RH2-4; 361 bp), zfblue (SWS1; 340 bp), and RH2-3 488.0⫾0.0
zfuv (SWS2; 382 bp) were amplified from the corresponding RH2-4 504.9⫾0.7
cDNA clones. As for zfred (LWS-1), the first 393 bp of the SD cone 473⫾5a, 480b, 478⫾9c
coding region, corresponding to exons 1 and 2, were amplified SWS1 354.6⫾0.5 SS cone 362⫾3b
from the cDNA clone. Exon 1 ofRH2-2(361 bp) was amplified SWS2 416.0⫾1.0 LS cone 407⫾2a, 415b, 417⫾5c
from a genomic DNA clone containing the gene. The probe RH1 500.6⫾0.5 Rod 502⫾4a, 501⫾5c
labeling, hybridization, and washing were carried out in the same conditions as in the library screening.
aMeasured byCameron(2002).
Phylogenetic analysis:The deduced amino acid sequences
bMeasured byRobinsonet al. (1993).
of zebrafish opsins were aligned using CLUSTAL W (Thomp-cMeasured byNawrockiet al. (1985).
sonet al.1994) and the alignment was refined visually (Figure dMeasured byNawrockiet al. (1985) for larvae (6–8 dpf).
2). Their nucleotide sequences were aligned in accordance with the protein alignment. The percentages of nucleotide differences among the zebrafish opsin genes were calculated according to the alignment by excluding gap sites in pairwise the phage vector EMBL3 (Hamaoka et al.2002). For the
fashion. The dendrogram of zebrafish opsin genes (Figure 3) probe preparation, the cDNAs encoding full coding regions
was constructed from the nucleotide differences by using the of the LWS/MWS, RH2, SWS2, and SWS1 opsin genes were
neighbor-joining method (Saitouand Nei1987). isolated from the zebrafish ocular RNA by
reverse-transcrip-The following nucleotide sequences of the fish LWS/MWS tion (RT) polymerase chain reaction (PCR) using the
oligonu-and RH2 genes were retrieved from the GenBank database: cleotide primers designed on the basis of the published
nucle-goldfish (Carassius auratus) LWS/MWS (accession no. otide sequences of corresponding zebrafish opsin cDNAs,
L11867) and RH2 (L11865 for 1 and L11866 for GFgr-zfred (LWS/MWS), zfgr1 (RH2), zfgr2 (RH2), zfblue (SWS2),
2; Johnson et al. 1993), carp (Cyprinus carpio) LWS/MWS and zfuv (SWS1; Vihtelicet al.1999).
(AB055656), Mexican cavefish (Astyanax fasciatus) LWS/MWS The cDNA probes were labeled with [␣-32P]dCTP using the
(M90075 for R007, M38619–24 for G101, and M60938–40 and random primer method. Plaque hybridization was carried out
M60943–5 for G103; Yokoyama and Yokoyama 1990) and at 65⬚ in the solution consisting of 6⫻ SSC, 5⫻ Denhardt’s
RH2 (S75251–5; Registeret al.1994), cichlid (Dimidiochromis solution, 0.5% SDS, and 5 g/mlEscherichia coli DNA. The
compressiceps) LWS/MWS (AF247125) and RH2 (AF247121; hybridized membranes were washed in 1⫻SSC/0.1% SDS at
Carleton and Kocher2001), tilapia (Oreochromis niloticus) 65⬚four times (20 min each), which allowsⵑ20% mismatch
LWS/MWS (AF247128) and RH2 (AF247124; Carletonand (Sambrookand Russel2001). Three overlapping clones,
zf-Kocher2001), halibut (Hippoglossus hippoglossus) LWS/MWS B31,zf-B26, andzf-B29, encompassing a SWS2 gene (SWS2)
(AF316498) and RH2 (AF156263; Helviket al.2001), medaka and two LWS/MWS genes (LWS-1andLWS-2) were isolated
(Oryzias latipes) LWS/MWS (AB001604) and RH2 (AB001603; (Figure 1). Seven overlapping clones,zf-C6,zf-C2,zf-C7,
Hisatomi et al. 1997), fugu (Takifugu rubripes) RH2 (AF-zf-C13, zf-C1, zf-C3, and zf-C16, were isolated
encom-226989), mullet (Mullus surmuletus) RH2 (Y18680), and sand passing four RH2 genes (RH2-1,RH2-2,RH2-3, andRH2-4).
goby (Pomatoschistus minutus) RH2 (Y18679). As outgroup ref-Two overlapping clones,zf-A34 andzf-A7, encompassing a
erences of the fish genes, the following genes were used: SWS1 gene (SWS1) were isolated. After restriction mapping
pigeon (Columba livia) LWS/MWS (AF149243–8) and RH2 of these clones, the restriction fragments hybridized to the
(AF149232–3), chicken (Gallus gallus) LWS/MWS (M62903) screening probes were subcloned into the pBluescript II
and RH2 (M88178), zebra finch (Taeniopygia guttata) LWS/ (SK⫺) plasmid vector (Stratagene, La Jolla, CA). Sequencing
MWS (AF222333) and RH2 (AF222330), canary (Serinus cana-of these subclones was carried out for both strands, using a
ria) LWS/MWS (AJ277925) and RH2 (AJ277924), American Thermo Sequenase cycle sequencing kit (Amersham,
Piscata-chameleon (Anolis carolinensis) LWS/MWS (U08131) and RH2 way, NJ) with dye-labeled primers and the LI-COR 4200L-1
(AF134189-91), gecko (Phelsuma madagascariensis) LWS/MWS automated DNA sequencer.
(AF074043) and RH2 (AF074044), salamander LWS/MWS
Genomic PCR cloning: A 1.9-kb genomic DNA containing
(Ambystoma tigrinum; AF038947), and frog LWS/MWS (Xeno-entireRH2-4was isolated by the PCR method from the same
pus laevis; U90895). DNA source used for the genomic library construction. The
for-Alignments of the LWS/MWS genes and the RH2 genes ward (5⬘-TGGATCTTTAGCAGGTAGAG-3⬘) and reverse (5⬘-TAC
were carried out by their deduced amino acid sequences using AGTACATTTCAACCAAAATA-3⬘) primers correspond to the
CLUSTAL W and were refined visually. Their nucleotide se-20 nucleotides (nt) immediately upstream of the start codon
quences were aligned in accordance with the protein align-and the reverse complement sequence of 196–174 nt
down-ments. Subsequent phylogenetic analyses were conducted us-stream of the stop codon of zfgr2 of Vihtelicet al. (1999),
ing the MEGA2 program version 2.1 (Neiand Kumar2000; respectively. PCR was carried out at 95⬚for 5 min followed by
fish LWS/MWS and RH2 opsin genes were calculated to be LWS-1,LWS-2,RH2-1,RH2-2,RH2-3,RH2-4,SWS1,SWS2, and RH1, the pBluescript-cDNA clones isolated for visual pigment 1.08 and 0.95, respectively, and the percentage of synonymous
nucleotide differences among the fish LWS/MWS genes and reconstitution were used for the standard templates. The cDNA clones of the known concentrations were prepared for among fish RH2 genes were calculated using the modified
Nei-Gojobori method (Ina 1995) by setting the transition/ a series of dilutions over three orders of magnitude. The real-time PCR was conducted for each opsin cDNA using the gene-transversion ratio at 1.0 for both LWS/MWS and RH2 genes.
The number of nucleotide substitutions per site (d) for two specific primer pairs (the internal forward and the external reverse primers forRH1and the external primer pairs for the sequences was estimated by the Tamura and Nei (1993)
method with gap sites excluded in pairwise fashion. The phylo- others; see Table 2) by 40 cycles of 95⬚for 30 sec, 55⬚for 30 sec, 72⬚for 60 sec, and 80⬚for 8 sec. The reaction contained genetic tree was reconstructed by applying the
neighbor-join-ing method to thedvalues. The reliability of the tree topology 1.25 units of R-PCR Ex Taq polymerase (TaKaRa), 1⫻R-PCR buffer (TaKaRa), 3 mm of MgCl2, 0.3 mm each of dNTP, was evaluated by bootstrap analysis with 1000 replications. For
protein-tree construction, the number of amino acid substitu- 1:30,000 dilution of SYBR Green I (Molecular Probes), and 0.5 meach of the forward and reverse primers in a total tions per site was estimated by Poisson correction (Nei and
Kumar2000) and the phylogenetic tree was reconstructed by volume of 25l. The standard regression line was obtained for each opsin gene, which showed the negative linear correlation the neighbor-joining method with 1000 bootstrap replications.
Visual pigment reconstitution: Using the total RNA pre- between logarithmic values of the initial DNA concentrations
and the threshold cycles. For all opsin genes, values of the pared from the eyes of an adult zebrafish (strain AB), which
is a different individual from that used for construction of the correlation coefficient were between⫺0.99 and⫺1.0. To estimate the relative amount of mRNA among the nine genomic library, we synthesized the first-strand cDNA by using
a poly(dT) primer {5⬘-AAGCAGTGGTAACAACGCAGAG opsin genes from the DNA amount evaluated by the real-time PCR, the difference of the RT efficiencies among the nine TACT(30)VN-3⬘ [V⫽A, G, or C;N⫽A, C, G, or T; T(30),
30 succession of T]}. The sequences of forward and reverse opsin genes was evaluated. The sense-strand RNA was tran-scribedin vitrofrom the pBluescript-cDNA clones of the nine primers (external primers) specific toLWS-1,LWS-2,RH2-1,
RH2-2,RH2-3,RH2-4,SWS1,SWS2, andRH1were taken from opsin genes. The reaction was carried out using 1g of the linearized cDNA, T3 or T7 RNA polymerase (Epicentre, Madi-immediately upstream of their start codons and Madi-immediately
downstream of their stop codons, respectively (Table 2). PCR son, WI), 1⫻reaction buffer (Epicentre), 7.5 mmeach NTPs, and 10 mmDTT in a total volume of 20l at 37⬚for 2 hr. was carried out using the high-fidelity Pyrobest DNA
polymer-The concentration of the transcribed RNA was determined ase (TaKaRa, Berkeley, CA) at 95⬚for 5 min followed by 35
by measuring the optical density at 260 nm. Then 120 ng of cycles of 94⬚for 30 sec, 55⬚for 5–60 sec, and 72⬚for 1 min.
LWS-2and 60 ng each of the other eight opsin RNAs were The resulting DNA fragments were cloned into the pBluescript
mixed together and were reverse transcribed, using their gene-II (SK⫺) plasmids and were subjected to DNA sequencing
specific external reverse primers (Table 2) simultaneously in as described above. The DNA sequences were confirmed in
the same tube to set the reaction conditions identically among duplicate PCRs. The entire coding regions of the cDNAs were
the nine genes. The reaction was carried out at 42⬚ for 90 further amplified from these pBluescript-cDNA clones by the
min in a total volume of 20l containing 5 units of ReverTra forward and reverse primers (internal primers) set in 5⬘- and
Ace reverse transcriptase (Toyobo), 1⫻ReverTra Ace buffer 3⬘-edges of the coding regions, respectively (Table 2). The
(Toyobo), 1 mmeach of dNTP, and 0.1meach of the primers. forward and reverse primers containEcoRI andSalI linkers,
After the reaction, 80l of water was added and the solution respectively, and the Kozak (1984) sequence was inserted
was incubated at 72⬚for 7 min. Two microliters from 100l betweenEcoRI and the initiation codon in the forward primers
of the RT solution was subjected to the real-time PCR. The to promote translation as previously described (Kawamura
real-time PCR was carried out in the conditions described and Yokoyama 1998). The amplified DNA fragments were
above two to three times for each opsin gene. The initial DNA cloned into theEcoRI/SalI-digested pMT5 expression vector
amount in the PCR solution was estimated using the standard (Khoranaet al.1988), which contains the last 15 amino acids
regression line for each opsin gene. The ratio (R) of the of the bovine rod opsin necessary for immunoaffinity
purifica-estimated DNA amount to the original RNA amount was calcu-tion by 1D4 monoclonal antibody (Moldayand Mackenzie
lated for each opsin gene with standard deviations (r). Then 1983). The nucleotide sequences of the pMT5-cDNA clones
ratio ofRin pigmentX(Rx) toRinLWS-1(RLWS1) was calcu-were confirmed to match those of the template
pBluescript-lated (Rx/RLWS1⬅ Ax) and the standard deviation of Ax was cDNA clones.
given by (Rx/RLWS1)√(rx/Rx)2⫹(rLWS1/RLWS1)2⬅ax. The Ax The pMT5-cDNA clones were expressed in cultured COS-1
values were averaged for five RT reactions (兺5
i⫽1Axi/5⬅Ax) cells (RIKEN Cell Bank, Tsukuba, Japan), incubated with
11-and the st11-andard deviations of Ax values were given by cisretinal, and the resulting pigments were purified using the
immobilized 1D4 (The Cell Culture Center, Minneapolis ) by √兺5
i⫽1(Axi⫺Ax)2/4⫹√兺i5⫽1a2xi/5 (⬅ax), whereAxiandaxistand forAx and ax values at the ith RT experiment, respectively. following the method described in Kawamuraand Yokoyama
(1998) with minor modifications. The UV-visible absorption TheAx⫾ax, values were defined as the relative RT efficiencies. Three adult fish (1 year old, strain AB) were killed at 1.5 spectra of the visual pigments were recorded at 20⬚ at least
five times for each pigment using the Hitachi U3010 dual- hr after onset of the light and three young adults (2 months old, strain AB) were killed at 7 hr after the light onset, all of beam spectrometer.
Quantitation of mRNA expression level by real-time RT- which had been raised under 14-hr light/10-hr dark cycles.
For each fish, the nine opsin mRNAs were reverse transcribed
PCR:Real-time PCR was carried out using the Smart Cycler
system (Applied Cepheid), where the amount of the PCR from the total ocular RNA (ⵑ1g), using the gene-specific reverse primers (the external reverse primers in Table 2) product was monitored through progression of PCR cycles by
the fluorescence intensity of SYBR Green I (Molecular Probes, simultaneously in the same tube in the conditions described above. The real-time PCR was carried out three times for each Eugene, OR) intercalated in the double-stranded DNA. The
cycle number where the secondary derived function of the opsin gene in the conditions described above. The initial DNA amount of pigmentX(Dx) in the PCR solution was estimated fluorescence intensity gives the highest peak was defined as
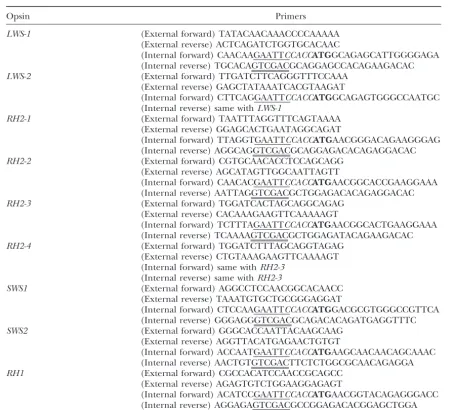
TABLE 2
List of the oligonucleotide PCR primers used for the visual pigment reconstitution
Opsin Primers
LWS-1 (External forward) TATACAACAAACCCCAAAAA (External reverse) ACTCAGATCTGGTGCACAAC
(Internal forward) CAACAAGAATTCCACCATGGCAGAGCATTGGGGAGA (Internal reverse) TGCACAGTCGACGCAGGAGCCACAGAAGACAC LWS-2 (External forward) TTGATCTTCAGGGTTTCCAAA
(External reverse) GAGCTATAAATCACGTAAGAT
(Internal forward) CTTCAGGAATTCCACCATGGCAGAGTGGGCCAATGC (Internal reverse) same withLWS-1
RH2-1 (External forward) TAATTTAGGTTTCAGTAAAA (External reverse) GGAGCACTGAATAGGCAGAT
(Internal forward) TTAGGTGAATTCCACCATGAACGGGACAGAAGGGAG (Internal reverse) AGGCAGGTCGACGCAGGAGACACAGAGGACAC RH2-2 (External forward) CGTGCAACACCTCCAGCAGG
(External reverse) AGCATAGTTGGCAATTAGTT
(Internal forward) CAACACGAATTCCACCATGAACGGCACCGAAGGAAA (Internal reverse) AATTAGGTCGACGCTGGAGACACAGAGGACAC RH2-3 (External forward) TGGATCACTAGCAGGCAGAG
(External reverse) CACAAAGAAGTTCAAAAAGT
(Internal forward) TCTTTAGAATTCCACCATGAACGGCACTGAAGGAAA (Internal reverse) TCAAAAGTCGACGCTGGAGATACAGAAGACAC RH2-4 (External forward) TGGATCTTTAGCAGGTAGAG
(External reverse) CTGTAAAGAAGTTCAAAAGT (Internal forward) same withRH2-3
(Internal reverse) same withRH2-3
SWS1 (External forward) AGGCCTCCAACGGCACAACC
(External reverse) TAAATGTGCTGCGGGAGGAT
(Internal forward) CTCCAAGAATTCCACCATGGACGCGTGGGCCGTTCA (Internal reverse) GGGAGGGTCGACGCAGACACAGATGAGGTTTC
SWS2 (External forward) GGGCACCAATTACAAGCAAG
(External reverse) AGGTTACATGAGAACTGTGT
(Internal forward) ACCAATGAATTCCACCATGAAGCAACAACAGCAAAC (Internal reverse) AACTGTGTCGACTTCTCTGGCGCAACAGAGGA
RH1 (External forward) CGCCACATCCAACCGCAGCC
(External reverse) AGAGTGTCTGGAAGGAGAGT
(Internal forward) ACATCCGAATTCCACCATGAACGGTACAGAGGGACC (Internal reverse) AGGAGAGTCGACGCCGGAGACACGGAGCTGGA
EcoRI and SalI linkers are indicated with single and double underlines, respectively, the Kozak sequence with italic letters, and the initiation codons with boldface letters.
standard deviation (dx) was calculated. The relative RNA in tandem andRH2-1,RH2-2,RH2-3, andRH2-4genes amount was given by dividingDxby the relative RT efficiency were likewise located in tandem. The distance between (Dx/Ax⬅Ex) with the standard deviations given as (Dx/Ax)
SWS2 andLWS-1, evaluated by nucleotide sequencing √(dx/Dx)2⫹(ax/Ax)2⬅ex. Finally theExvalues were
normal-and restriction mapping as that between the stop codon
ized to set that ofLWS-1as one and those of the other opsin
of the former and the start codon of the latter, isⵑ2.5
genes as the relative values to it as Ex/ELWS1⫾(Ex/ELWS1)
√(ex/Ex)2⫹(eLWS1/ELWS1)2. kb. That betweenLWS-1and theLWS-2isⵑ1.8 kb. The
distances between RH2-1 andRH2-2, RH2-2and RH2-3, andRH2-3andRH2-4 areⵑ2.8,ⵑ2.6, andⵑ12 kb,
RESULTS
respectively. The two LWS/MWS genes contain six puta-tive exons and five introns whereas the others contain Isolation of genomic DNA clones of zebrafish cone
opsin genes: From the genomic library of a zebrafish, five exons and four introns (Figure 1). These exon-intron structures are highly conserved among the verte-we isolated two LWS/MWS opsin genes,LWS-1and
LWS-2; four RH2 opsin genes, RH2-1, RH2-2, RH2-3, and brate visual opsin genes (Yokoyama2000). In all genes splice junction signals (GT/AG) are conserved in all RH2-4; and one each of SWS1 and SWS2 opsin genes,
Figure1.—The physical maps of the zebrafish cone opsin genes. The coding regions are indicated by solid boxes with red, green, blue, and violet colors for LWS/MWS, RH2, SWS2, and SWS1 genes, respectively. The gene names are indicated below the boxes with their transcriptional orientations. The genomic regions covered by thephage and PCR clones are indicated above the physical maps. B,BamHI; Bg,BglII; E,EcoRI; H,HindIII; K,KpnI; Sc,SacI; Sl,SalI.
served, which include a lysine for the Schiff-base linkage region between zfgr1 andRH2-1is four, among which three are synonymous [T in the former and C in the to the chromophore in the seventh transmembrane
do-main (Wanget al.1980), a glutamate residue for the latter at site 447 (denoted T447C), A459G, and T504A] and one is nonsynonymous [T864G resulting in Ile in Schiff-base counter ion in the third transmembrane
do-main (Sakmar et al. 1989; Zhukovsky and Oprian the former and Met in the latter at amino acid residue 288 (denoted Ile288Met)]. Met at residue 288 of RH2-1 1989), two cysteine residues for the disulfide bond in
the first and second extracellular loops (Karniket al. (Figure 2) is highly conserved among vertebrate RH2 opsins including those of birds and reptiles. That be-1988), and multiple serines and threonines in the
C-ter-minal region for the targets of opsin kinase (Ohguro tween zfgr2 andRH2-4is six, among which five are syn-onymous (C72T, A108G, C514T, G540A, and G672A) et al.1994) (Figure 2).
Comparison of the genomic DNA clones to the pre- and one is nonsynonymous (C526T resulting in Pro176Ser). In this case, Ser at residue 176 of RH2-4 viously reported cDNA clones: Vihtelicet al. (1999)
isolated one species each of cDNA encoding LWS/MWS (Figure 2) is completely conserved among all vertebrate visual opsins examined so far except zfgr2. There is only (zfred), SWS1 (zfuv), and SWS2 (zfblue) opsins and two
cDNA species encoding RH2 (zfgr1 and zfgr2) opsins. one synonymous difference between zfblue and SWS2 (G342A). The number of differences between zfuv and Figure 3 shows a dendrogram representing the
percent-age of nucleotide differences among the coding regions SWS1is four, all of which are nonsynonymous (C263T, C290T, T310G, and C875G, resulting in Ser88Phe, Ser-of the five cDNA and the eight genomic opsin genes.
zfred is 100% identical toLWS-1.LWS-2is 7.0% different 97Phe, Ser104Ala, and Ser292Cys, respectively). Phe at residue 88 and Cys at residue 292 of SWS1(Figure 2) fromLWS-1(and zfred) and has a 1-amino-acid deletion
in the deduced N-terminal region (Figure 2). zfgr1 is are completely conserved among all vertebrate SWS1 opsins examined to date except zfuv, while Phe at resi-most similar toRH2-1(99.6% identity) and secondary to
RH2-2 (85.0%) while zfgr2 is most similar to RH2-4 due 97 and Ala at residue 104 of SWS1(Figure 2) are conserved among all fish SWS1 opsins but zfuv. These (99.4%) and secondary to RH2-3 (92.6%; Figure 3). When
dividing RH2 genes into two groups, zfgr1/RH2-1/ amino acids observed inRH2-1,RH2-4, andSWS1were also observed in the corresponding cDNA clones iso-RH2-2andRH2-3/RH2-4/zfgr2, the nucleotide
identi-ties between them range from 76.4 to 78.8%. zfblue and lated from zebrafish eyes in this study (see below). These results led us to infer that these amino acid differences zfuv are 99.9 and 99.6% identical toSWS2 andSWS1,
respectively. These percentages of identities among the may be due to cloning artifacts in zfgr1, zfgr2, and zfuv. Genomic Southern analysis of zebrafish opsin genes: sequences strongly suggest that zfred, zfgr1, zfgr2, zfblue,
and zfuv cDNAs of Vihtelic et al. (1999) represent To examine whether yet other related opsin genes are in the zebrafish genome, we performed Southern blot LWS-1,RH2-1, RH2-4, SWS1, and SWS2genes,
respec-tively, in the genome and indicate thatLWS-2, RH2-2, analysis for the genomic DNA.LWS-1andLWS-2are 93% identical in the coding region and both of the genes andRH2-3were newly identified in this study.
frag-Figure2.—Alignment of the deduced amino acid se-quences of the zebrafish cone opsins. Gaps necessary to optimize the alignment are indicated by dashes. The seven transmembrane do-mains (Hargrave et al. 1983) are indicated by hori-zontal lines above the se-quences. A Lys (K) residue for the Schiff-base linkage to the chromophore in the seventh transmembrane do-main, a Glu (E) residue for the Schiff-base counter ion in the third transmembrane domain, and two Cys (C) resi-dues for the disulfide bond in the first and second extra-cellular loops are high-lighted with boldface letters. The spectral-tuning residues Ala (A) 177 of LWS-1 and A 176 and Phe (F) 273 of LWS-2are indicated in red and E 122 of RH2-4 is in green. The amino acid dif-ferences of RH2-1 from zfgr1 [Met (M) 288], of RH2-4 from zfgr2 [Ser (S) 176], and ofSWS1from zfuv (F 88, F 97, A 104, and C 292) are highlighted with underlines.
ment is used as a probe. As expected, the probe detected ⵑ30% mismatch (data not shown). These results using the Tuebingen strain were consistent with those using two bands, sizes of which correspond to the cloned
LWS-1andLWS-2(Figures 1 and 4). Likewise, theRH2-4 other strains (AB, WIK, and TL; data not shown) and strongly suggest that zebrafish has no cone opsin genes (zfgr2) probe detected bothRH2-3andRH2-4(92.8%
identical in the coding region; Figures 1 and 4). Because other than the cloned ones in the genome.
Phylogenetic positions of LWS-1and LWS-2: Figure of the lower similarity betweenRH2-1andRH2-2(85.3%),
it was necessary to examine the two genes separately. 5A shows a phylogenetic tree of the fish LWS/MWS genes where the phylogenetic root was given by the TheRH2-1andRH2-2probes, as well as theSWS1and
SWS2probes, detected only one band, respectively, the pigeon LWS/MWS gene. For construction of the phylo-genetic tree we used nucleotide sequences of the entire size of which matches the corresponding gene cloned
(Figures 1 and 4). When the genomic DNA was exam- coding regions because synonymous nucleotide differ-ences among the fish genes are below saturation level, ined with other restriction enzymes, we observed only
hybridization bands corresponding to the cloned genes ranging from 5.5 to 63.4% (47.5% on average), and were considered to retain phylogenetic information. (data not shown). The same hybridization pattern was
Figure4.—Southern hybridization of the zebrafish geno-Figure3.—The sequence relatedness among the zebrafish
mic DNA to theLWS-1,RH2-1,RH2-2,RH2-4,SWS1, andSWS2 cone opsin genes isolated by Vihtelic et al. (1999), zfred,
probes. The exon-1 DNA fragments are used as the probes zfgr1, zfgr2, zfblue, and zfuv; and in this study,LWS-1,
LWS-(however, exons 1 and 2 are used forLWS-1). TheLWS-1and 2,RH2-1,RH2-2, RH2-3,RH2-4, SWS1, andSWS2. Scale bar
LWS-2andRH2-3 andRH2-4tracks represent the hybridiza-indicates 5% nucleotide difference.
tions to theLWS-1andRH2-4probes, respectively. The geno-mic DNA in theLWS-1andLWS-2track is digested withSacI while the DNA in the other tracks are withBglII.HindIII size
suggesting that theLWS-1/LWS-2gene duplication oc- standards are indicated in kilobases.
curred in zebrafish lineage after its separation from the common ancestor of goldfish and carp (Figure 5A). A
virtually identical tree was obtained when Jukes and ranged from 22.2 to 26.0%. In the zebrafish genome Cantor’s, Kimura’s two-parameter, Tajima and Nei’s, we could detect onlyLWS-1andLWS-2for LWS/MWS and Tamura’s methods (Nei and Kumar 2000) were group of genes even in the low-stringency hybridization used for estimating evolutionary distances (d values) conditions that allowⵑ30% mismatch. Thus we suppose and when amphibian, reptile, or other bird species was that the orthologous gene to the cavefish G101/G103 used as an outgroup reference (data not shown). When was lost from the zebrafish genome.
the protein sequences were used, topology of the tree Phylogenetic positions of the four RH2 genes of ze-was the same except that medaka ze-was most closely re- brafish: Figure 5B shows a phylogenetic tree of the fish lated to cichlid but with low bootstrap probability RH2 genes where the phylogenetic root was given by the
(ⵑ50%; data not shown). pigeon RH2 gene. Synonymous nucleotide differences
By the phylogenetic analysis of Mexican cavefish and among the fish genes are below saturation level, ranging goldfish opsin genes, Registeret al. (1994) noted that from 8.3 to 65.1% (52.4% on average), and the nucleo-the gene duplication of Mexican cavefish LWS/MWS tide sequence of the entire coding region was used for genes, which led to R007 and an ancestral gene of G101 reconstructing the phylogenetic tree. In the tree zebra-and G103, predated the speciation leading to Mexican fish RH2-3andRH2-4and goldfish GFgr-1 and GFgr-2 cavefish and goldfish. They suggested that goldfish has form separate clusters with high bootstrap supports (100 an additional gene orthologous to the cavefish G101 and 99%, respectively), strongly suggesting that these and G103 genes. The ancient duplication leading to the gene duplications occurred independently in zebrafish cavefish R007 and G101/G103 was also supported with and goldfish lineages. A cluster consisting of RH2-3/ 99% bootstrap probability in our phylogenetic tree (Fig- RH2-4 and GFgr-1/GFgr-2 is also highly reliable with ure 5A), where the duplication occurs even before the 100% bootstrap probability. Zebrafish RH2-1andRH2-2 separation of the superorders Ostariophysi (including form a cluster with 100% bootstrap support. The tree zebrafish, goldfish, and carp) and Acanthopterygii (in- strongly suggests that gene duplication leading to an cluding medaka, halibut, tilapia, and cichlid; Nelson ancestral gene of zebrafish RH2-1 and RH2-2 and of RH2-3 andRH2-4occurred before the speciation lead-1994). This suggests the presence of orthologous genes
to G101/G103 in all fishes belonging to the subdivision ing to goldfish and zebrafish and after the divergence between Cypriniformes (including goldfish and zebra-Euteleostei unless the genes have been lost. Overall
in RH2-2 and RH2-3. The discrepancies between the genomic and the cDNA clones ofRH2-2were at residue position 198 [Phe in the genomic clone and Tyr in the cDNA clone (denoted Phe/Tyr)] and at residue 332 (Glu/Asp). Those ofRH2-3 were at residue 166 (Ser/ Ala) and at residue 173 (Val/Phe). These cDNA se-quences were confirmed in independent RT-PCR exper-iments. It was noted that these sites were varied among the known RH2 opsins of vertebrates and there was no apparent association between the residues and the peak absorption spectra (max). Thus, the differences be-tween the cDNA and genomic sequences were interpre-ted as naturally occurring neutral polymorphisms rather than as the cloning artifacts.
Absorption spectra of the reconstituted visual pig-ments are shown in Figure 6. The pigpig-ments show spectra with a prominent absorption peak in addition to a pro-tein absorbance at 280 nm. The max values were di-rectly measured from the dark spectra (Table 1). When the reconstituted pigments were bleached by light, new absorption peaks of 380 nm were achieved, showing that 11-cis retinal in the pigments was isomerized by light and all-transretinal was released. Insets of Figure 6 show the dark-light difference spectra where the post-bleaching absorption maxima appear as a negative peak at around 380 nm. These demonstrate that the reconsti-tuted pigments are in fact photosensitive. The max values measured from the difference spectra are 558.7⫾ 1.3 nm (LWS-1), 551.2⫾1.5 nm (LWS-2), 472.7⫾1.6
Figure5.—Phylogenetic trees of the fish LWS/MWS (A) nm (RH2-1), 479.7⫾1.9 nm (RH2-2), 488.6⫾0.5 nm and RH2 (B) genes based on their nucleotide sequences. (RH2-3), 508.1 ⫾ 3.2 nm (RH2-4), 344.9 ⫾ 2.1 nm The zebrafish genes are highlighted with boldface letters. The
(SWS1), 428.2⫾ 0.4 nm (SWS2), and 502.1⫾ 0.6 nm
bootstrap probabilities are given to each node. Scale bar, five
(RH1). These values are close to those from dark
spec-nucleotide substitutions per 100 sites.
tra, except forSWS1,SWS2, andRH2-1, where the peak positions are affected by a post-bleaching absorption curve in the subtraction because pre- and post-bleaching orthologous to zebrafish RH2-1 and RH2-2. As in the
case of LWS/MWS genes, we obtained the same tree peaks are not sufficiently distant from each other. WhenSWS1pigment was denatured by sulfuric acid to topology when using other estimation methods of
evolu-tionary distances. When using reptile genes as outgroups, eliminate the opsin-induced spectral shift, the resulting dark spectrum had a peak absorbance at 440 nm (data the position of Mexican cavefish changed to outside of
all the other fish genes (data not shown). However, the not shown), which is identical to that of a protonated Schiff-base 11-cis retinal free in solution (Kito et al. bootstrap support for the branch node was low (40–
64%). When we used the protein sequences, the rela- 1968). When the acid was added to the pigment after the light exposure, the peak position did not shift from tionship among zebrafish, goldfish, and cavefish genes
varied depending on outgroup genes chosen. In any 380 nm, indicating that all-transretinal had been dissoci-ated from opsin before the acid was added. The 355-of the protein tree topologies, bootstrap values 355-of the
clusterings were generally low (14–77%) for the genes nm peak appeared only in theSWS1transfection experi-ment. These observations indicate that the 355-nm peak except for theRH2-1/RH2-2clustering (100%).
Spectral properties of the reconstituted photopig- in the SWS1dark spectrum (Figure 6) is achieved by the reconstituted pigment itself but not by the residual ments: The ocular RNA was extracted from a zebrafish
that is different from that used for constructing the free 11-cisretinal in the solution or by the residual 11-cis retinal, which formed random Schiff-base adducts genomic library. The cDNA clones of LWS-1, LWS-2,
RH2-1, RH2-2, RH2-3, RH2-4, SWS1, SWS2, and RH1 with other proteins.
Relative expression levels among zebrafish opsin were isolated by RT-PCR from the RNA using the
gene-specific external primers (Table 2). The deduced amino genes: To estimate relative expression levels among the nine visual opsin genes in the eye by the real-time RT-acid sequences of the cDNAs were identical to those of
Figure6.—Absorption spectra of the reconstituted visual pigments of zebrafish measured in the dark. Insets show the dark-light difference spectra.
among them. It was noted that the efficiencies differed the relative expression levels among the opsin genes are common between the two groups.
markedly among the genes (Figure 7). We examined three adult fish (1 year old) killed 1.5 hr after onset of the light (denoted group A) and three young adults (2
DISCUSSION
months old) killed 7 hr after the light onset (group B),
all of which had been raised under the 14-hr light/ Gene duplications of zebrafish opsins: It has been 10-hr dark cycle. Since the expressional patterns were suggested that a genome-wide duplication occurred at similar among the three fish within each group, the the base of the teleost radiation (Amores et al. 1998; expression levels of one individual from each group Meyerand Malaga-Trillo1999; Postlethwaitet al. (A and B) are shown in Figure 8, A and B, respectively. 2000). On top of it, further genome duplications are The expression levels of the rod opsin gene,RH1, were considered to have occurred in salmonids, goldfish, and out of the scale and were not included in the figure. In carp (Larhammar and Risinger 1994). We showed both groups, expression levels ofRH2-2andSWS2were here that zebrafish has two LWS/MWS, four RH2, and significantly higher than those of the others, among single SWS1 and SWS2 opsin genes in the genome (Fig-which SWS1 expression level was significantly higher ure 4). The duplications of the LWS/MWS and RH2 than those of the rest. Notably, expression levels of the genes do not appear to be the result of the genome two LWS/MWS genes were considerably lower; that of duplication since the two LWS/MWS genes,LWS-1and LWS-2was even lower than that ofLWS-1. Among the LWS-2, are arrayed in tandem and the four RH2 genes, four RH2 genes, expression levels ofRH2-1, RH2-3, and RH2-1,RH2-2,RH2-3, andRH2-4, form another tandem RH2-4were much lower than that ofRH2-2. The differ- gene cluster (Figure 1). These results suggest that all ence between groups A and B appeared to be the lower counterparts of the opsin gene pairs by the whole-relative expression levels ofRH2-2,SWS2, andRH1 in genome duplication have been lost or become pseu-group B than in pseu-group A. It is not clear from the present dogenes by mutations, as in the case of many other data set whether the difference is due to the age of the genes in the zebrafish genome (ⵑ80% of the gene pairs fish or the circadian time when the measurement was are considered to have lost their counterparts; P
Figure7.—The relative efficiencies of reverse transcription among the zebrafish opsin genes. The efficiencies are given as that ofLWS-1as 1. LWS-1, 1.00⫾0.05;LWS-2, 4.08⫻10⫺2⫾1.05⫻ 10⫺2;RH2-1, 2.17⫾0.34;RH2-2, 3.92⫻10⫺1⫾ 1.23⫻10⫺1; RH2-3, 1.45⫾0.28;RH2-4, 1.09⫾ 0.12;SWS1, 7.39⫻ 10⫺1⫾ 2.20 ⫻ 10⫺1; SWS2, 6.26⫻10⫺1⫾1.25⫻10⫺1;RH1, 1.74⫻10⫺1⫾ 0.29⫻10⫺1.
Besides LWS/MWS genes of higher primates, gene the first complete set of information on the genomic organization of the visual opsin genes in fish.
duplications in the five groups of visual opsins have
been documented only for fishes: LWS/MWS of Mexi- The close linkage between SWS2 and LWS/MWS genes
has been documented for Mexican cavefish (Yokoyama can cavefish (R007, G101, and G103; Yokoyama and
Yokoyama 1990), RH2 of goldfish (GFgr-1 and GFgr- and Yokoyama1993), cichlid (Carletonand Kocher 2001), and pigeon (Kawamuraet al.1999). While the 2; Johnsonet al.1993) and zebrafish (zfgr1 and zfgr2;
Vihtelic et al. 1999), SWS2 of cichlid (SWS-2A and distances between SWS2 and LWS/MWS genes are longer in the three species (ⵑ6 kb) than in zebrafish
SWS-2B; Carleton and Kocher 2001), and RH1 of
eels (freshwater and deep-sea types; Archeret al.1995; (2.5 kb), conservation of the linkage is suggestive of the associated expressional regulation between the genes Zhanget al.2000). However, a thorough genomic
sur-vey of fish opsin genes has not been accomplished and by an analogy from the human LWS/MWS expression system where the red and green opsin genes are regu-positional relationships among these duplicated genes
have been largely unknown. Our study on the zebrafish lated by a common enhancer motif, the locus control region (Smallwoodet al.2002). With the information cone opsin genes together with our previous study on
the rod opsin gene (RH1; Hamaokaet al.2002) provides on the positional relationship amongSWS2,LWS-1, and
LWS-2and amongRH2-1,RH2-2,RH2-3, andRH2-4 in provides further support for the predominant usage of the retinal-based visual pigments in zebrafish.
zebrafish, the expressional regulation of these genes
can be systematically explored by transgenesis using a It should be noted that Nawrockiet al. (1985) ob-served a remarkable difference inmax values between proper reporter gene, such as green fluorescent protein
(GFP), as has been demonstrated for the RH1 gene of developmental stages only for the LD cones,i.e.,ⵑ540 nm in early larvae [6–8 days postfertilization (dpf)] and zebrafish (Kennedyet al.2001; Hamaokaet al.2002).
Comparison of MSP and in vitro measurements of ⵑ560 nm in late larvae (11–17 dpf) and adults (1–2 years old) [the cell type is denoted “SD” in the literature absorption spectra: MSP analyses of zebrafish retinal
photoreceptor cells have shown that the long (LD) and probably due to the misclassification of the isolated cone cells; see Raymond et al. (1993) and Robinson et al. short (SD) members of the double-cone cell are red
(max of ⵑ560 nm) and green sensitive (ⵑ480 nm), (1993)]. Although 540 nm is somewhat shorter than themax ofLWS-2pigment (548 nm), this could imply respectively, while the long-single- (LS) and
short-single-(SS) cone cells are blue (ⵑ410 nm) and ultraviolet that LWS-1 and LWS-2 may be expressed at different developmental stages, with the latter in the early stages sensitive (ⵑ360 nm), respectively (Nawrockiet al.1985;
Robinson et al. 1993; Cameron 2002; Table 1). The and the former in the later stages. Temporal control of the visual pigment production is a rather common max of the rod cell is measured to beⵑ500 nm (N
aw-rocki et al. 1985; Cameron 2002). Raymond et al. feature in fish (Bowmaker 1995) and the differential usage of the duplicated opsin genes at different life (1993) applied the goldfish opsin cRNA probes forin
situhybridization to the zebrafish retina. Vihtelicet al. stages has been demonstrated for the RH1 (rod) opsin genes of European eel (Anguilla anguilla) and Japanese (1999) used the antibodies against zebrafish opsins for
immunohistochemical analysis. Consistent with the MSP eel (A. japonica; Archeret al.1995; Zhanget al.2000). Blue shift of retinal sensitivity of zebrafish: The elec-results, both studies detected expression of LWS/MWS
(red) opsin in one and RH2 (green) opsin in the other troretinogram measured for adult zebrafish has showed lower sensitivity of the retina to the long-wavelength members of the double cones (most likely LD and SD
cones, respectively, based on the MSP data) and that of light (Hughes et al. 1998; Cameron 2002). The low level of LWS/MWS RNA (Figure 8) appears to be consis-SWS2 (blue), SWS1 (ultraviolet), and RH1 (rod) opsins
in the LS cone, SS cone, and rod cells, respectively, in tent with this tendency. It has been documented in other organisms that the expression level of opsins oscil-the zebrafish retina.
Because of the high level of the nucleotide sequence lates with a circadian rhythm (Pierceet al. 1993; Von Schantzet al. 1999). Although the expression level of identities betweenLWS-1andLWS-2and amongRH2-1,
RH2-2, RH2-3, and RH2-4, the cRNA probes and the each opsin gene may well oscillate with the circadian time in zebrafish as in some other retina-specific genes antibodies should be capable of detecting
correspond-ing groups of the opsin transcripts and proteins, re- (Rajendranet al. 1996), the relative scantiness of the LWS/MWS RNA to those of the other pigment groups spectively, irrespective of their subtypical differences
(Vihtelicet al.1999). Since these hybridization and im- appears to be irrespective of the circadian time (Fig-ure 8).
munostaining signals are confined to these specific cell
types in entire retina, all opsin transcripts detected in In zebrafish, as in other teleost fish, cone cells are arranged in a regular geometric array called a mosaic the ocular RNA in this study most likely originated only
from them. Themax values ofSWS1(355 nm),SWS2 (Robinsonet al.1993). On the basis of the retinal mo-saic configuration, the ratio of the cell numbers among
(416 nm), andRH1 (501 nm) pigments measuredin
vitroare reasonably close to those of the SS cone, LS LD, SD, LS, and SS cones can be estimated to be 2:2:1:1. If all cone cells express equal amounts of opsin RNA, cone, and rod cells (Table 1), respectively. The fact that
the max value of SD cones (ⵑ480 nm) is closest to the ratio of mRNA amount in the retina among LWS/ MWS, RH2, SWS2, and SWS1 genes would be likewise that ofRH2-2pigment (476 nm) is consistent with our
quantitative RT-PCR result that the majority of the RH2 2:2:1:1. Our quantitative RT-PCR result deviated consid-erably from the expectation, especially in the LWS/ transcript in the ocular RNA is fromRH2-2(Figure 8).
Likewise, themax of LD cones (ⵑ560 nm) is close to MWS group, which is represented at very low level. This suggests that expression of the LWS/MWS opsin genes that ofLWS-1pigment (558 nm), which dominates over
LWS-2in the expression level (Figure 8). is downregulated in zebrafish.
It should be noted that the max of SWS2pigment The chromophore of the visual pigments of zebrafish
is predominantly 11-cisretinal and not the 11-cis3,4-dehy- (416 nm) is relatively short compared to those of many other SWS2 pigments characterized to date (ⵑ440 nm) droretinal that shifts themax of the pigments to longer
wavelength (Nawrockiet al.1985). When zebrafish is and that themax ofRH2-2pigment (476 nm), a repre-sentative RH2 in the zebrafish retina, is also short com-housed in cold temperature (22–25⬚), mixed usage of
the two types of chromophore is observed in rod cells pared to many other RH2 pigments (ⵑ500 nm, except for some nocturnal or deep-sea organisms; see Y oko-but not in cone cells (Saszikand Bilotta1999). The
MWS genes appears to be consistent with this blue shift have seen the large spectral variation among subtypes of the LWS/MWS and RH2 pigments of zebrafish. De-of retinal sensitivity.
The amino acid residues responsible for the spectral spite the remarkable differences, significance of the sub-typical variation is not clear because only one type from tuning of LWS/MWS and SWS1 pigments have been
well investigated with the site-directed mutagenesis and each group,LWS-1andRH2-2, is dominated in expres-sion level in these groups. In the pineal organ, the pigment-reconstitution methodologies (see Yokoyama
2000 for a review), but relatively few studies have been expression of both LWS/MWS and RH2 opsin genes has been documented for zebrafish (Manoet al.1999; done on the RH2 and SWS2 pigments (Yokoyamaet al.
1999; Cowinget al.2002). We could assign no relevant Forsell et al. 2001). To understand biological signifi-cance of the gene duplications and spectral diversity of amino acid changes from the literature to those in the
zebrafish RH2 and SWS2 pigments to explain their spec- these genes, it is of great importance to investigate (1) whether the subtypes are coexpressed in the same cone tral shifts, except for the change that could account for
the “red shift” of RH2-4 among the blue-shifted RH2 cells or not; (2) if not, whether they are distributed with some spatial pattern or in a random fashion in the pigments (Gln to Glu at residue 122, Figure 2; Y
oko-yamaet al.1999). To investigate the molecular mecha- retina; (3) whether the subtypes are expressed in tempo-rally different ways as supposed for LWS-1andLWS-2; nisms accounting for the large spectral diversity among
the four zebrafish RH2 pigments and the blue shift of and (4) which subtypes are expressed in the pineal organ and possibly in other tissues.In situhybridization zebrafish SWS2, it is of great importance to conduct
site-directed mutagenesis for the reconstituted pho- using the 3⬘untranslated regions of these opsin genes should reveal the spatio-temporal expression patterns topigments.
Interestingly, themax of LWS-1pigment may also of the LWS/MWS and RH2 subtypes of zebrafish. be blue shifted according to the “five-sites rule” where We greatly appreciate Dr. Yoshitaka Fukada (University of Tokyo) themax values of the LWS/MWS pigments are largely for 11-cisretinal and Dr. Hans Georg Frohnhoefer (Max-Planck-Insti-tute for Developmental Biology) for the zebrafish Tuebingen strain. determined by the five amino acid residues at positions
The zebrafish AB strain was provided by the Zebrafish International 180, 197, 277, 285, and 308 (the residue numbers
repre-Resource Center at the University of Oregon (NIH-NCRR P40 sented by those in the human red opsin; Yokoyama RR12546). This study was supported by grants-in-aid for scientific and Radlwimmer 1998, 1999, 2001). In typical “red” research (B) (12440243) and exploratory research (13874105) to S.K. opsins, these sites are occupied by amino acids Ser, His, and for JSPS Fellows (14-08073) to A.C. from the Japan Society of
the Promotion of Science. Tyr, Thr, and Ala, respectively. The amino acid changes
from Ser to Ala at 180 (denoted Ser180Ala), His197Tyr, Tyr277Phe, Thr285Ala, and Ala308Ser shift the max
LITERATURE CITED
values toward blue by 7, 28, 8, 15, and 27 nm, respectively
(Yokoyama and Radlwimmer 2001). The zebrafish Amores, A., A. Force, Y. L. Yan, L. Joly, C. Amemiya et al., 1998 Zebrafish hox clusters and vertebrate genome evolution. Science LWS-1andLWS-2pigments have the “green”-type amino
282:1711–1714.
acid, Ala, at residues 177 and 176, respectively (the sites Archer, S., A. HopeandJ. C. Partridge, 1995 The molecular basis for the green-blue sensitivity shift in the rod visual pigments of corresponding to residue 180 of the human red opsin;
the European eel. Proc. R. Soc. Lond. Ser. B Biol. Sci. 262:
Figure 2). Furthermore, theLWS-2pigment has an
addi-289–295.
tional green-type amino acid, Phe, at residue 273 (the Bowmaker, J. K., 1995 The visual pigment of fish. Prog. Retinal Eye Res.15:1–31.
site corresponding to residue 277 of the human red
Branchek, T., andR. Bremiller, 1984 The development of photo-opsin; Figure 2). About 10 nm difference of max
be-receptors in the zebrafish, Brachydanio rerio. I. Structure. J.
tween the two pigments likely results from it. Comp. Neurol.224:107–115.
Cameron, D. A., 2002 Mapping absorbance spectra, cone fractions, The short-wave-shifted character ofmax in zebrafish
and neuronal mechanisms to photopic spectral sensitivity in the photoreceptors has been pointed out by Nawrockiet
zebrafish. Vis. Neurosci.19:365–372.
al. (1985) and is typical of the fish in “freshwater group Carleton, K. L., and T. D. Kocher, 2001 Cone opsin genes of African cichlid fishes: tuning spectral sensitivity by differential I” (Levineand Macnichol1979), which inhabit
fresh-gene expression. Mol. Biol. Evol.18:1540–1550. water either in the shallow margins of lakes and rivers
Cowing, J. A., S. Poopalasundaram, S. E. Wilkie, J. K. Bowmaker or near the surface of deeper waters. Zebrafish is indige- andD. M. Hunt, 2002 Spectral tuning and evolution of short wave-sensitive cone pigments in cottoid fish from Lake Baikal. nous to freshwater in the Indian subcontinent,
espe-Biochemistry41:6019–6025. cially in the Ganges River system. The blue shift
presum-Detrich III,H. W., M. WesterfieldandL. I. Zon, 1999 The Zebra-ably enhances the luminance contrast at relatively short fish: Genetics and Genomics. Academic Press, San Diego.
Forsell, J., P. Ekstrom, I. N. FlamariqueandB. Holmqvist, 2001 wavelengths that dominate its ambient background,
Expression of pineal ultraviolet- and green-like opsins in the which could be of specific benefit in the detection of
pineal organ and retina of teleosts. J. Exp. Biol.204:2517–2525. dark profiles, such as foods or predators, against the Hamaoka, T., M. Takechi, A. Chinen, Y. NishiwakiandS. Kawa-mura, 2002 Visualization of rod photoreceptor development relatively bright background of the down-welling light
usingGFP-transgenic zebrafish. Genesis34:215–220. (Cameron2002).
Hargrave, P. A., J. H. Mcdowell, D. R. Curtis, J. K. Wang, E.
Spectral and expressional variation among subtypes Juszczaket al., 1983 The structure of bovine rhodopsin. Bio-phys. Struct. Mech.9:235–244.
Helvik, J. V., O. Drivenes, T. H. Naess, A. FjoseandH. C. Seo, Rajendran, R. R., E. E. Van Niel, D. L. Stenkamp, L. L. Cunningham, P. A. Raymondet al., 1996 Zebrafish interphotoreceptor reti-2001 Molecular cloning and characterization of five opsin genes
from the marine flatfish Atlantic halibut (Hippoglossus hippo- noid-binding protein: differential circadian expression among cone subtypes. J. Exp. Biol.199(12): 2775–2787.
glossus). Vis. Neurosci.18:767–780.
Hisatomi, O., T. SatohandF. Tokunaga, 1997 The primary struc- Raymond, P. A., L. K. Barthel, M. E. Rounsifer, S. A. Sullivan
andJ. K. Knight, 1993 Expression of rod and cone visual pig-ture and distribution of killifish visual pigments. Vision Res.37:
ments in goldfish and zebrafish: a rhodopsin-like gene is ex-3089–3096.
pressed in cones. Neuron10:1161–1174.
Hughes, A., S. Saszik, J. Bilotta, P. J. Demarco, Jr. and W. F.
Register, E. A., R. Yokoyama and S. Yokoyama, 1994 Multiple
Patterson, II, 1998 Cone contributions to the photopic
spec-origins of the green-sensitive opsin genes in fish. J. Mol. Evol. tral sensitivity of the zebrafish ERG. Vis. Neurosci.15:1029–1037.
39:268–273.
Ina, Y., 1995 New methods for estimating the numbers of
synony-Robinson, J., E. A. Schmitt, F. I. Harosi, R. J. ReeceandJ. E.
mous and nonsynonymous substitutions. J. Mol. Evol.40:190–
Dowling, 1993 Zebrafish ultraviolet visual pigment: absorption 226.
spectrum, sequence, and localization. Proc. Natl. Acad. Sci. USA
Johnson, R. L., K. B. Grant, T. C. Zankel, M. F. Boehm, S. L. Merbs
90:6009–6012.
et al., 1993 Cloning and expression of goldfish opsin sequences.
Saitou, N., andM. Nei, 1987 The neighbor-joining method: a new Biochemistry32:208–214.
method for reconstructing phylogenetic trees. Mol. Biol. Evol.
Karnik, S. S., T. P. Sakmar, H. B. ChenandH. G. Khorana, 1988
4:406–425. Cysteine residues 110 and 187 are essential for the formation of
Sakmar, T. P., R. R. FrankeandH. G. Khorana, 1989 Glutamic correct structure in bovine rhodopsin. Proc. Natl. Acad. Sci. USA
acid-113 serves as the retinylidene Schiff base counterion in
bo-85:8459–8463.
vine rhodopsin. Proc. Natl. Acad. Sci. USA86:8309–8313.
Kawamura, S., andS. Yokoyama, 1998 Functional characterization
Sambrook, J., andD. W. Russel, 2001 Molecular Cloning: A Laboratory
of visual and nonvisual pigments of American chameleon (Anolis
Manual. Cold Spring Harbor Laboratory Press, Cold Spring
Har-carolinensis). Vision Res.38:37–44.
bor, NY.
Kawamura, S., N. S. BlowandS. Yokoyama, 1999 Genetic analyses
Saszik, S., andJ. Bilotta, 1999 The effects of temperature on the of visual pigments of the pigeon (Columba livia). Genetics153:
dark-adapted spectral sensitivity function of the adult zebrafish. 1839–1850.
Vision Res.39:1051–1058.
Kennedy, B. N., T. S. Vihtelic, L. Checkley, K. T. Vaughanand
Smallwood, P. M., Y. WangandJ. Nathans, 2002 Role of a locus
D. R. Hyde, 2001 Isolation of a zebrafish rod opsin promoter to
control region in the mutually exclusive expression of human generate a transgenic zebrafish line expressing enhanced green
red and green cone pigment genes. Proc. Natl. Acad. Sci. USA fluorescent protein in rod photoreceptors. J. Biol. Chem.276:
99:1008–1011. 14037–14043.
Tamura, K., andM. Nei, 1993 Estimation of the number of
nucleo-Khorana, H. G., B. E. Knox, E. Nasi, R. SwansonandD. A.
Thomp-tide substitutions in the control region of mitochondrial DNA
son, 1988 Expression of a bovine rhodopsin gene inXenopus
in humans and chimpanzees. Mol. Biol. Evol.10:512–526. oocytes: demonstration of light-dependent ionic currents. Proc.
Thompson, J. D., D. G. HigginsandT. J. Gibson, 1994 CLUSTAL Natl. Acad. Sci. USA85:7917–7921.
W: improving the sensitivity of progressive multiple sequence
Kito, Y., T. Suzuki, M. AzumaandY. Sekoguti, 1968 Absorption
alignment through sequence weighting, position-specific gap spectrum of rhodopsin denatured with acid. Nature218:955–957.
penalties and weight matrix choice. Nucleic Acids Res.22:4673–
Kozak, M., 1984 Compilation and analysis of sequences upstream
4680. from the translational start site in eukaryotic mRNAs. Nucleic
Vihtelic, T. S., C. J. DoroandD. R. Hyde, 1999 Cloning and Acids Res.12:857–872.
characterization of six zebrafish photoreceptor opsin cDNAs and
Kumar, S., K. Tamura, I. B. JacobsenandM. Nei, 2001 MEGA2,
immunolocalization of their corresponding proteins. Vis.
Neu-Molecular Evolutionary Genetics Analysis. Arizona State University,
rosci.16:571–585. Tempe, AZ.
Von Schantz, M., R. J. LucasandR. G. Foster, 1999 Circadian
Larhammar, D., andC. Risinger, 1994 Molecular genetic aspects of
oscillation of photopigment transcript levels in the mouse retina. tetraploidy in the common carpCyprinus carpio.Mol. Phylogenet.
Mol. Brain Res.72:108–114. Evol.3:59–68.
Wang, J. K., J. H. McdowellandP. A. Hargrave, 1980 Site of
Levine, J. S., andE. F. Macnichol, Jr., 1979 Visual pigments in
attachment of 11-cis-retinal in bovine rhodopsin. Biochemistry teleost fishes: effects of habitat, microhabitat, and behavior on
19:5111–5117. visual system evolution. Sens. Processes3:95–131.
Yokoyama, R., andS. Yokoyama, 1990 Convergent evolution of the
Malicki, J., 2000 Harnessing the power of forward genetics—
red- and green-like visual pigment genes in fish,Astyanax fasciatus, analysis of neuronal diversity and patterning in the zebrafish
and human. Proc. Natl. Acad. Sci. USA87:9315–9318. retina. Trends Neurosci.23:531–541. Yokoyama, R., andS. Yokoyama, 1993 Molecular characterization
Mano, H., D. KojimaandY. Fukada, 1999 Exo-rhodopsin: a novel
of a blue visual pigment gene in the fishAstyanax fasciatus.FEBS rhodopsin expressed in the zebrafish pineal gland. Brain Res. Lett.334:27–31.
Mol. Brain Res.73:110–118. Yokoyama, S., 2000 Molecular evolution of vertebrate visual
pig-Meyer, A., andE. Malaga-Trillo, 1999 Vertebrate genomics: more ments. Prog. Retin. Eye Res.19:385–419.
fishy tales about Hox genes. Curr. Biol.9:R210–R213. Yokoyama, S., andF. B. Radlwimmer, 1998 The “five-sites” rule
Molday, R. S., andD. Mackenzie, 1983 Monoclonal antibodies to and the evolution of red and green color vision in mammals. rhodopsin: characterization, cross-reactivity, and application as Mol. Biol. Evol.15:560–567.
structural probes. Biochemistry22:653–660. Yokoyama, S., andF. B. Radlwimmer, 1999 The molecular genetics
Nawrocki, L., R. Bremiller, G. StreisingerandM. Kaplan, 1985 of red and green color vision in mammals. Genetics153:919–932. Larval and adult visual pigments of the zebrafish, Brachydanio Yokoyama, S., andF. B. Radlwimmer, 2001 The molecular genetics rerio.Vision Res.25:1569–1576. and evolution of red and green color vision in vertebrates.
Genet-Nei, M., andS. Kumar, 2000 Molecular Evolution and Phylogenetics. ics158:1697–1710.
Oxford University Press, New York. Yokoyama, S., H. Zhang, F. B. RadlwimmerandN. S. Blow, 1999
Nelson, J. S., 1994 Fishes of the World. John Wiley & Sons, New York. Adaptive evolution of color vision of the Comoran coelacanth
Ohguro, H., R. S. Johnson, L. H. Ericsson, K. A. WalshandK. (Latimeria chalumnae). Proc. Natl. Acad. Sci. USA96:6279–6284. Palczewski, 1994 Control of rhodopsin multiple phosphoryla- Zhang, H., K. Futami, N. Horie, A. Okamura, T. Utohet al., 2000 tion. Biochemistry33:1023–1028. Molecular cloning of fresh water and deep-sea rod opsin genes
Pierce, M. E., H. Sheshberadaran, Z. Zhang, L. E. Fox, M. L. from Japanese eel Anguilla japonicaand expressional analyses Appleburyet al., 1993 Circadian regulation of iodopsin gene during sexual maturation. FEBS Lett.469:39–43.
expression in embryonic photoreceptors in retinal cell culture. Zhukovsky, E. A., andD. D. Oprian, 1989 Effect of carboxylic Neuron10:579–584. acid side chains on the absorption maximum of visual pigments.
Postlethwait, J. H., I. G. Woods, P. Ngo-Hazelett, Y. L. Yan, Science246:928–930. P. D. Kellyet al., 2000 Zebrafish comparative genomics and the