Enhancing the Properties of Soil Using
GGBFS & Bottom Ash
Manish Kumar Das1, J.P.Singh2
M.Tech. Student, BIT Sindri, Dhanbad, India1
Associate Professor, BIT Sindri, Dhanbad, India 2
ABSTRACT: An experimental investigation has been carried out to study the effect of GGBFS and Bottom ash on the
geotechnical properties of the local soil. The replacement of the natural soil has been done by the GGBFS and Bottom ash at various percentages, i.e. 5%, 10%, 15% 20% and 25% (GGBFS) and 10% (Bottom ash) by weight of the soil. The results obtained from the laboratory tests on the samples have been studied. From the experimental results, it has been found that various properties of the soil varying percentage of these stabilizers percentage show remarkable changes as compared to the natural soil. From standard Proctor compaction test it has been found that the mass of natural soil increases whereas OMC decreases by increasing percentage replacement of natural soil by GGBFS. Also the LL, PL and PI value decreased by increasing percentage replacement of natural soil by GGBFS. The maximum value of UCS of the soil has been obtained as 4.96 kg/cm2 with the replacement of natural soil by 25% GGBFS and 10% Bottom ash(by weight) which is 66.44% more than that of the natural soil. The CBR value of natural soil increases in both Soaked and un-soaked condition, and the permeability of soil increases by increasing percentage replacement of natural soil by GGBFS.
KEYWORDS: Natural Soil, GGBFS, Bottom Ash, Proctor Compaction Test, Atterberg’s Limit, CBR, UCS,
Permeability
I. INTRODUCTION
II. NEED FOR SOIL STABILIZATION
1. Limited financial resources to provide a complete network road system to build in Conventional method.
2. Effective utilization of locally available soils and other suitable stabilizing agents.
3. Encouraging the use of industrial wastages or innovative materials in building low cost Construction of roads.
Coal-based thermal power plants are the major source of power generation in India and Bottom ashes are the by-products of these thermal power plant. The coal reserve of India is about 200 billion tones and its annual production reaches 250 million tones approximately. In India, unlike in most of the developed countries, ash content in the coal used for power generation is about 30 to 40. The ash generation has increased to about 131 million tone during 2010-11and shall continue to grow. The finer ash particles are carried away by the flue gas to the electrostatic precipitators and are referred as bottom ash, whereas the heavier ash particles fall to the bottom of the boiler and are called as bottom ash. Primarily, the GGBFS is disposed of using either dry or wet disposal scheme. In dry disposal, the GGBFS is transported by truck and conveyor at the site and disposed of by constructing a dry embankment (dyke). In wet disposal, the GGBFS and bottom ash are transported as slurry through pipe line. Most of the power plants in India use wet disposal system, and when the lagoons are full, four basic options are available:
(a) Constructing new lagoons using conventional constructional material, (b) Hauling of fly ash from the existing lagoons to another disposal site, (c) Raising the existing dyke using conventional constructional material, and (d) Raising the dyke using fly ash excavated from the lagoon ("ash dyke").
The objectives of the present work are to stabilize the natural soil by using industrial waste. Therefore the experiment program has been setup with following objective
To determine the geotechnical properties of soil & soil with GGBFS & Bottom ash.
To determine the effects of adding Bottom Ash & GGBFS on the properties of soil. To reduce the cost of soil stabilization by using the industrial waste as a soil stabilizer.
III. MATERIALS AND THEIR PROPERTIES
Material used in this project are given in following table 1. Table 1
Sl. No. Name of Materials Source of the Materials
1. Soil Procured from the new Hostel construction site in B.I.T Campus
2. GGBFS Procured from ACC Cement Plant, Sindri
3. Bottom Ash Procured from BTPS Bokaro
4. Water Soil mechanics Labortory, BIT Sindri
5. Distilled Water (H2O) Sai Enterprises, Sindri, Dhanbad
6. Sodium Hexametaphosphate (NaPO3) 6 Manufactured by LABALO CHEMIE LTD.
7. Sodium Carbonate (NaCO3) Manufactured by LABALO CHEMIE LTD.
SOIL: The soil sample for this study was collected from B.I.T. Sindri campus. It was collected from a depth of 2feet
or soil type; i.e. a soil containing more than 85 sand-sized particles (by mass). The properties of soil are given below in table 2.
Table 2
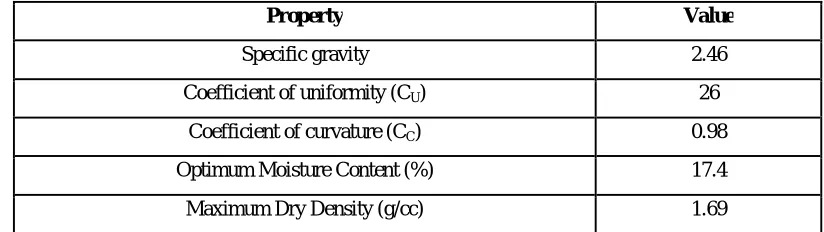
Property Value
Specific gravity 2.46
Coefficient of uniformity (CU) 26
Coefficient of curvature (CC) 0.98
Optimum Moisture Content (%) 17.4
Maximum Dry Density (g/cc) 1.69
GROUND GRANULATED BLAST FURNACE SLAG (GGBFS): It is obtained by quenching molten iron slag
which is a by-product of iron and steel making from a blast furnace in water or steam, to produce a glassy, granular product that is then dried and ground into a fine powder. It has a cementituous property which acts as binding material for the soil. In general the presence of sufficient quantity of CaO results in raised slag basicity and an increase in compressive strength. This waste material is easily available and also cost efficient.GGBFS is used to make durable concrete structures in combination with ordinary portland cement and/or other pozzolanic materials. GGBFS has been widely used in Europe, and increasingly in the United States and in Asia (particularly in Japan and Singapore) for its superiority in concrete durability, extending the lifespan of buildings from fifty years to a hundred years. The properties of GGBFS are given below in table 3.
Table 3
Colour Off white
Specific gravity 2.9
Bulk density 1200 kg/m3
BOTTOM ASH: Bottom ash is part of the non-combustible residue of combustion in a furnace or incinerator. In an
industrial context, it usually refers to coal combustion and comprises traces of combustibles embedded in forming clinkers and sticking to hot side walls of a coal-burning furnace during its operation. The portion of the ash that escapes up the chimney or stack is, however, referred to as fly ash. The clinkers fall by themselves into the bottom hopper of a coal-burning furnace and are cooled. The above portion of the ash is referred to as bottom ash too.
Bottom ash is collected at the end of the grate in a Waste-to-Energy plant. It consists of non-combustible materials, and is the residual part from the incineration of household and similar waste. Raw bottom ash is a granular material that consists of a mix of inert materials such as sand, stone, glass, porcelain, metals, and ash from burnt materials
Since the fused bottom ash is still hot, when it is removed from the boiler, it falls into a water bath or quench tank where it is cooled before passing through a clinker grinder, which reduces the size of any large chunks to smaller than approximately 2 inches. The crushed bottom ash is then removed for storage, disposal or use. The properties of bottom ash are given below in table 4.
Table 4
Colour Off black
Specific gravity 2.2
IV. EXPERIMENTAL INVESTIGATION
Description of Samples is given below in table 5.
Table 5
SL.No. Sample Type
Description of the additives added with the soil
Soil (%) GGBFS by (%) of weight
of soil
Bottom Ash by (%) of weight of soil
1. S 100 0 0
2. S1 85.00 5.0 10.0
3. S2 80.00 10.0 10.0
4. S3 75.00 15.0 10.0
5. S4 70.00 20.0 10.0
6. S5 65.00 25.0 10.0
Compaction characteristics: The soil with different percentage of Bottom Ash & GGBFS standard proctor’s test was
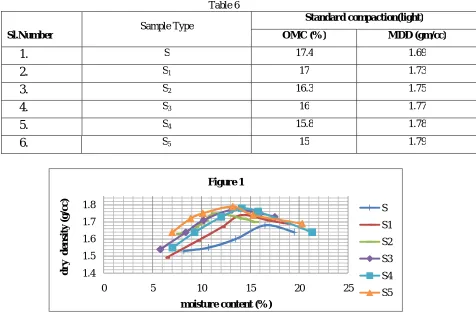
conducted for silty clayey soils. Test results of expansive soil are presented. It is observed that addition of Bottom Ash & GGBFS individually has a general trend of decreasing optimum moisture content (OMC) and increasing maximum dry density (MDD). Optimum MDD of 1.93g/cc was with addition of Bottom Ash & GGBFS for 15 OMC. OMC and MDD of Stabilized Soil with different percentage is given below in table 6.
Table 6
Sample Type Standard compaction(light)
Sl.Number OMC (%) MDD (gm/cc)
1.
S 17.4 1.692.
S1 17 1.733.
S2 16.3 1.754.
S3 16 1.775.
S4 15.8 1.786.
S5 15 1.791.4 1.5 1.6 1.7 1.8
0 5 10 15 20 25
d
r
y
d
e
n
si
ty
(g/
c
c
)
moisture content (%) Figure 1
S
S1
S2
S3
S4
MDD & OMC for soil samples having 10% bottom ash and different percentages of GGBFS (5%, 10%, 15%, 20%, 25% replacing soil sample by weight of soil). The result indicates that the MDD of soil sample increases with increase in the percentage replacement of soil sample with GGBFS. Whereas the OMC of soil samples decreases with increase in the percentage replacement of soil sample with GGBFS. The highest MDD value and lowest OMC value was obtained for soil sample having 25% GGBFS by weight of soil. The percentage increase in the MDD value for soil sample having 25% GGBFS by weight of soil was 5.92% more than soil sample containing no GGBFS. But the OMC value for soil sample with 25% GGBFS by weight of soil decreased by 13.79% with respect to soil sample having 0% GGBFS.
Atterberg's Limit: A fine-grained soil can exist in any of several states; which state depends on the amount of water in
the soil system. When water is added to a dry soil, each particle is covered with a film of adsorbed water. If the addition of water is continued, the thickness of the water film on a particle increases. Increasing the thickness of the water films permits the particles to slide past one another more easily. The behavior of the soil, therefore, is related to the amount of water in the system. The value of Atterberg's Limit is given below in table 7.
Table 7
When proportion of Soil: Bottom ash: GGBFS is added different percentage by weight of soil and the percentage is increased i.e.100:0:0, 85:10:5, 80:10-10, 75:10:15, 70:10:20 and 65:10:25, Liquid Limit is decreased as 38.80%, 37.60%, 35.90%, 34.30%, 32.10% and 29%, Plastic limit is decreased as 17.46%, 17.35%, 16.57%, 15.41%, 14.27% & 12.43% and Plasticity index also decreases as 21.54%, 20.25%, 19.33%, 18.89%, 17.83% and 16.57%.
Unconfined compressive strength (UCS): The Unconfined compressive strength test is used to measure the shearing
resistance of soil. Which may be undisturbed or remoulded specimens? An axial load is applied using either strain control or stress control condition. The Unconfined Compressive Strength is defined as the maximum unit stress obtained within the first 20 strain. The Compression device is a hydraulic-actuated loading piston, electronically controlled, with the capability of infinite rates of train and stress loads. A load cell of 44.5kN or 222.5kN capacity is fastened to the piston to measure load on specimen Test data are displayed on control panel board readouts. The value of unconfined compressive strength is given below in table 8.
Sl. No Sample type Liquid limit (%) Plastic limit (%) Plasticity index (%)
1 S 38.80 17.46 21.54
2 S1 37.60 17.35 20.25
3 S2 35.90 16.57 19.33
4 S3 34.30 15.41 18.89
5 S4 32.10 14.27 17.83
6 S5 29 12.43 16.57
0 10 20 30 40 50
S S1 S2 S3 S4 S5
Wte
r
C
o
n
te
n
t
(i
n
%
)
Sample Type Figure 2
L.L
Table 8
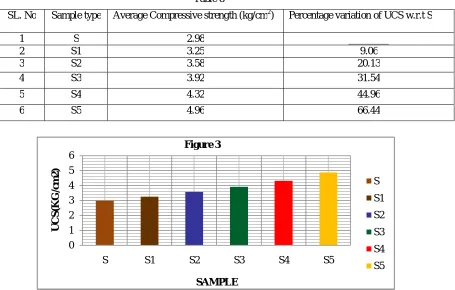
UCS for soil samples having different percentages of GGBFS (5%, 10%, 15%, 20%, 25% replacing soil sample by weight of soil) with fixed amount of bottom ash (about 10%). The result indicates that the UCS of soil samples increases when the percentage of soil sample replaced with GGBFS is increased. The highest (optimum) UCS value of about 4.96 kg/cm² was obtained for soil sample having 25% GGBFS by weight of soil. The percentage increase in the UCS value for soil sample having 25% GGBFS by weight of soil was 66.44% more than soil sample containing 0% GGBFS.
California Bearing Ratio (CBR): This test are carried out on natural or compacted soils in water soaked or un-soaked
conditions and the results so obtained are compared with the curves of standard test to have an idea of the soil strength of the sub grade soil. The California bearing ratio (CBR) is a penetration test for evaluation of the strength of natural ground, sub-grades and base courses beneath new carriageway construction. It was developed by the California Department of Transportation before World War II. The basic site test is performed by measuring the pressure required to penetrate soil or aggregate with a plunger of standard area. The measured pressure is then divided by the pressure required to achieve an equal penetration on a standard crushed rock material. The CBR rating was developed for measuring the bearing capacity of soils used for building roads. The CBR can also be used for measuring the load-bearing capacity of unimproved airstrips or for soils under paved airstrips. CBR at 2.5mm of Stabilized Soil & their mixing with Bottom Ash and GGBFS different percentage for soaked and unsoaked condition is given below in table 9.
SL. No Sample type Average Compressive strength (kg/cm2) Percentage variation of UCS w.r.t S
1 S 2.98 ________
2 S1 3.25 9.06
3 S2 3.58 20.13
4 S3 3.92 31.54
5 S4 4.32 44.96
6 S5 4.96 66.44
0 1 2 3 4 5 6
S S1 S2 S3 S4 S5
U
C
S
(K
G
/c
m
2)
SAMPLE Figure 3
S
S1
S2
S3
S4
Table 9 SL.
No
Sample type
Soaked Unsoaked
CBR at 2.5mm Percentage variation
of CBR w.r.t S
CBR at 2.5mm Percentage variation
of CBR w.r.t S
1 S 2.56 ____________ 3.29 ---
2 S1 3.21 25.39 4.17 18.13
3 S2 4.01 56.64 4.81 36.26
4 S3 4.65 81.64 5.66 77.34
5 S4 5.22 103.90 6.46 49.86
6 S5 5.97 133.20 7.22 40.79
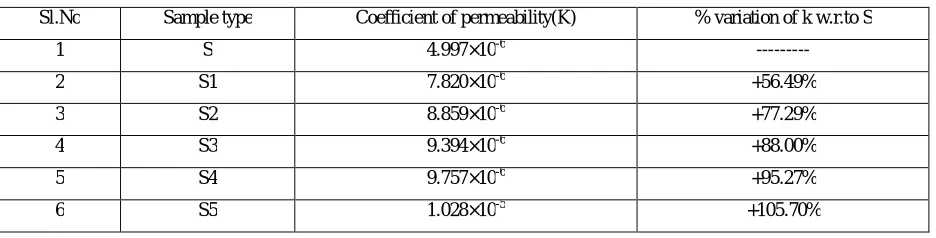
Permeability Characteristics: The use of this test is to determine the permeability (hydraulic Conductivity) of Bottom
ash bythe variable head permeability test. The coefficient of permeability (or hydraulic conductivity) refers to the ease with which water can flow through a soil. The coefficientof permeability of Bottom ash and GGBFS falls in the range of ‘k’ of silts. This property is essential for the calculation of seepage through earth dams or under sheet pile walls, the calculation of the seepage rate from waste storage facilities (landfills, ponds, etc.). The Permeability of Bottom ash depends upon grain size, degree of compaction, pozzolanic activity etc. The codal provision follows for this experiment is IS: 2720 ( Part 17 ) – 1986 . Calculate the permeability, using the following equation:
Permeability K = . log
The permeability of soil is given below in table 10.
Table 10
Sl.No Sample type Coefficient of permeability(K) % variation of k w.r.to S
1 S 4.997×10⁻⁶ ---
2 S1 7.820×10⁻⁶ +56.49%
3 S2 8.859×10⁻⁶ +77.29%
4 S3 9.394×10⁻⁶ +88.00%
5 S4 9.757×10⁻⁶ +95.27%
6 S5 1.028×10⁻⁵ +105.70%
0 2 4 6 8
S S1 S2 S3 S4 S5
C
B
R
(%
)
Sample Figure 4
Soaked
V. CONCLUSION
From the analysis of results, following points were concluded:-
The MDD of natural soil increases with increase in the percentage replacement of soil sample by GGBFS.
The OMC of natural soil decreases with increase in the percentage replacement of soil sample by GGBFS.
The LL, PL & PI value of soil sample decreses with increase in the percentage replacement of soil by GGBFS. The UCS of natural soil increases with increases in the percentage replacement of soil sample by GGBFS.
CBR value of natural soil for Soaked and Un-soaked condition increases with increase in percentage replacement
of soil sample by GGBFS.
The Permeability of soil sample increases with increases in percentage replacement of soil sample by GGBFS.
REFERENCES
1. Veith G. Wild S. and Robinson R. B.(1999) “Shear strength, permeability, and porosity ofKimmeridge clay., stabilised with lime and ground granulated blast furnace slag”ConcreteCommunications Conference, 8-9th July, 1999, Cardiff University pp41-52. Publ. British CementAssociation.
2. Wild S., Kinuthia J.M., Jones G.I. and Higgins D.D.(1998)“Effects of partial substitution of limewith ground granulated blastfurnace slag (GGBFS) on the strength properties of lime stabilised sulphatebearing clay soils”. Engineering Geology, 51, pp37-53.
3. Higgins D.D,.Kinuthia J.M. & Wild S. (1998) “Soil stabilisation using lime-activated GGBFS”Proc.6th CANMET/ICI Int. Conf. on Fly ash, Silica fume, Slag & Natural pozzolans in Concrete. ACIPublication SP 178-55 pp 1057-1073. Editor: Malhotra V.M., Bangkok Thailand. 4. Kennedy J. (1995) “Insitu stabilisation using GGBFS”. report to Civil &Marine Slag Cement Ltd.
5. Fulton F.S. (1974)“The properties of Portland cements containing milled granulated blastfurnace slag”.Publ. The Portland Cement Institute, Johannesburg.
6. IS-2720 (Part II) –(1980);“Methods of test for soils, determination of Moisture content.”Bureau ofIndian Standards, New Delhi, India. 7. IS-2720 (Part III) –(1985) (Reaffirmed 1995);“Methods of test for soils, determination of Specificgravity.”Bureau of Indian Standards, New
Delhi, India.
8. IS-2720 (Part IV) –(1985) (Reaffirmed 1995);“Methods of test for soils, determination of Grain sizeanalysis.”Bureau of Indian Standards, New Delhi, India.
9. IS-2720 (Part V) –(1985) (Reaffirmed 1995);“Methods of test for soils, determination of Liquidlimit and Plastic limit.”Bureau of Indian Standards, New Delhi, India.
10. IS-2720 (Part VI) –(1985) (Reaffirmed 1995);“Methods of test for soils, determination of Shrinkagefactor.”Bureau of Indian Standards, New Delhi, India.
11. IS-2720 (Part VII) –(1980) (Reaffirmed 1999);“Methods of test for soils, determination of watercontent-dry density relation using light compaction.”Bureau of Indian Standards, New Delhi, India.
1.00E-07 2.10E-06 4.10E-06 6.10E-06 8.10E-06 1.01E-05 1.21E-05
S S1 S2 S3 S4 S5
p
e
r
m
e
ab
il
ity
(c
m
/s
e
c
)
sample type Figure 5