Transactions,SMiRT-23 Manchester, United Kingdom - August 10-14, 2015
Division V, Paper ID 733
PROBABILISTIC-DETERMINISTIC SSI STUDIES FOR SURFACE AND
EMBEDDED NUCLEAR STRUCTURES ON SOIL AND ROCK SITES
Dan M. Ghiocel 1
1Chief of Engineering, Ghiocel Predictive Technologies, Inc., New York, USA
ABSTRACT
Probabilistic soil-structure interaction (SSI) analysis is capable of capturing in much more detail than deterministic SSI analysis the input uncertainties related to seismic motion, soil layering and structural behaviour. The paper discusses the application of probabilistic SSI analysis to nuclear structures based on the new ASCE 04-15 standard recommendations. Probabilistic and deterministic SSI analyses were comparatively performed for two SSI case studies: i) surface EPRI AP1000 NI stick model and ii) deeply embedded SMR finite-element model. Both soft soil and rock sites were considered. The probabilistic SSI analyses assumed that the spectral shape of the site-specific ground response spectra, the soil stiffness and damping profiles were idealized as random fields. The structural stiffness and damping random variations were modelled as a pair of correlated random variables that depend on the computed structural stress levels. The comparative SSI results include in-structure response spectra (ISRS) at different locations. The probabilistic SSI analysis results for the mean ISRS and 80% non-exceedance probability (NEP) ISRS are compared with the deterministic SSI analysis envelope ISRS computed including the soil variation by three profiles, lower bound (LB), best-estimate (BE) and upper bond (UB). The paper highlights significant modelling limitations in the deterministic SSI analysis.
BACKGROUND
In the introduction of the revised ASCE 04-2015 standard draft it is stated that the purpose of the analytical methods included in the standard is to provide reasonable levels of conservatism to account for uncertainties. More specifically, in the same section is written that given the seismic design response spectra input, the goal of the standard is based on a set of recommendations to develop seismic deterministic SSI responses that correspond approximately to 80% non-exceedance probability level. For probabilistic seismic SSI analyses, probabilistic responses defined with the 80% non-exceedance probability level (NEP) are considered adequate.
In this paper we performed comparative probabilistic-deterministic investigations for two RB complexes with the intention to confirm the ASCE 04 standard safety goal to achieve 80% non-exceedance probability (NEP) level for deterministic SSI responses, and also to evaluate in more detail the differences between the computed ISRS based on the recommended deterministic SSI and probabilistic SSI approaches.
PROBABILISTIC SSI METHODOLOGY
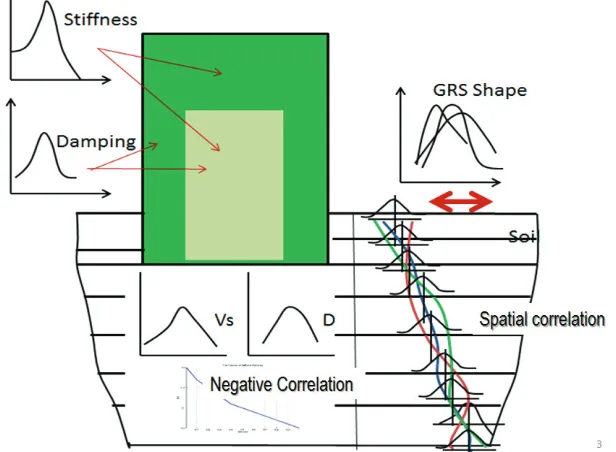
Probabilistic modelling include random variabilities due to: - Response spectral shape model for the seismic input
- Low-strain soil shear wave velocity Vs and hysteretic damping D profiles for each soil layer - Soil layer shear modulus G and hysteretic damping D as random functions of soil shear strain - Equivalent linear values or effective stiffness and structural damping for each group of
structural elements and materials depending on stress levels in different parts of structure
Figure 1 shows a generic chart of the PSSIA assuming that the probabilistic seismic input for SSI analysis is defined at the ground surface based on the PSRA simulations.
Figure 1 Probabilistic Input Models for Seismic Motion, Soil Profile and Structure Properties
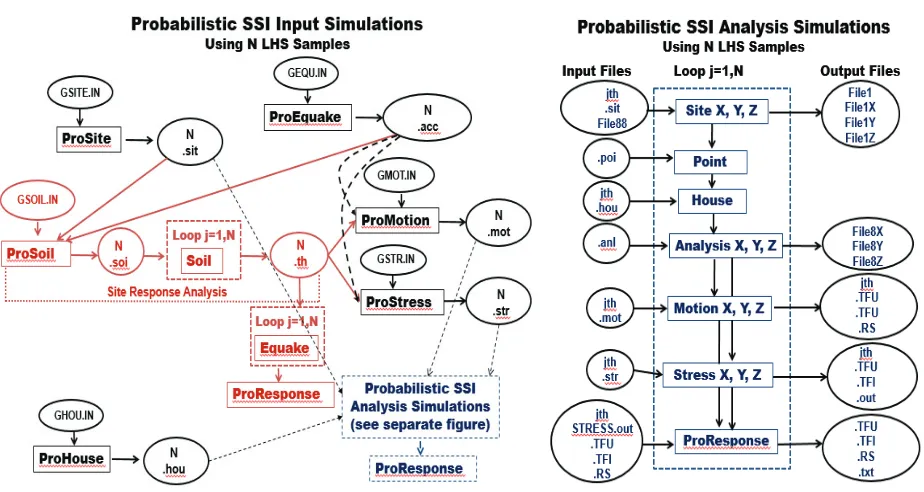
For the SSI response simulations, the input is represented as an ensemble of input motion sets. The ensemble consists of N ground acceleration time series sets. Each set consists of two horizontal components and one vertical component. The seismic motion spectral amplitude is assumed to be a lognormally distributed random variable or vector/field. Option PRO includes two probabilistic simulation methods for generating input acceleration time histories that are recommended in ASCE 04-2015 standard (Figure 2): 1) Method 1 that assumes that spectral shape is deterministic, constant shape curve, and 2) Method 2 that assumes that spectral shape is a random, variable shape curve.
different field measurements (Popescu, 1996). The selection of the soil profile model should be made based on the Vs field measurements on the site. The soil shear modulus G and damping D curves as functions of the soil shear strains in each layers, are modelled as random curves using normal 1D random field models with random samples having slow-variations.
Figure 2 Probabilistic Seismic Input Simulation Figure 3 Probabilistic Soil Profile Simulation
Figure 4 ACS SASSI Option PRO Probabilistic SSI Input Simulation and Analysis Flowchart
to be completed: 1) Generate an ensemble of simulated probabilistic input files using LHS, 2) Run the ensemble of LHS simulated input files to compute the LHS response files, and 3) Post-process statistically the ensemble of the LHS responses. The “N” notation in Figure 4 indicates the number of simulated LHS sample files. It should be noted that PSRA that is plotted with red line and PSSIA with black line.
CASE STUDIES
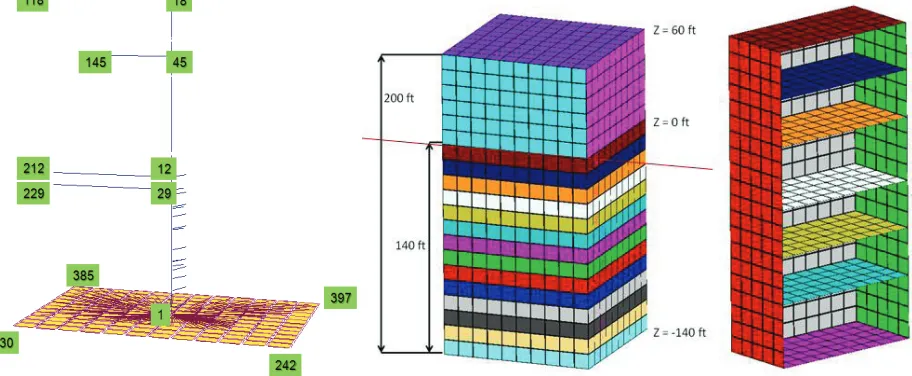
Two case studies are presented: i) Surface EPRI AP1000 NI stick model (Figure 5) and ii) Deeply embedded SMR FE model (Figure 6). The SMR embedment depth is 140ft.
Figure 5 Surface EPRI AP1000 NI Stick Figure 6 140ft Embedded SMR FE Model
Surface EPRI AP1000 Stick Model:
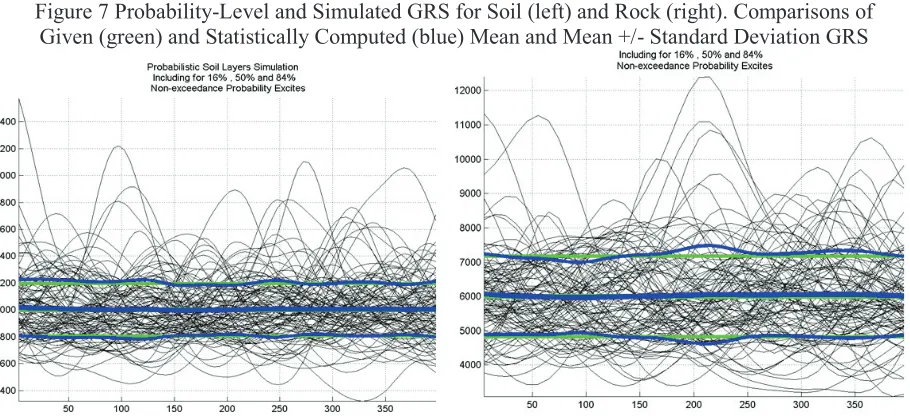
The EPRI AP1000 stick model foundation size was modified from 150ft x150ft to 150ft x 250ft to reflect more realistically the AP1000 NI foundation area. The probabilistic site-specific seismic input ground response spectra (GRS) were considered to be lognormally distributed random fields along frequency axes. The coefficient of variation was 25% for the soft soil site and 30% for rock site. The correlation structure in frequency that is related to the soil layering filtering effects on incident vertically propagation waves was considered to correspond to a correlation length of 0.7 Hz for the soft soil site and 10 Hz for the rock site. Using the GRS random field model in frequency (Method 2 in ASCE 04-2015), 60 LHS random realizations were simulated for the soil and rock sites. The statistics of the ensemble of simulations matches closely in statistical sense, as shown in Figure 7 the mean and the mean plus/minus standard deviation GRS curves.
best-estimate value for the soil shear modulus (BE), half of the best-estimate as lower bound (LB) and twice of the best estimate as upper bound (UB).
The AP1000 stick structural stiffness and damping were defined as two functionally stress-dependent random variables (Ghiocel, 2014). The two inversely dependent random variables were assumed to be lognormal variables with the mean elastic modulus reduction factor of 0.8 and c.o.v. of 0.15 and the mean damping of 7% and c.o.v of 0.30. For deterministic SSI analysis, the mean GRS input and the uncracked AP1000 stick model (with a full concrete elastic modulus and a damping ratio of 4%) were considered.
Figure 7 Probability-Level and Simulated GRS for Soil (left) and Rock (right). Comparisons of Given (green) and Statistically Computed (blue) Mean and Mean +/- Standard Deviation GRS
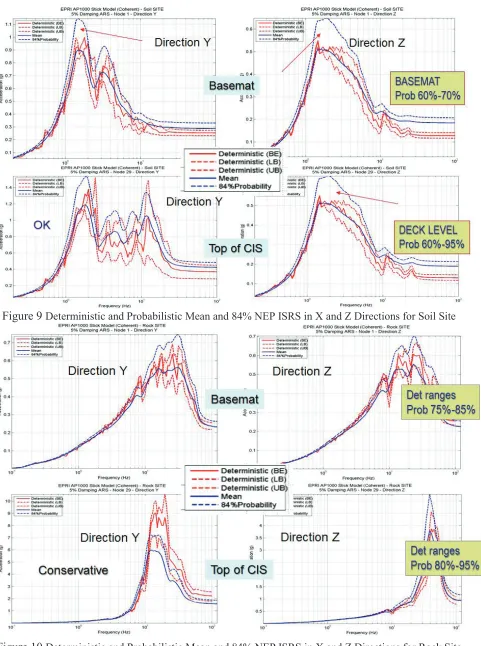
Figure 9
Deterministic and Probabilistic Mean and 84% NEP ISRS in X and Z Directions for Soil SiteComparative ISRS computed using deterministic and probabilistic SSI analyses for the AP1000 stick sitting on soft soil site and a rock site are shown in Figures 9 and 10. Two locations were selected: i) basemat level, and ii) top of CIS (Containment Internal Structure).
The comparisons between the deterministic ISRS and the probabilistic mean and 84% probability-level ISRS indicate that in an overall statistical sense, the ASCE 04 standard performance goal for the 80% non-exceedance probability (NEP) response is accomplished. Typically, the deterministic ISRS, computed as the envelope ISRS for the three deterministic soil profiles, LB, BE and UB soils, is always above mean ISRS, and in the most of the cases between the mean and the 84% NEP ISRS, and in some cases much larger than 84% NEP ISRS. However, there are some specific systematic trends that are discussed hereafter.
At the basemat level, the deterministic ISRS are closer to the mean ISRS response rather than 84% NEP ISRS response, most likely corresponding to 60-70% NEP ISRS responses. For other locations at higher elevations within the AP1000 stick, for the rock site, the computed deterministic ISRS in horizontal direction (envelope of LB, BE and UB soil results) largely overestimates the ISRS amplitude, going up to 95-99% NEP levels, well above the ASCE 04 standard performance goal of 80% NEP level. However, for rock sites, the ISRS comparisons shows some exceptions in both horizontal and vertical directions for which deterministic ISRS are closer to 60-65% NEP ISRS, or much closer to the mean ISRS rather than 80% NEP ISRS. Deterministic SSI response appears to be lower than expected in the vertical direction, especially for the soil site for which 84% NEP ISRS are significantly higher than deterministic ISRS.
Deeply Embedded SMR Model:
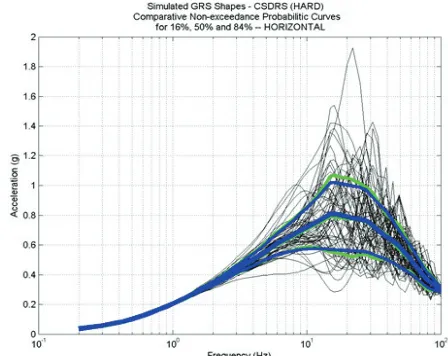
Figure 6 shows the deeply embedded SMR SSI model. The SMR structure has a size of 200ft x 100ft x 100ft (H x L x W) with an embedment of 140ft depth (Ghiocel, 2014). The soil profile shown in Figure 11 is highly non-uniform with a soil layer stiffness variation inversion within the embedment depth. The seismic control motion was input at the SMR foundation level (FIRS) at 140ft depth (elevation 0ft). For probabilistic analyses the in-column FIRS input motion were computed based on the probabilistic site response analysis using 60 LHS random samples. The statistics and the 60 randomized soil profiles are plotted in Figure 11. The probabilistic seismic input was defined by the UHRS motion simulated at the 500ft depth bedrock. The statistics and the 60 LHS simulations of the UHRS outcrop input are plotted in Figure 12.
The concrete structural stiffness and damping were defined as two negatively correlated random variables. The two random variables were assumed to be lognormal variables with the mean elastic modulus reduction factor of 0.8 and c.o.v. of 0.10 and the mean damping of 6% and c.o.v of 0.30. A correlation coefficient of -0.80 was assumed.
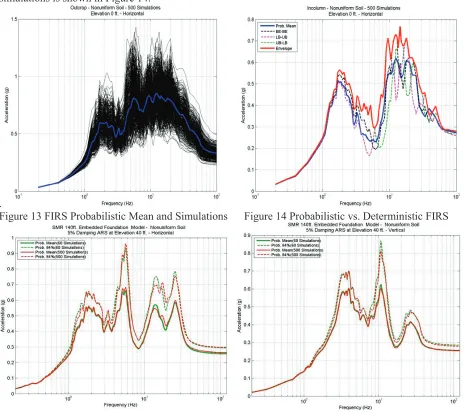
For comparisons, we considered 60 and 500 probabilistic simulations. Figure 15 shows that the probabilistic mean and 84% NEP ISRS within the SMR structure are basically identical for the 60 and the 500 LHS random sample sets. Figures 13 shows the probabilistic mean and simulations of the outcrop FIRS at 140ft depth. A comparison between the probabilistic mean in-column FIRS and the deterministic in-column FIRS for the LB, BE and UB soil profiles determined based on the probabilistic site response simulations is shown in Figure 14.
.
Figure 13 FIRS Probabilistic Mean and Simulations Figure 14 Probabilistic vs. Deterministic FIRS
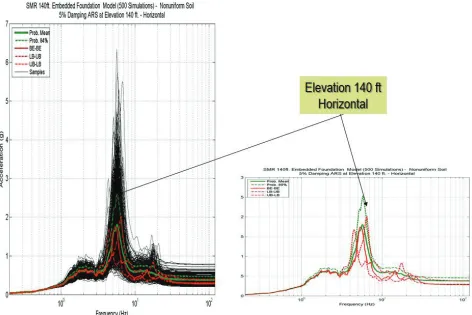
Figure 15 Comparative Mean and 84% NEP ISRS in Horizontal and Vertical Directions Computed at 100ft Depth (Elevation 40ft above Foundation Level) for the 60 and 500 LHS Simulations
Figure 16 Deterministic LB, BE, UB ISRS and Probabilistic Mean and 84% NEP ISRS at 40ft Elevation
As expected, the SSI response of the deeply embedded SMR is more sensitive to the soil property variations than the surface AP1000 stick model. The kinematic SSI effects are major for the deeply embedded model and only negligible for the surface model.
Figures 16 and 17 show comparisons of the deterministic ISRS for the LB, BE and UB soils, (red lines) and probabilistic mean and 80% NEP ISRS (green lines) at 40ft and 140ft elevations. The left plots include the 500 ISRS random samples. These ISRS comparisons are for two selected situations that illustrate limitations of the deterministic SSI analysis. Figure 16 illustrates that in the high-frequency range, above 10 Hz, the deterministic ISRS, especially for the UB soil, has a much larger spectral peak amplitude than the probabilistic mean or 80% NEP ISRS (see right plots). The difference is larger than 100%. By looking at the Figure 16 ISRS plots (see left plots) that include the probabilistic simulated ISRS, it becomes obvious that the deterministic UB response represents a very biased result that appears to be outside of the range soil profile variations. This is due the fact that producing a randomized soil profile that is similar to the UB soil profile for which all soil layers are being simultaneously stiffer at the 84% NEP level, has an very low likelihood, in other words, the UB soil profile corresponds to a small occurrence probability within the random sample space. It is evident that the deterministic SSI analysis has no way of considering the low occurrence probability associated to a randomized soil profile that is identical with the UB soil profile. In deterministic SSI analysis, the UB soil profile has an implicit occurrence probability of unity since it corresponds to a sure event. This appears to be a penalty of the deterministic SSI analysis on the economic aspects of the nuclear structure design.
Figure 17 shows a reverse situation in which the deterministic ISRS are well below the probabilistic 80% NEP ISRS (see right plots). For random samples, as indicated in Figure 17 (see left plots), the computed ISRS could be much larger, by 100-150%, than the deterministic envelope ISRS (for LB, BE and US soils). The probabilistic 80% NEP ISRS dominant peak at @ 6 Hz is about 25-30% larger than the deterministic ISRS peak at @ 6 Hz. This apparent deficiency of the deterministic SSI analysis is due to the simplistic way in which the soil stiffness variation is considered by only three discrete values that correspond to the LB, BE and UB soil profiles. In reality, the soil stiffness variation includes a continuum spectrum of values. There is a myriad of possible random combinations of the input variations that could amplify largely the SSI response. This appears to be a penalty of the deterministic SSI analysis on the safety aspects of the nuclear structure design.
CONCLUSIONS
The paper compares ISRS results obtained using deterministic and probabilistic SSI analyses in accordance with the recommendations of the new ASCE 04-2015 standard. Serious modelling limitations of the current deterministic SSI approach are highlighted. The differences between deterministic SSI and probabilistic SSI analyses appear to be much larger for deeply embedded structures, such as SMR, which are quite sensitive to the soil motion and layer property variations.
REFERENCES
Ghiocel D, M. (2014). Comparative Probabilistic-Deterministic Studies and RVT-based SASSI Analyses of Nuclear Structures for Soil and Rock Sites", U.S. Department of Energy, DOE Natural Phenomena Hazards Meeting, Session on "Soil-Structure Interaction", Germantown, MD, USA, October 21-22
http://www.energy.gov/sites/prod/files/2015/05/f22/DOE-NH-Probabilistic-Deterministic-SSI-Oct-21-2014.pdf
Ghiocel Predictive Technologies, Inc. (2015). “ACS SASSI - An Advanced Computational Software for 3D Dynamic Analyses Including SSI Effects”, ACS SASSI Version 3.0 Manuals, March 31,