Abstract
ANGELL, JAMES ROSS. Practical Perspectives on Spent Nuclear Fuel Transportation Risks. (Under the direction of Man-Sung Yim)
Transportation of spent nuclear fuel is essential for relocation of used fuel
assemblies from temporary storage facilities to a geological repository. There has been a great deal of publicized concern over the hazard of shipments of radiological materials in recent years due to the proposed Yucca Mountain repository. This concern over the radiological material transport is commonly based on a public perception of extreme fear or dread associated with radiological material.
The goal of this work is to provide some insight into the practical understanding and relative significance of the risk values presented in a transportation risk assessment. This will be achieved by performing a transportation risk assessment for shipment of spent nuclear fuel, by both truck and rail, for four specific routes. An investigative analysis into the possibility of a successful sabotage attack will also be performed. Finally, a comparison between the transportation and sabotage analysis results will be made to the transportation of other materials. This will include comparison against transport of hazardous chemicals and gases, transport of materials used in the production of electricity, and a comparison against previous work on a potential radiological
dispersal device.
Practical Perspectives on Spent Nuclear Fuel
Transportation Risks
By
James Ross Angell
A thesis submitted to the
Graduate Faculty of North Carolina State University
Nuclear Engineering
Raleigh, North Carolina
2005
Approved by:
_____________________________ _____________________________
Dr. Mohamed A. Bourham Dr. Vin K. Saxena
Biography
James Ross Angell was born in Salmon ID on January 23, 1974. He graduated
high school from South Fremont High School in 1992. He received an Associate of
Applied Science degree in Electronics from the Eastern Idaho Technical College in 1994.
He received a Bachelor of Science Degree in Mechanical Engineering from the
University of Idaho in 2002. Research interests included application and teaching
techniques for problem solving methods. He received a Master of Science degree in
Nuclear Engineering from North Carolina State University in 2005. Research interests
included nuclear fuel transportation, nuclear waste policy, radiological dispersal devices,
Acknowledgements
I would like to thank my parents for there continual support and belief in me. I
also thank my brothers for their friendship. I am grateful for my undergraduate mentors,
Dr. Donald Elger and Russ Porter. They had the ability and took the time to make an
impact on my life. I would like to thank my graduate advisor, Dr. Man-Sung Yim. His
patience, understanding, and guidance were a significant influence on my graduate work
and on my life. His willingness to help with both my academic and personal life will
always be remembered. I appreciate Dr. Vin Saxena for his jolly enthusiasm and interest
in my future success. I would like to close by thanking Dr. Mohamed Bourham, my
fellow graduate students, and the nuclear engineering staff. My thesis, as well as many
Table of Contents
List of Tables ... vi
List of Figures ... vii
1 Spent Nuclear Fuel Transportation ... 1
1.1 Introduction... 1
1.2 Spent Nuclear Fuel Description ... 2
1.3 Cask Description... 3
1.4 Cask Testing... 5
1.5 Involved Agencies ... 7
1.6 Incident Free Risk ... 8
1.7 Accident Risk... 9
1.8 Sabotage Risk... 10
1.9 Scope of Work ... 11
2 Transport Routes... 13
2.1 Introduction... 13
2.2 Route Information... 14
3 Spent Nuclear Fuel Transportation Risk... 17
3.1 Introduction... 17
3.2 Transportation Risk... 19
4 Sabotage Risk... 22
4.1 Introduction... 22
4.2 Sabotage Model Verification ... 23
4.3 Sabotage vs. Transportation Risk ... 26
5 Sabotage Attack Parameter Investigation ... 28
5.1 Introduction... 28
5.2 Sensitivity Study ... 28
5.3 Study of Key Parameters ... 30
5.3.1 Atmospheric Stability ... 30
5.3.2 Rainfall Rate ... 32
5.3.3 Wind Speed... 33
5.3.4 Release Fraction... 34
5.3.5 Additional Parameters... 37
5.3.6 Dose Conversion Factor... 37
6 Practical Perspectives... 42
6.1 Hazardous Material Transportation Comparison... 42
6.2 Electrical Power Production Comparison ... 44
6.3 Radiological Dispersal Device Comparison ... 46
7 Conclusion ... 50
8 Discussion of Recent Literature... 53
9 Future Works ... 55
List of Tables
Table 1.1: Key parent nuclides for PWR three year cooled spent fuel... 3
Table 1.2: Transportation accident severity fractions... 10
Table 2.1: Selected TRAGIS input values... 13
Table 2.2: Truck route data calculated with TRAGIS ... 15
Table 2.3: Rail route data calculated by TRAGIS ... 16
Table 3.1: Vehicle accident and fatality rate ... 18
Table 3.2: Estimated truck transportation risk values... 19
Table 3.3: Estimated rail transportation risk values... 20
Table 4.1: Estimated release fraction for each physical-chemical group ... 23
Table 4.2: Summary of truck sabotage analysis from various studies... 24
Table 4.3: Summary of rail sabotage analysis from various studies... 24
Table 4.4: Transportation risk summary for the Diablo Canyon, CA route ... 26
Table 5.1: Summary of truck sabotage sensitivity study to 10% change in input ... 29
Table 5.2: Bounded region of release fraction and resulting consequences ... 35
Table 5.3: Inhalation rate and DCF variability distribution... 38
Table 5.4: Statistics for the increased fatal cancer risk... 39
Table 6.1: Summary of SNF, Chlorine, and LPG accident and sabotage transportation risk... 43
Table 6.2: Summary of spent fuel and coal transportation risk for Diablo Canyon, CA route ... 45
Table 6.3: Transportation fatality risk summary for four electrical power producing fuels... 46
List of Figures
Figure 1.1: Truck transport cask cutaway diagram (Source: Dept. of Energy) ... 4
Figure 1.2: Rail transport cask cutaway diagram (Source: OCRWM) ... 5
Figure 2.1: Truck routes calculated by TRAGIS ... 15
Figure 2.2: Rail routes calculated by TRAGIS... 16
Figure 5.1: Impact of atmospheric stability on a sabotage attack (flat terrain) ... 30
Figure 5.2: Impact of atmospheric stability on a sabotage attack (urban terrain)... 31
Figure 5.3: Impact of rainfall rate on a sabotage attack... 32
Figure 5.4: Impact of wind speed on a sabotage attack (flat terrain)... 33
Figure 5.5: Impact of wind speed on a sabotage attack (urban terrain) ... 34
Figure 5.6: Impact of release fraction on a sabotage attack... 36
Figure 5.7: Excess cancer risk for point estimate (Case I) and triangular distribution (Case II) of the release fraction... 40
1 Spent Nuclear Fuel Transportation
1.1 Introduction
Transportation of spent nuclear fuel (SNF) is essential for relocation of used fuel
assemblies from temporary storage facilities located at the power plant site to geological
repositories, such as the Yucca Mountain facility, for permanent storage. Numerous
factors must be considered prior to spent fuel transportation from a temporary storage
facility to a permanent repository. A shipping container, called a cask, must be designed
and tested for safe reliable transportation. The spent fuel usually requires a cooling
period of more than 150 days and often several years after being removed from the
reactor core before shipment to a repository is made. However, a large number of spent
fuel assemblies have been in temporary storage at various power plant facilities for long
time periods and will be suitable for shipment immediately.
The spent fuel assemblies will need to be inspected and organized into groups for
insertion into a shipping cask. After the spent fuel assemblies are inserted into a shipping
cask, the cask is further inspected before loading onto either truck or rail transports.
During transport, the vehicle is continuously monitored for location through a global
positioning system (GPS) tracking system with armed security for most of the truck
transport routes. Upon reaching the repository, the shipping cask is inspected, unloaded
from the transport vehicle, the spent fuel assemblies are removed from the shipping cask
and prepared for permanent storage. The shipping cask is then cleaned and possibly used
for future shipments. Detailed record keeping is prominent throughout the entire process.
There has been a great deal of publicized concern over the hazard of shipments of
This concern over the radiological material transport is commonly based on a public
perception of extreme fear or dread associated with radiological material, especially the
term ‘radioactive waste’. This perception of dread is easily associated with a lack of
knowledge about radiological materials. This lack of knowledge may be the result of
inadequate explanation by researchers or by a lack of ‘need to know’ by the general
public. Simply put, if something (radiological material transport) is not an issue then
people rarely take the time to learn about it. This is due in a large part to the exceptional
safety record of previous radiological material shipments. Unfortunately, this relative
lack of knowledge the public currently has about radiological materials makes sabotage
of transportation or storage locations an ideal choice for terrorist activities.
1.2 Spent Nuclear Fuel Description
Spent nuclear fuel refers to the uranium fuel assembly after it has been removed
from a reactor. Spent nuclear fuel contains uranium along with other radioactive material
resulting from the reactor operation. Once removed from the reactor, the fission process
has stopped. However, the spent fuel continues to generate significant radiation and
release heat, commonly known as ‘radioactive decay’. There can be some variation in
the type and amount of radioactive material contained in spent nuclear fuel depending on
factors such as the type of reactor, reactor burnup rate, or initial fuel design.
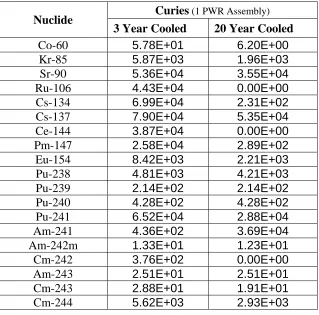
The spent fuel used for this study is a pressurized water reactor (PWR) assembly.
This is the most common type of reactor assembly used for electrical power generation in
the United States. Table 1.1 lists the more significant parent nuclides and activity level
Table 1.1: Key parent nuclides for PWR three year cooled spent fuel
Curies (1 PWR Assembly) Nuclide
3 Year Cooled 20 Year Cooled
Co-60 5.78E+01 6.20E+00
Kr-85 5.87E+03 1.96E+03
Sr-90 5.36E+04 3.55E+04
Ru-106 4.43E+04 0.00E+00
Cs-134 6.99E+04 2.31E+02
Cs-137 7.90E+04 5.35E+04
Ce-144 3.87E+04 0.00E+00
Pm-147 2.58E+04 2.89E+02
Eu-154 8.42E+03 2.21E+03
Pu-238 4.81E+03 4.21E+03
Pu-239 2.14E+02 2.14E+02
Pu-240 4.28E+02 4.28E+02
Pu-241 6.52E+04 2.88E+04
Am-241 4.36E+02 3.69E+04
Am-242m 1.33E+01 1.23E+01
Cm-242 3.76E+02 0.00E+00
Am-243 2.51E+01 2.51E+01
Cm-243 2.88E+01 1.91E+01
Cm-244 5.62E+03 2.93E+03
1.3 Cask Description
Due to the radioactive decay inherent in the spent nuclear fuel, measures must be
taken to ensure the safety of workers and the general public. A shipping cask is used for
this purpose. The shipping cask ensures protection of the spent nuclear fuel during the
transportation process. The cask also significantly reduces or completely prevents the
release of radioactive material during an accident or sabotage attack.
Transportation of spent nuclear fuel is primarily accomplished with road and rail
routes. Each mode of transportation uses a different shipping cask based on similar
design considerations. The truck casks used for roadway routes are small, weighing
of 1.75 m. Depending on cask dimension and design, one to three PWR spent fuel
assemblies could be encased inside the cask. A truck transport cask can carry
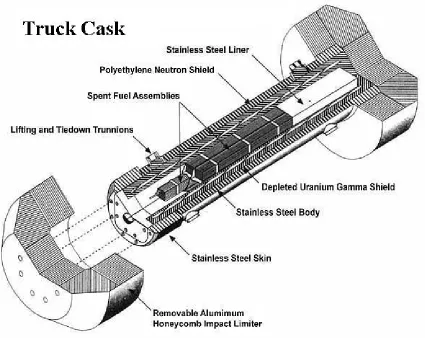
approximately 1.5 tons of spent fuel. The cask construction usually involves an inner and
outer layer of stainless steel, with a layer(s) of lead, depleted uranium, or polymer
shielding materials for both gamma and neutron shielding. One cask design for truck
transport is shown in Figure 1.1.
Figure 1.1: Truck transport cask cutaway diagram (Source: Dept. of Energy)
Larger load weights are capable of being transported on railway cars allowing the
an overall length of approximately 5 – 6 m and a diameter of 2.4 – 3 m. Depending on
cask dimensions and design, 10 - 24 PWR spent fuel assemblies could be encased inside
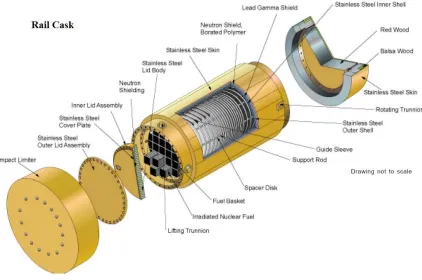
the cask. A rail transport cask can carry approximately 5 - 12 tons of spent fuel. Rail
cask construction is similar in shape and materials to the truck cask with larger
dimensions. One cask design for rail transport is shown in Figure 1.2.
Figure 1.2: Rail transport cask cutaway diagram (Source: OCRWM)
1.4 Cask Testing
A spent fuel transport cask must meet strict specifications before the cask is
certified by the Nuclear Regulatory Commission (NRC). All cask designs must have a
Cask designs are tested to verify cask integrity and performance criteria. Tests concerned
with cask performance in normal operation and possible accident situations include:.
• a 30 ft free fall in the most damaging orientation onto an unyielding surface: simulates a 120 mph crash into a concrete bridge abutment • a 40 in free fall onto a 6 in diameter steel spike: simulates a puncture
scenario
• 30 minutes completely engulfed in an open flame fire at 1,475˚F • 8 hr submergence in water at a depth of 3 ft
These tests are performed and must be passed in sequence.
There have been further tests performed, primarily at Sandia National Laboratory
(SNL), to evaluate the cask performance under the conditions of a deliberate sabotage
attack which include:
• the cask engulfed in a propane gas explosion
• a jet engine rotor launched at the cask at near supersonic speed
• both 60 and 80 mph crash tests of truck and cask into 700 ton reinforced concrete walls
• an 80 mph crash test of a rail car and cask into a 700 ton reinforced concrete wall
• a rail cask broadsided by a 120 ton locomotive traveling at 80 mph
• 90 minutes engulfed in a 2000˚F fire (the fire burned 9000 gal. of aviation fuel)
• a truck cask dropped in a 2000 ft free fall onto hard ground
• a 140 ton locomotive broadsided a 48 ton rail cask attached to a derailed rail car
• impact from several high energy density devices (HEDD): this is a military anti-tank, penetrating explosive projectile
In all the above tests, except for the HEDD scenario, the cask maintained structural
integrity with no release of radiation material. The HEDD tests did puncture the cask and
result in an environmental release of spent fuel material. From these tests it is apparent
the spent fuel shipping cask performed well above initial design expectations.
Furthermore, spent nuclear fuel is now shipped entirely in casks using “dry”
materials, meaning no liquid is contained in the shipping cask. The spent fuel is a solid
There have been over 3,000 shipments of spent fuel assemblies throughout the U.S. with
no physical release of the spent fuel material in transport. This safety record is a direct
result of the robust nature, careful engineering, and strict inspection requirements placed
on the shipping cask designs.
1.5 Involved Agencies
Numerous organizations are involved with the spent fuel shipping cask design,
testing, and transportation. The NRC sets cask certification design and performance
standards. These standards must be met and verified through modeling or testing prior to
cask use. The NRC also sets guidelines for cask safeguards and security against attacks,
diversion, or theft of spent fuel shipments. The U.S. Department of Transportation
(DOT) is the leading body for safe transportation of spent fuel shipments in the U.S. The
DOT regulates and test items such as driver or other personnel training, and shipping
cask packaging, labeling, and handling. Tasks such as transport security, route planning
to minimize hazards, and transport communication between involved agencies are also
led by the DOT.
The Office of Civilian Radioactive Waste Management (OCRWM) under the
Department of Energy (DOE) was established to develop and manage a federal system
for disposing of all spent nuclear fuel from commercial nuclear reactors and high-level
radioactive waste resulting from atomic energy defense activities. Radiation waste
management and transportation information and updates for both federal and public
arenas are also a large responsibility of the OCRWM with support from the NRC and
Agency (FEMA) and state and local emergency response crews are also involved in the
planning and preparation for possible accident scenarios.
1.6 Incident Free Risk
Incident-free (expected or normal) transportation events occur when no accident,
packaging, or handling abnormality and no deliberate attack occurs during the
transportation process. All methods of radiological material transportation are regulated
in the United States by the NRC and DOT. Specifics can be found in the Code of Federal
Regulations (CFR), Title 10 CFR Parts 71-73 and Title 49 CFR Parts 171-178. Topics
such as the maximum permissible dose rates (both from the shipping cask and to crew
members), packaging criteria and certification, as well as many other regulations for
radiological material transportation are discussed.
Incident-free transportation does involve a risk to both the occupational workers
and the general public. These risks include vehicle related risks caused by the motion of
transport vehicles (such as a risk of accident and exposure to exhaust emissions) and an
additional risk due to the nature of the radioactive material cargo.
For spent fuel transportation, the cargo related risk is primarily related to the low
level of ionizing radiation being emitted by the spent fuel through the shipping cask
during transport or the exposure of radioactive material released during a severe traffic
accident. In both cases, the possibility of an increase risk of developing a latent cancer is
the primary area of concern. A latent cancer, like a radiation induced cancer, typically
1.7 Accident Risk
Accidents, although avoided, do occur during the transportation process.
Accidents vary in both likelihood of occurrence (probability) and severity (consequence).
Historical data of previous accidents along with estimation about postulated accident
scenarios are used to establish a data set of accident probability and consequence pairs.
The 18 and 20 accident cases, for truck and rail respectively, are established for
various extreme accident conditions that could lead to release of radiological material.
The accident cases are determined from different types of accidents, impact velocity
ranges, and temperature ranges. The additional accident category, #19 for truck and #21
for rail, accounts for all other types of accidents that will not lead to release of
radiological material.
For each of these probability/consequence pairs, an effect on the shipping cask,
possible radiological release, and potential adverse radiation exposure can be determined.
This study relies on the ‘Reexamination of SNF Shipment Risk: NUREG/CR-6672’
[Sprung et al, 2000] for the probability of occurrence for a given set of accident
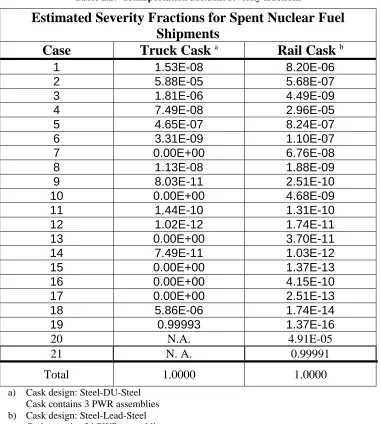
categories. Table 1.2 lists the conditional probabilities for each accident category for
both truck and rail. The consequence of each accident category is addressed by a
corresponding release fraction. The release fraction describes the amount and conditions
Table 1.2: Transportation accident severity fractions
Estimated Severity Fractions for Spent Nuclear Fuel
Shipments
Case Truck
Cask
aRail
Cask
b1 1.53E-08 8.20E-06
2 5.88E-05 5.68E-07
3 1.81E-06 4.49E-09
4 7.49E-08 2.96E-05
5 4.65E-07 8.24E-07
6 3.31E-09 1.10E-07
7 0.00E+00 6.76E-08
8 1.13E-08 1.88E-09
9 8.03E-11 2.51E-10
10 0.00E+00 4.68E-09
11 1.44E-10 1.31E-10
12 1.02E-12 1.74E-11
13 0.00E+00 3.70E-11
14 7.49E-11 1.03E-12
15 0.00E+00 1.37E-13
16 0.00E+00 4.15E-10
17 0.00E+00 2.51E-13
18 5.86E-06 1.74E-14
19 0.99993 1.37E-16
20 N.A. 4.91E-05
21 N. A. 0.99991
Total 1.0000 1.0000 a) Cask design: Steel-DU-Steel
Cask contains 3 PWR assemblies b) Cask design: Steel-Lead-Steel
Cask contains 24 PWR assemblies
1.8 Sabotage Risk
The general public often perceive a malevolent act (or sabotage attack) on a spent
nuclear fuel shipment as both easily achieved and extremely harmful. However, a
sabotage attack would be difficult to achieve, require trained personnel, have no
guaranteed effect, and the resulting health effects are considerably below current public
Due to the robust design of the shipping cask, a significant event is necessary to
breach the cask. This would require a large amount of high explosives or a large high
energy density device (HEDD) such as a military anti-tank projectile. Even with these
sabotage devices, the amount of radioactive material released from the cask is low. For
this type of sabotage attack, the estimated number of fatalities resulting directly from the
attack (not related to the cask contents) could easily exceed the number of fatalities due
to the spent fuel cargo that may be released. It is interesting that for a maximally
successful HEDD attack, the estimated number of fatalities is below the number of
fatalities estimated in the worst-case accident scenarios.
1.9 Scope of Work
The goal of this work is to provide some insight into the practical understanding
and relative significance of the risk values presented in a transportation risk assessment.
This will be achieved by performing a transportation risk assessment for shipment of
spent nuclear fuel, by both truck and rail, for four specific routes. An investigative
analysis into the possibility of a successful sabotage attack will also be performed.
Finally, a comparison between the transportation and sabotage analysis results will be
made to the transportation of other materials. This will include comparison against
transport of hazardous chemicals and gases, transport of materials used in the production
of electricity, and a comparison against previous work on a potential radiological
dispersal device (RDD).
There have been numerous papers written about the risks due to the
transportation of radiological materials over the past several decades. This work will rely
about the transportation of spent nuclear fuel rather than to actually be a complete,
in-depth transportation risk analysis.
The transportation of radiological materials addresses an engulfing number of
topics. This work will focus on the human risk associated with the transportation process
and transportation cargo. While topics such as policy, public perception, stakeholder
communication, or the relevance or justifiable use of radiological materials are of
2 Transport
Routes
2.1 Introduction
Four sample routes were selected for the analysis based on four power plant
locations and Yucca Mountain. One power plant location was selected for the northwest,
southwest, northeast, and southeast regions of the United States. This provides a sample
route for short and long distance routes, rural and urban population settings, and various
geographic and climatic regions.
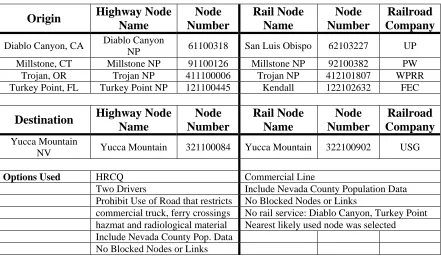
The routes were selected using the Transportation Routing Analysis Geographic
Information System (TRAGIS) program developed at Oak Ridge National Laboratory
(ORNL) [ORNL, 2003]. The TRAGIS model is used to calculate highway, rail, or
waterway routes within the United States. The selected nodes and program options used
for route calculation are listed in Table 2.1.
Table 2.1: Selected TRAGIS input values
Origin Highway Node Name Node Number Rail Node Name Node Number Railroad Company Diablo Canyon, CA Diablo Canyon
NP 61100318 San Luis Obispo 62103227 UP Millstone, CT Millstone NP 91100126 Millstone NP 92100382 PW Trojan, OR Trojan NP 411100006 Trojan NP 412101807 WPRR Turkey Point, FL Turkey Point NP 121100445 Kendall 122102632 FEC
Destination Highway Node Name Node Number Rail Node Name Node Number Railroad Company Yucca Mountain
NV Yucca Mountain 321100084 Yucca Mountain 322100902 USG
Options Used HRCQ Commercial Line
Two Drivers Include Nevada County Population Data Prohibit Use of Road that restricts No Blocked Nodes or Links
commercial truck, ferry crossings No rail service: Diablo Canyon, Turkey Point hazmat and radiological material Nearest likely used node was selected Include Nevada County Pop. Data
The shipment of highway route-controlled quantities (HRCQ) of radioactive
materials are all based on DOT routing regulations in the Code of Federal Regulations,
49 CFR 397.101. The Diablo Canyon and Turkey Point sites do not currently have rail
access. The nearest likely rail node was used for the routing calculations. The short
distance of heavy-haul truck transport between the sites and the rail head are not
addressed in this analysis.
2.2 Route Information
The TRAGIS calculated routes for truck shipments are shown in Figure 2.1. The
calculated route information is listed in Table 2.2. The routes are separated into three
population density regions: rural, suburban, and urban. These regions are determined
based on a population density of: <54, 54 - 1300, >1300 people / sq. km, respectively.
The population regions were determined based on an 800 m wide corridor on either side
of the selected route.
The population data for TRAGIS is derived from the LandScan USA 15-arc
second (approximately 360 m by 460 m) grid cell population database [Bhaduri, 2002].
This database represents nighttime population distributions developed from the 2000 U.S.
Census Bureau block group population, roads from the Census TIGER data, slope from
the NIMA Digital Terrain Elevation Data, and land cover from the USGS National Land
Diablo Canyon, CA
Turkey Point, FL Millstone, CT Trojan, OR
Diablo Canyon, CA
Turkey Point, FL Millstone, CT Trojan, OR
Figure 2.1: Truck routes calculated by TRAGIS
Table 2.2: Truck route data calculated with TRAGIS
Diablo Canyon, CA
Millstone, CT
Trojan, OR
Turkey Point, FL
Total Distance km 987.7 4497.8 2136.5 5004.2 Distance by Category
Rural km 727.5 3351.6 1690.6 3762.8
Suburban km 176.9 986.9 362.5 1018.7
Urban km 83.3 159.6 83.6 222.6
Weighted Population Density
Rural /sq km 7.5 11.5 8.6 10.0
Suburban /sq km 405.3 332.9 361.4 367.1
Urban /sq km 2822.7 2478.3 2442.0 2430.6
Trip Time hr 13.4 48.3 23.3 53.3
Stop Time hr 1.4 6.3 3.0 7.0
Total Pop
(800m) person 512307 1093914 467487 1400794
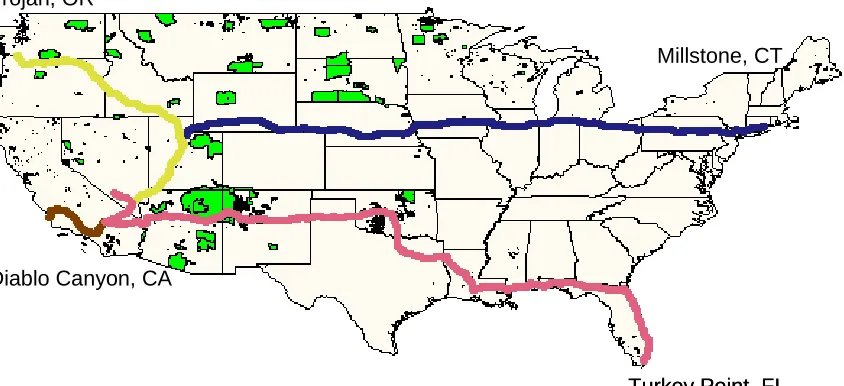
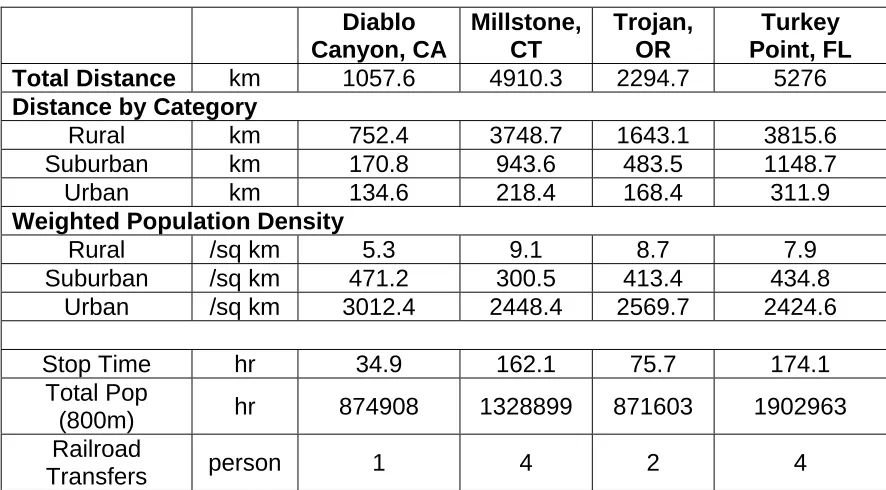
The calculated routes for rail shipments are shown in Figure 2.2. The calculated
Diablo Canyon, CA
Turkey Point, FL Millstone, CT Trojan, OR
Diablo Canyon, CA
Turkey Point, FL Millstone, CT Trojan, OR
Figure 2.2: Rail routes calculated by TRAGIS
Table 2.3: Rail route data calculated by TRAGIS
Diablo Canyon, CA
Millstone, CT
Trojan, OR
Turkey Point, FL Total Distance km 1057.6 4910.3 2294.7 5276
Distance by Category
Rural km 752.4 3748.7 1643.1 3815.6
Suburban km 170.8 943.6 483.5 1148.7
Urban km 134.6 218.4 168.4 311.9
Weighted Population Density
Rural /sq km 5.3 9.1 8.7 7.9
Suburban /sq km 471.2 300.5 413.4 434.8
Urban /sq km 3012.4 2448.4 2569.7 2424.6
Stop Time hr 34.9 162.1 75.7 174.1
Total Pop
(800m) hr 874908 1328899 871603 1902963
Railroad
3 Spent Nuclear Fuel Transportation Risk
3.1 Introduction
For this study, the transportation risk analysis was performed using the
RADTRAN 5 code developed at Sandia National Laboratory [Neuhauser, 2000].
RADTRAN was developed to estimate the risks associated with incident-free
transportation of radiological materials and risks associated with accidents that might
occur during transportation.
RADTRAN input values were taken from the Resource Handbook on DOE
Transportation Risk Assessment [Chen, 2002], the RADTRAN/RADCAT User’s Guide
[Weiner, 2004], along with the route length and population density values generated with
the TRAGIS program. The accident rate for each route was determined by a distance
weighted average of the accident rate (accident/truck-km or accident/railcar-km) listed
for each state using the Saricks and Tompkins 1999 data [Chen, 2002]. A similar method
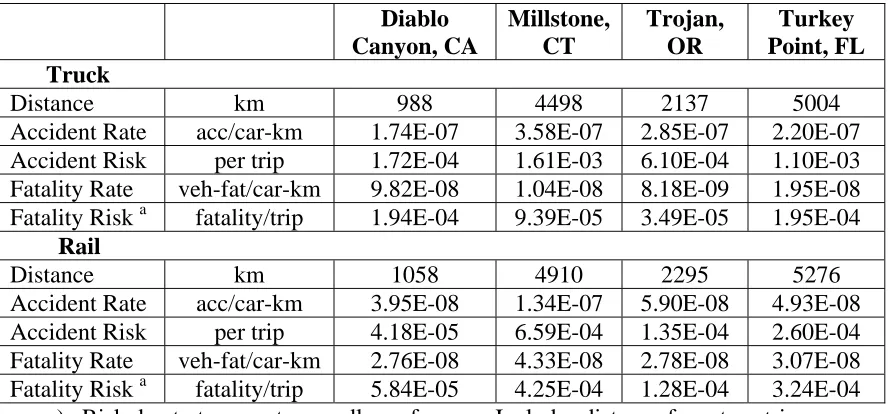
was used for the vehicle related fatality rate data. The truck and rail accident rate and
vehicle related fatality rate for each route are listed in Table 3.1.
As expected, the accident rates are relatively consistent for both truck and rail
which generates an increased risk of accident for an increased distance of travel.
However, the fatality rate is nearly an order of magnitude larger for truck transport over
the Diablo Canyon route, the shortest route. This is due to a significantly larger accident
fatality rate for the state of California relative to other states. This results in an increased
vehicle related fatality rate for the short distance Diablo Canyon route compared to the
Table 3.1: Vehicle accident and fatality rate
Diablo Canyon, CA
Millstone, CT
Trojan, OR
Turkey Point, FL Truck
Distance km 988 4498 2137 5004
Accident Rate acc/car-km 1.74E-07 3.58E-07 2.85E-07 2.20E-07 Accident Risk per trip 1.72E-04 1.61E-03 6.10E-04 1.10E-03 Fatality Rate veh-fat/car-km 9.82E-08 1.04E-08 8.18E-09 1.95E-08 Fatality Risk a fatality/trip 1.94E-04 9.39E-05 3.49E-05 1.95E-04 Rail
Distance km 1058 4910 2295 5276
Accident Rate acc/car-km 3.95E-08 1.34E-07 5.90E-08 4.93E-08 Accident Risk per trip 4.18E-05 6.59E-04 1.35E-04 2.60E-04 Fatality Rate veh-fat/car-km 2.76E-08 4.33E-08 2.78E-08 3.07E-08 Fatality Risk a fatality/trip 5.84E-05 4.25E-04 1.28E-04 3.24E-04
3.2 Transportation Risk
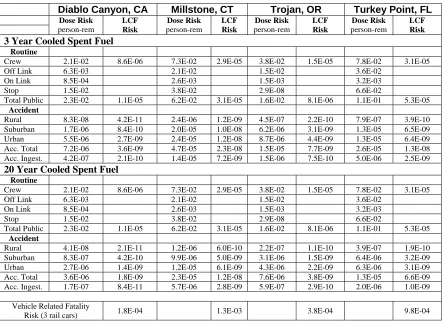
The truck transportation risk values estimated with the RADTRAN program are
listed in Table 3.2.
Table 3.2: Estimated truck transportation risk values
Diablo Canyon, CA Millstone, CT Trojan, OR Turkey Point, FL
Dose Risk person-rem LCF Risk Dose Risk person-rem LCF Risk Dose Risk person-rem LCF Risk Dose Risk person-rem LCF Risk
3 Year Cooled Spent Fuel
Routine
Crew 6.5E-02 2.6E-05 2.8E-01 1.1E-04 1.3E-01 5.1E-05 3.1E-01 1.2E-04 Off Link 5.4E-03 2.4E-02 9.5E-03 2.7E-02
On Link 7.2E-02 2.0E-01 9.4E-02 2.5E-01
Stop 1.1E-03 5.0E-03 2.4E-03 5.6E-03
Total Public 7.8E-02 3.9E-05 2.3E-01 1.1E-04 1.1E-01 5.3E-05 2.8E-01 1.4E-04
Accident
Rural 1.5E-08 7.7E-12 2.2E-07 1.1E-10 6.7E-08 3.3E-11 1.3E-07 6.7E-11 Suburban 2.0E-07 1.0E-10 1.9E-06 9.5E-10 6.0E-07 3.0E-10 1.3E-06 6.6E-10 Urban 4.2E-07 2.1E-10 1.5E-06 7.4E-10 6.0E-07 3.0E-10 1.2E-06 6.2E-10 Acc. Total 6.4E-07 3.2E-10 3.6E-06 1.8E-09 1.3E-06 6.4E-10 2.7E-06 1.3E-09 Acc. Ingest. 3.7E-08 1.9E-11 7.1E-07 3.5E-10 1.3E-07 6.3E-11 4.2E-07 2.1E-10
20 Year Cooled Spent Fuel
Routine
Crew 6.5E-02 2.6E-05 2.8E-01 1.1E-04 1.3E-01 5.1E-05 3.1E-01 1.2E-04 Off Link 5.4E-03 2.4E-02 9.5E-03 2.7E-02
On Link 7.2E-02 2.0E-01 9.4E-02 2.5E-01
Stop 1.1E-03 5.0E-03 2.4E-03 5.6E-03
Total Public 7.8E-02 3.9E-05 2.3E-01 1.1E-04 1.1E-01 5.3E-05 2.8E-01 1.4E-04
Accident
Rural 1.2E-08 6.1E-12 1.8E-07 8.9E-11 5.3E-08 2.7E-11 1.1E-07 5.3E-11 Suburban 1.6E-07 8.0E-11 1.5E-06 7.6E-10 4.8E-07 2.4E-10 1.1E-06 5.3E-10 Urban 3.4E-07 1.7E-10 1.2E-06 5.9E-10 4.8E-07 2.4E-10 9.9E-07 4.9E-10 Acc. Total 5.1E-07 2.6E-10 2.9E-06 1.4E-09 1.0E-06 5.1E-10 2.2E-06 1.1E-09 Acc. Ingest. 1.4E-08 7.2E-12 2.7E-07 1.4E-10 4.8E-08 2.4E-11 1.6E-07 8.1E-11
Vehicle Related Fatality
Risk 1.9E-04 9.4E-05 3.5E-05 2.0E-04
The data presented are in the range of previous transportation risk studies. The
estimated latent cancer fatality risk is similar to the vehicle related fatality risk (round
trip). Again, the vehicle related fatality risk is slightly higher for the Diablo Canyon
route because the truck fatality rate in California is several orders of magnitude higher
than the other states where transportation occurs. Note the risk presented by routine
transportation is the same for both the 3 year and 20 year cooled spent nuclear fuel. This
transport vehicle (49 CFR 173 and 10 CFR 71) was used for the analysis. It is common
to use the dose rate limit rather than adjust for the true lower dose rate created by 20 year
cooled spent fuel, ensuring regulatory compliance and adding a level of conservatism.
The latent cancer fatality risk due to accident is significantly below that for
routine transportation. This is due to the low probability of an accident occurring that can
create a radiological release of material. The estimated accident ingestion risk values are
presented here only for completeness. If an accident were to occur, the agricultural
products and soil would be destroyed or cleaned before being reintroduced into the food
chain. Thereby reducing the ‘accident ingestion’ risk value to near zero.
The rail transportation risk values estimated with the RADTRAN program are
listed in Table 3.3.
Table 3.3: Estimated rail transportation risk values
Diablo Canyon, CA Millstone, CT Trojan, OR Turkey Point, FL
Dose Risk person-rem LCF Risk Dose Risk person-rem LCF Risk Dose Risk person-rem LCF Risk Dose Risk person-rem LCF Risk
3 Year Cooled Spent Fuel
Routine
Crew 2.1E-02 8.6E-06 7.3E-02 2.9E-05 3.8E-02 1.5E-05 7.8E-02 3.1E-05 Off Link 6.3E-03 2.1E-02 1.5E-02 3.6E-02
On Link 8.5E-04 2.6E-03 1.5E-03 3.2E-03
Stop 1.5E-02 3.8E-02 2.9E-08 6.6E-02
Total Public 2.3E-02 1.1E-05 6.2E-02 3.1E-05 1.6E-02 8.1E-06 1.1E-01 5.3E-05
Accident
Rural 8.3E-08 4.2E-11 2.4E-06 1.2E-09 4.5E-07 2.2E-10 7.9E-07 3.9E-10 Suburban 1.7E-06 8.4E-10 2.0E-05 1.0E-08 6.2E-06 3.1E-09 1.3E-05 6.5E-09 Urban 5.5E-06 2.7E-09 2.4E-05 1.2E-08 8.7E-06 4.4E-09 1.3E-05 6.4E-09 Acc. Total 7.2E-06 3.6E-09 4.7E-05 2.3E-08 1.5E-05 7.7E-09 2.6E-05 1.3E-08 Acc. Ingest. 4.2E-07 2.1E-10 1.4E-05 7.2E-09 1.5E-06 7.5E-10 5.0E-06 2.5E-09
20 Year Cooled Spent Fuel
Routine
Crew 2.1E-02 8.6E-06 7.3E-02 2.9E-05 3.8E-02 1.5E-05 7.8E-02 3.1E-05 Off Link 6.3E-03 2.1E-02 1.5E-02 3.6E-02
On Link 8.5E-04 2.6E-03 1.5E-03 3.2E-03
Stop 1.5E-02 3.8E-02 2.9E-08 6.6E-02
Total Public 2.3E-02 1.1E-05 6.2E-02 3.1E-05 1.6E-02 8.1E-06 1.1E-01 5.3E-05
Accident
Rural 4.1E-08 2.1E-11 1.2E-06 6.0E-10 2.2E-07 1.1E-10 3.9E-07 1.9E-10 Suburban 8.3E-07 4.2E-10 9.9E-06 5.0E-09 3.1E-06 1.5E-09 6.4E-06 3.2E-09 Urban 2.7E-06 1.4E-09 1.2E-05 6.1E-09 4.3E-06 2.2E-09 6.3E-06 3.1E-09 Acc. Total 3.6E-06 1.8E-09 2.3E-05 1.2E-08 7.6E-06 3.8E-09 1.3E-05 6.6E-09 Acc. Ingest. 1.7E-07 8.4E-11 5.7E-06 2.8E-09 5.9E-07 2.9E-10 2.0E-06 1.0E-09
Vehicle Related Fatality
The data for the rail transportation risk analysis are similar to the truck data. The
estimated latent cancer fatality risk is below the vehicle related fatality risk (round trip).
The rail and truck transport modes have similar vehicle related fatality rates, typically in
the low 10-8 fatalities per vehicle-km. However, shipment by rail usually involves a
further travel distance and a ‘cushion’ car is required by regulations, both in front and
behind the SNF shipment car. This automatically raises the vehicle related fatality risk
by a factor of three. Again, latent cancer fatality risk is higher for routine rail transport
compared against rail accident latent cancer fatality risk. Notice that the risk of a cancer
4 Sabotage
Risk
4.1 Introduction
Study of a successful sabotage attack is somewhat different from incident-free or
accident related transportation analysis. For a sabotage attack, there is no probability of
occurrence. For this work, the sabotage related risk is based on the assumption that a
successful sabotage attack has occurred. This shifts the unknown data from the chance of
occurrence and amount of damage (as in an accident scenario) to only the amount of
damage (or amount of radiological material released) due to the sabotage attack.
Review of both experimental tests and shipping cask analyses suggest that a
substantial sabotage event is required to breach the shipping cask. The experimentally
tested method of sabotage attack which could breach the shipping cask was a direct hit
from a high energy density device [Luna, 1999]. This HEDD is similar to a large military
anti-tank projectile or shape charge. It is expected that fatalities will result directly from
a sabotage attack (not related to radiological material) in an urban area, however this
work will not address this issue.
The risk addressed in this work focuses on the fatalities that may result from
exposure to radiological material after a successful sabotage attack. This will occur if
radiological material is released from confinement in the shipping cask. The amount of
released radiological material used in this study is taken from experimental sabotage
studies on actual shipping casks. The respirable release fractions from a truck and rail
Table 4.1: Estimated release fraction for each physical-chemical group
Physical-Chemical
Group HEDD 1 Attack HEDD 2 Attack
Truck Rail Truck Rail Co-60 (crud) 7.5E-05 1.3E-06 9.1E-06 4.7E-08
Radiocesium 1.0E-03 1.7E-05 1.4E-04 7.2E-07 Noble Gas 2.0E-02 4.0E-04 6.2E-03 3.9E-05
Matrix (particulates)
1.2E-04 3.1E-06 1.8E-05 2.3E-07
Values are suggested average, based on surrogate-to-true fuel material conversion factor of 3.
These release fractions were compared against previous source term experimental
work in Germany [Luna, 2000] [Pretzsch, 1994]. The experimental results were found to
be consistent. An uncertainty factor of approximately 2 for the release fractions listed in
Table 4.1 has been suggested. The release fractions are based on a conversion factor of 3
when converting data from the experimental surrogate cask content material to spent
nuclear fuel materials. This conversion factor is believed to be conservative but could
range from 1 to 12 [Luna, 2001].
4.2 Sabotage Model Verification
The estimated dose and resulting cancer fatality for the models used in this work
compared to previous studies, using similar input data, are listed in Tables 4.2 and 4.3 for
truck and rail casks, respectively. This helps verify the sabotage scenarios in this work
for both the RADTRAN and RISKIND models. Spent nuclear fuel transportation
sabotage analysis results for a selected route can be compared to the spent nuclear fuel
transportation incident-free and accident analysis results, as well as accident and sabotage
Table 4.2: Summary of truck sabotage analysis from various studies
Population Exposure Maximum Exposed Individual
Truck
Total Dose person-rem Latent Cancer Fatalities Acute Dose Person-rem Acute Cancer Fatalities TotalDose rem (dist) Increased Cancer Risk YMEISMax. Accident 1.1E+03 0.6 -- -- 3 (150m) --
YMEIS
Sabotage Event 9.6E+04 48.0 -- -- 110 6%
RWMA 3.1E+04 15.0 -- -- 67 (150m) 7%
RADTRAN Code 9.2E+04 46.0 -- -- -- --
RISKIND Code 6.7E+04 33.3 6.2E+04 0 -- --
50% Stability a 5.7E+04 28.5 5.5E+04 0 -- -- 95%Stability a 1.1E+05 54.2 1.1E+05 0 -- -- 150 m -- -- 121 0 126 (150m) 13% 150 m Respirator -- -- 2.7 0 3.35 (150m) 0.17% 330 m -- -- 45.1 0 47 (330m) 4.70%
Shaded region represents new analysis for this paper.
a) Atmospheric stability. Stability is classified as ‘neutral’ throughout table, unless otherwise stated.
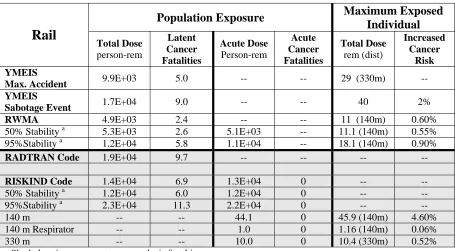
Table 4.3: Summary of rail sabotage analysis from various studies
Population Exposure Maximum Exposed Individual
Rail
Total Dose person-rem Latent Cancer Fatalities Acute Dose Person-rem Acute Cancer Fatalities TotalDose rem (dist) Increased Cancer Risk YMEISMax. Accident 9.9E+03 5.0 -- -- 29 (330m) --
YMEIS
Sabotage Event 1.7E+04 9.0 -- -- 40 2%
RWMA 4.9E+03 2.4 -- -- 11 (140m) 0.60%
50% Stability a 5.3E+03 2.6 5.1E+03 -- 11.1 (140m) 0.55% 95%Stability a 1.2E+04 5.8 1.1E+04 -- 18.1 (140m) 0.90%
RADTRAN Code 1.9E+04 9.7 -- -- -- --
RISKIND Code 1.4E+04 6.9 1.3E+04 0 -- --
50% Stability a 1.2E+04 6.0 1.2E+04 0 -- -- 95%Stability a 2.3E+04 11.3 2.2E+04 0 -- -- 140 m -- -- 44.1 0 45.9 (140m) 4.60% 140 m Respirator -- -- 1.0 0 1.16 (140m) 0.06% 330 m -- -- 10.0 0 10.4 (330m) 0.52%
Shaded region represents new analysis for this paper.
The ‘YMEIS Maximum Foreseeable Accident’ was used in the past to estimate
the results of a sabotage event [DOE, 2002]. The maximum foreseeable accident is no
longer used and is shown here for completeness only. The RWMA data, based on the
Draft YMEIS, needs to have a factor of approximately 2 – 3 increase to correctly
compare against the other studies [Halstead, 2000]. This is required to correct for a
difference in the initial cask contents and the estimated population density.
The population total dose data show that for a truck or rail sabotage attack, the
data agree well between the YMEIS Sabotage, RWMA (corrected by 3), and the
RADTRAN and RISKIND data from this study. The truck and rail maximally exposed
individual (MEI) data also agree well across the YMEIS Sabotage, RWMA (corrected by
2-3), and the RADTRAN and RISKIND data from this study. This demonstrates the
models are established well enough to begin a further detailed analysis of a sabotage
event.
The increased risk (above natural levels) of developing a latent cancer fatality is
shown for MEI’s. Notice the increased cancer risk is not significantly high compared to
common public belief. Of interest is the acute dose data (central column) comparison to
the total MEI dose data. This shows the vast majority of radiation exposure occurs in the
short time period during and immediately following the radiation cloud passage. Data is
shown for a MEI following a successful truck sabotage at 150 m and a rail sabotage at
140 m, both with and without a respirator. The respirator was modeled by reducing the
atmospheric air breathing rate down to 2.25% of normal. This clearly shows the
4.3 Sabotage vs. Transportation Risk
Table 4.4 lists the incident-free, accident, and successful sabotage estimated dose
risk and resulting cancer fatalities for the Diablo Canyon, CA route for both truck and rail
transportation modes. Interestingly the risk due to sabotage on a truck cask is higher than
sabotage on a rail cask. This is opposite of an accident event where the rail cask presents
a higher risk than the truck cask. The detrimental health impact of a successful sabotage
attack is quite dependent on the population density at or in the near downwind direction
of the attack location.
Table 4.4: Transportation risk summary for the Diablo Canyon, CA route
Truck Rail Truck Sabotage Rail Sabotage
Dose Risk
person-rem LCF Risk
Dose Risk person-rem LCF Risk Dose person-rem LCF Dose person-rem LCF
3 Year Cooled Spent Fuel
Routine
Crew 6.5E-02 2.6E-05 2.1E-02 8.6E-06 Off Link 5.4E-03 6.3E-03
On Link 7.2E-02 8.5E-04
Stop 1.1E-03 1.5E-02
Total Public 7.8E-02 3.9E-05 2.3E-02 1.1E-05
Accident
Rural 1.5E-08 7.7E-12 8.3E-08 4.2E-11 5.19E+02 2.6E-01 7.3E+01 3.6E-02 Suburban 2.0E-07 1.0E-10 1.7E-06 8.4E-10 2.8E+04 1.4E+01 6.5E+03 3.2E+00 Urban 4.2E-07 2.1E-10 5.5E-06 2.7E-09 1.2E+05 6.2E+01 2.7E+04 1.3E+01 Acc. Total 6.4E-07 3.2E-10 7.2E-06 3.6E-09
20 Year Cooled Spent Fuel
Routine
Crew 6.5E-02 2.6E-05 2.1E-02 8.6E-06 Off Link 5.4E-03 6.3E-03
On Link 7.2E-02 8.5E-04
Stop 1.1E-03 1.5E-02
Total Public 7.8E-02 3.9E-05 2.3E-02 1.1E-05
Accident
Rural 1.2E-08 6.1E-12 4.1E-08 2.1E-11 3.8E+02 1.9E-01 5.3E+01 2.6E-02 Suburban 1.6E-07 8.0E-11 8.3E-07 4.2E-10 2.1E+04 1.0E+01 4.7E+03 2.3E+00 Urban 3.4E-07 1.7E-10 2.7E-06 1.4E-09 9.2E+04 4.6E+01 1.9E+04 9.7E+00 Acc. Total 5.1E-07 2.6E-10 3.6E-06 1.8E-09
Vehicle Related Fatality
Risk 1.9E-04 1.8E-04
However, notice the largest public risk component for routine transportation is
on-link (on-road travelers) for truck transport and rail stops (any public near stop area) for
at night), rather than routing through low population zones, may help reduce routine
public risk. Similarly for rail cask shipment, the use of dedicated trains, with few stops
and a smaller crew, would reduce exposure risk better than routing through a low
5 Sabotage Attack Parameter Investigation
5.1 Introduction
A sensitivity study was performed to discover the primary parameters that affect
the risk presented following a successful sabotage attack. This will allow a parametric
study to be performed on several of the sensitive parameters. The parametric study
should allow a general bound for the risk presented by a sabotage attack. This can then
be compared against a possible sabotage attack on hazardous materials or against a
radiological dispersal device.
5.2 Sensitivity Study
Table 5.1 lists the results of a sensitivity study performed using the RISKIND
code for a possible sabotage event on a truck cask containing three PWR, three year
cooled, spent nuclear fuel assemblies. The RISKIND code was developed at Argonne
National Laboratory (ANL) to analyze potential radiological health consequences [Yuan,
1995]. RISKIND was developed to address local aspects, scenario specific, and accident
events. A 10% increase (10% decrease for ‘Fraction Respirable’) to the listed input
Table 5.1: Summary of truck sabotage sensitivity study to 10% change in input
Sensitivity Study for
10% change in input Base Case
Total Dose % Change Acute Dose % Change Variable Range
Atmospheric Stability D Significant A – F
Diffusion Parameters --- Significant Flat Terrain, Urban
Downwind Distance (km) --- Significant 0.2 – 80
Fuel Age (yr) 3 yr cooled Minimal 3 yr, 20 yr Rainfall Rate (mm/hr) 0.0 Minimal 0.0 – 7.0
Respirable Fraction 1.0 0.9 0.9 0.0 – 1.0
Release Fraction (/cask content) HEDD 1 1.10 1.10 HEDD 1
Particulates 1.20E-04 1.07 1.10 0 - 4.0E-5 - 4.8E-4 Cs, Ru 1.00E-03 1.01 1.00 0 - 3.3E-4 - 4.0E-3 Crud 7.50E-05 1.00 1.00 0 - 2.5E-5 - 3.0E-4 Noble Gas 2.00E-02 1.00 1.00 0 - 6.7E-3 - 8.0E-2
Population Density (/km2) 2823 1.10 1.10 400 – 8000
Breathing Rate (m3/yr) 8000 1.07 1.10 5000 – 20000
Wind Speed (m/s) 4 0.94 0.94 0.2 – 8
Particle Deposition Vel. (m/s) 0.01 1.01 0.96 0 – 0.1 Resuspension (1/m) 1.00E-05 1.02 1.00 --- Decay Time (yr) 0.137 1.02 1.00 --- Heated Release (cal/s) 5.00E+02 1.00 1.00 5E+02 – 2E+10 Atmosphere Mixing Height (m) 1000 1.00 1.00 400 – 2000 Ambient Temperature (°K) 283 1.00 1.00 255 – 310 Short Term Exposure (hr) 2 1.00 1.00 0.5 – 24 Total Exposure Time (yr) 50 1.01 1.00 1, 20, 50
The truck cask was selected because it presented a larger fatality risk over a rail
cask sabotage. The input values used for the ‘base case’ are listed. The atmospheric
stability, diffusion parameters, downwind distance, fuel age, and rainfall rate are listed at
the top of Table 5.1 because they were believed to have a significant impact on the
radiation exposure but were not evaluated with a single change sensitivity calculation.
These parameters were each investigated with parametric studies.
The practical range considered for each input is listed on the far right of Table 5.1.
Note the release fraction ranges are based on experimental data for the HEDD1 sabotage
device described in Luna, 1999. Table 5.1 shows that only a handful of inputs
5.3 Study of Key Parameters
5.3.1 Atmospheric Stability
Atmospheric stability describes the state of atmospheric conditions which control
the dispersion of a radioactive plume. Pasquill stability classes range from A – F for
highly unstable to highly stable conditions, respectively [Faw, 1999]. Figure 5.1 shows
the impact of changes in atmospheric stability, using a Gaussian model Pasquill-Gifford
diffusion parameters for flat terrain [Eimutis, 1972], for individuals located at select
distances directly downwind of a sabotage attack.
Individual Acute Dose vs Distance
Impact of Atmospheric Stability Class (Flat Terrain)
0 20 40 60 80 100 120 140 160 180 200
0.1 1 10 100
Distance [km]
Do
se [
rem
]
Base (D)
Class A
Class B
Class C
Class E
Class F
Figure 5.1: Impact of atmospheric stability on a sabotage attack (flat terrain)
A Class D (neutral) atmospheric stability condition was used for the base case.
data is available. Class D clearly presents the greatest risk to an individual near the
sabotage site. For less stable air (Class A- C) the dose is significantly reduced. Under
these conditions, the plume can readily disperse and settle the radioactive particles out of
the plume. For more stable air (Class E – F) the radiation dose near the sabotage site is
reduced. However, the plume remains well formed much longer which allows a large
portion of the radioactive cloud to be carried down range by the prevailing wind. This
raises the possible radiation dose out near 1 km.
Figure 5.2 shows the impact of changes in atmospheric stability, using a Gaussian
model Briggs diffusion parameters for urban terrain [Briggs, 1974], for individuals
located at select distances directly downwind of a sabotage attack. It can be seen that the
urban diffusion parameters have approximately a factor of 2 reduction on the radiological
dose resulting from a successful sabotage attack.
Individual Acute Dose vs Distance
Impact of Atmospheric Stability Class (Urban Terrain)
0 20 40 60 80 100 120 140 160 180 200
0.1 1 10 100
Distance [km]
Dos
e
[r
em]
Base (D) Briggs
Class A-B Briggs
Class C Briggs
Class E-F Briggs
5.3.2 Rainfall Rate
It is common for many atmospheric transport studies to neglect the effect of
rainfall. This often presents a conservative case when looking at the airborne radiation
exposure. When looking at routes, such as Trojan, OR or Turkey Point, FL to Yucca
Mountain, NV, rainfall should be expected for segments of the route during portions of
the year. Figure 5.3 show the effect of rainfall rates on radiation dose for individuals
located at select distances directly downwind of a sabotage attack.
Individual Acute Dose vs Distance Impact of Rainfall
0 20 40 60 80 100 120 140 160 180 200
0.1 1 10 100
Distance [km] Do s e [r em] Base (0)
Rain 1 mm/hr = 0.94 in/day
Rain 3 mm/hr = 2.83 in/day
Rain 7 mm/hr = 6.61 in/day
Base Briggs (0)
Rain Briggs 1 mm/hr = 0.94 in/day
Rain Briggs 3 mm/hr = 2.83 in/day
Rain Briggs 7 mm/hr = 6.61 in/day
Flat Terrain:
Pasquill-Gifford Parameters
Urban Terrain: Briggs Parameters
Figure 5.3: Impact of rainfall rate on a sabotage attack
The rainfall rate directly reduces the radiation dose at a given location. The effect
atmospheric stability class. It is easy to see why neglecting rainfall is a common
occurrence for most transportation risk analysis for routine, accident, and sabotage events.
5.3.3 Wind Speed
Wind speed is modeled in this analysis as a constant value although it is a highly
variable parameter. Wind speed can have a wide range of inputs from near zero to
extremely large values during storms (~27 m/s or ~60 mph). This study considered only
the most frequent wind speeds encountered. It is necessary to keep the wind speed up
near 1 m/s for proper model application. This study considered wind speeds up to 7 m/s
(~15.6 mph) although higher wind speeds commonly occur. Figures 5.4 and 5.5 show the
effect of wind speed on radiation dose for individuals located at select distances directly
downwind of a sabotage attack over flat and urban terrain, respectively.
Individual Acute Dose vs Distance Impact of Wind Speed (Flat Terrain)
0 50 100 150 200 250 300
0.1 1 10 100
Distance [km]
Dose
[r
e
m
]
Base (4 m/s = 8.95 mph)
Wind 1 m/s = 2.24 mph
Wind 2 m/s = 4.48 mph
Wind 3 m/s = 6.71 mph
Wind 6 m/s = 13.42 mph
Wind 7 m/s = 15.67 mph
As the wind speed increases the radiation dose to individuals near the sabotage
attack becomes less. This is due to the reduced time the individual is engulfed in the
passing radioactive cloud. The data point for the radiation dose at 0.150 km downwind
over flat terrain for the 1 m/s wind speed is somewhat curious. It is believed that such
low wind speeds over flat terrain the diffusion process is allowed sufficient time to
reduce the airborne concentration at the downwind distance.
Individual Acute Dose vs Distance Impact of Wind Speed (Urban Terrain)
0 50 100 150 200 250 300
0.1 1 10 100
Distance [km]
Dose
[r
e
m
]
Base Briggs (4 m/s = 8.95 mph)
Wind Briggs 1 m/s = 2.24 mph
Wind Briggs 2 m/s = 4.48 mph
Wind Briggs 3 m/s = 6.71 mph
Wind Briggs 6 m/s = 13.42 mph
Wind Briggs 7 m/s = 15.67 mph
Figure 5.5: Impact of wind speed on a sabotage attack (urban terrain)
5.3.4 Release Fraction
The release fraction, by definition, creates the radiological source term that is
shipping cask. For this reason, the release fraction data is often of interest when
considering accident or sabotage events during spent nuclear fuel transportation. The
respirable release fraction is the parameter of interest. Respirable refers to particulate
material sufficiently small that it can be inhaled into human lungs (approximately < 5µm).
The importance of inhaled radioactive material was demonstrated in Table 4.2.
The variation in the respirable release fraction created by a sabotage attack was
addressed by developing a bounding region due to the uncertainty in the surrogate to
spent fuel conversion factor used in the experimental tests. This bounded region was
defined by replacing the suggested conversion factor of 3 (used for the base case release
fractions of Table 4.1) with the experimental minimum and maximum values of 1 and 12,
respectively. Table 5.2 lists these bounded minimum and maximum release fractions
created from a HEDD1 sabotage attack for each material type along with other data of
interest. This bounded release fraction creates a bounded MEI dose region,
approximately a factor of 4 above and a factor of 3 below the average value. Notice this
bounded release fraction region is valid for all atmospheric stability classes and
downwind distances.
Table 5.2: Bounded region of release fraction and resulting consequences
Physical-Chemical Group Minimum Average Maximum Co-60 (crud) 4.33E-07 1.3E-06 5.20E-06
Radiocesium 5.66E-06 1.7E-05 6.80E-05
Noble Gas 1.37E-04 4.0E-04 1.64E-03 Matrix (particulates) 1.03E-06 3.1E-06 1.24E-05 Consequences
MEI @ 118 m [rem] 4.2 12.4 49.2
Figure 5.5 shows the range of estimated dose for individuals located at select
distances downwind of a sabotage attack. The effect of the factor of 4 above and factor
of 3 below the average release fraction is clearly seen. Note that for the maximum
release fraction for the HEDD1 device has created a dose that can create a fatality due to
acute radiation exposure. This has not happened anywhere in the study up to this point.
The HEDD1 device is considered the upper limit to how effective a sabotage attack
device could be. The HEDD2 device is considered to create release fractions that are
more practical under a real sabotage attack. As Figure 5.5 shows, this significantly
reduces the effectiveness of a sabotage attack to create fatalities.
5.3.5 Additional Parameters
The sensitivity study found that the breathing rate and population density were
also parameters of interest for a sabotage attack. The deposition velocity of radioactive
particulates was also found to have a slightly less important affect. The population
density is quite easily understood. The population density would not affect the estimated
radiation dose for an individual at a given location and would simply linearly increase the
number of exposed people and thus the estimated number of possible latent cancer
fatalities. The breathing rate also has a straight forward linear affect on the amount of
inhaled dose a person receives.
The deposition velocity of particulate material affects the rate at which
radioactive particles settle out of the air and deposit onto the ground [Hinds, 1999]. The
particle size has an impact on the dose conversion factor (DCF). The dose conversion
factor, which is not shown in the sensitivity study, is used to estimate the amount of
radiation dose an individual receives from a given level of radiation exposure. The
particle size controls how easily a radioactive particle is inhaled or attached to the lung
surface. The RISKIND code is not able to accurately model wide ranges in the particle
size (or deposition velocity) or DCF. The RISKIND code assigns inhalation DCF’s
independent of the particle size and breathing rate.
5.3.6 Dose Conversion Factor
The release fractions resulting from a sabotage attack are commonly debated in
literature. However, parameters such as the DCF and the breathing rate are rarely
variability against the variability of the release fraction for the HEDD1 sabotage device
will be used to illustrate the relative importance of each parameter.
With the bounded region of the respirable release fraction determined earlier, a
triangular distribution was defined for the release fractions of each material type, listed in
Table 5.2. This triangular release fraction distribution applied to the point estimate model
calculations will result in a triangular dose and cancer risk distribution with minimum,
mode, and maximum values of approximately the values in Table 5.2.
A variability distribution was defined for the human inhalation rate and the dose
conversion factor. The inhalation rate uncertainty distribution was taken from the
RESRAD 6.21 radioactivity decontamination code. The DCF uncertainty distribution
was taken from the National Council on Radiation Protection and Measurement Report
No. 126 [NCRP 1997]. Table 5.3 lists the distribution for the inhalation rate and DCF,
including the initial value used for the sensitivity study [Yuan, 1995]. These variability
distributions were analyzed using the @RISK statistical software.
Table 5.3: Inhalation rate and DCF variability distribution
Human Inhalation Rate [m3/yr] Uncertainty
Distribution Type Minimum Mode Maximum Initial Value Triangular 4.38E+03 8.39E+03 1.31E+05 8.00E+03
Dose-Effect Conversion Factor (DCF) [cancer risk/rem]
Uncertainty Distribution Type
Geometric Mean
Geometric Standard Deviation
Mode Initial Value
Lognormal 3.38E-04 1.83 2.36E-04 5.00E-04
Several combinations of distributions were made to illustrate the relative
release fraction was set to the average release fractions listed in Table 5.2 with no
uncertainty distribution while the inhalation rate and DCF were assigned the distributions
in Table 5.3. This provides a probability distribution for the increased fatal cancer risk
based on the inhalation rate and DCF distributions. For case II, release fractions,
inhalation rate, and DCF were assigned the uncertainty distributions listed in Table 5.2
and Table 5.3, respectively. This provides a probability distribution for the increased
fatal cancer risk based on all three distributions. A summary of statistics for each case
are listed in Table 5.4.
Table 5.4: Statistics for the increased fatal cancer risk
Case I: Point Estimate Release Fraction
Case II: Triangular Distribution Release Fraction Statistic Fatal Cancer Risk [rem-1] Fatal Cancer Risk [rem-1]
Minimum 3.11E-04 1.70E-04
Maximum 7.66E-02 5.29E-02
Mean 7.10E-03 5.73E-03
Standard Deviation 5.73E-03 4.49E-03
Variance 3.28E-05 2.02E-05
Skewness 2.03 2.42
Kurtosis 11.8 13.7
Mode 1.18E-03 2.68E-03
5% Percentile 1.15E-03 1.32E-03
95% Percentile 1.79E-02 1.43E-02
Each case was performed using Latin Hypercube sampling with 5,000 iterations.
The probability distribution for the excess cancer risk is shown for both cases in Figure
Figure 5.7: Excess cancer risk for point estimate (Case I) and triangular distribution (Case II) of the release fraction
The data analysis shows that the variability of the dose conversion factor is of the
same importance as the variability of the respirable release fraction created in the
sabotage attack. The inhalation rate does have some effect on the increased cancer risk
but to a much less extent than the dose-effect conversion factor. This demonstrates that
the often over dramatized potential for release from a sabotage attack may not be the
single or dominant variable which should receive detailed consideration.
5.4 Sabotage Conclusion
Notice this study accepted that the sabotage event has occurred. This study, like
any other study of a sabotage event, must be considered with care. This study is based
entirely on the release fractions determined from earlier analytical and experimental work
which were for specific HEDD or other sabotage devices. If different sabotage events
occur on different radioactive targets, then there may be changes in the estimated release
fractions which directly change the effects on the maximally exposed individual,
based on numerous inputs that could have a significant effect on the cancer risk make
careful understanding and application of these inputs essential.
A few examples of important parameter variability which were not mentioned in
this sensitivity study include: package contents, exposure time, or different cask designs
and sizes. There have been studies on this topic. A detailed literature search is
recommended before any serious detailed analyses are performed or the analysis results
6 Practical
Perspectives
6.1 Hazardous Material Transportation Comparison
Transportation of other hazardous materials, such as chemicals and gases, present
an immediate risk to the general public due to the close proximity of passenger vehicles,
residential and commercial areas, and large number of hazardous material shipments
[Volpe, 1996]. For example, consider the tens of thousands of gasoline tanker truck
deliveries each day in the United States.
Table 6.1 compares the results of an accident or sabotage event for chlorine gas,
liquefied petroleum gas (LPG), and spent nuclear fuel for the urban population density
(2823 people/km2) estimated for the Diablo Canyon, CA truck route. Chlorine and LPG
are commonly used to represent other dangerous commodities with similar properties
[Saccomanno, 1989]. Chlorine is used as a surrogate for other highly toxic, heavier than
air gases. Most bulk, ~90 ton, chlorine shipments take place on rail. Chlorine shipments
by truck are usually ~27 ton. LPG serves as a surrogate for other highly flammable,
potentially explosive pressure liquefied gases. LPG is commonly shipped in tankers with
a capacity of ~63.5 ton for rail and ~18 ton for truck. As before, the spent nuclear fuel is
three years cooled and contains 3 PWR and 24 PWR assemblies for the truck and rail