APPLICATION OF THE ASME CODE SEC III PRESSURE
REQUIREMENTS ON TIGHT RADIUS OUT-OF-ROUND PIPE BENDS
Usama Abdelsalam1, Heather Taylor2, Andrew Glover3, Dk Vijay4, and Parichit Bagga5
1 Technical Expert, AMEC NSS Ltd, Power & Process Americas, Toronto, Ontario, Canada ([email protected]) 2 Senior Technical Specialist, Component and Program Engineering Department, Bruce Power, Tiverton, Ontario, Canada 3 Senior Technical Engineer, Nuclear Safety Analysis & Support Department, Bruce Power, Toronto, Ontario, Canada 4 Section Manager, AMEC NSS Ltd, Power & Process Americas, Toronto, Ontario, Canada
5 Analyst, AMEC NSS Ltd, Power & Process Americas, Toronto, Ontario, Canada
ABSTRACT
This paper deals with the internal pressure requirements of the ASME Code SEC III NB-3600 (Piping Design) and NB-3200 (Design by Analysis) applied to the fitness for service assessment of tight radius pipe bends. It is demonstrated that the linear elastic criteria of NB-3221 leads to overly conservative results when bend ovality is considered in a detailed FEA model (up to 65% higher stresses). Limit analysis provides a less conservative alternative but the ASME Code does not provide a direct link for the use the NB-3228.1 limit analysis to establish thickness requirement for pressure loading in particular. Therefore the need arises for an approach to handle pipe bends ovality in a more realistic way following the linear elastic approach of NB-3221. Since the pressure loading is expected to produce plastic collapse type of failure, it is appropriate to use the limit analysis to determine the ovality effect by evaluating the change in the plastic collapse load due to a specific ovality. For the particular case considered in this paper, it is demonstrated that the collapse load with the ovality modeled is 5% lower than that with the perfectly round case. The calculated ovality effect is used along with the linear elastic FEA results from a perfectly round pipe to check the criteria of NB-3221 leading to a significant life extension of the analyzed feeder pipe bends.
INTRODUCTION
Nuclear piping systems experience general and/or local wall thinning during operation under flow accelerated corrosion (FAC) favorable conditions. Even though the ASME Code SEC III is a construction code, it is often used to perform fitness for service assessments to demonstrate the structural integrity of thinned pipes with life extension and outage scheduling benefits.
The pressure requirement in the ASME Code SEC III protects against the catastrophic collapse of the designed components due to a single application of the primary load. The basic criterion for internal pressure loading under the NB-3600 “Piping Design” rules is given in NB-3640 “Pressure Design”. This criterion is applicable for straight pipe segments as described in NB-3641.1 and the wall thickness calculated is called the pressure-based thickness, tmin. For curved pipe segments, NB-3642.1 “Pipe Bends”
states that “the wall thickness for pipe bends shall be determined in accordance with NB-3641 (Straight
Pipe) subject to three limitations (a), (b), and (c) below
(a) The wall thickness after bending shall not be less than the minimum wall thickness required for straight pipe.
(b) The information in Table NB-3642.1(b)-1 is given to guide the designer when ordering pipe. (c) For the effects of ovality on stress levels, see NB-3680.”
limitation, (c) directs the analyst to NB-3680 for the effects of ovality. However, NB-3680 does not address how to deal with ovality when it comes to the primary stress evaluation for pressure loading. This is understood considering that the Code is a construction Code dealing with well designed geometries and materials when the ovality effects are expected to be insignificant. However, when it comes to fitness for service assessments of degraded components, it becomes necessary to use detailed analysis methods that address unexpected geometry variations that require special attention. In such cases, it is important to pay attention to sources of increased stresses like ovality.
Under NB-3630 “Piping Design and Analysis Criteria” it is stated that “(c) When a design does not satisfy the requirements of NB-3640 “Pressure Design” and NB-3650 “Analysis of Piping Products” the more detailed alternative analysis given in NB-3200 or the experimental stress analysis of Appendix II may be used to obtain stress values for comparison with the criteria of NB-3200 “Design by Analysis”. The design by analysis criteria of NB-3221 requires that general primary membrane stress intensity, Pm, meet the Sm limit 3221.1), the local membrane stress intensity, PL, meet the 1.5 Sm limit (NB-3221.2), and the primary membrane (Pm or PL) plus the primary bending stress intensity, Pb, meet the 1.5 Sm limit (NB-3221.3). Lastly, the ASME SEC III NB-3221 “Design Loadings” states that the provisions of NB-3228 may provide relief from certain of these stress limits if plastic analysis techniques are applied. NB-3228.1 (Limit Analysis) provides a relief from NB-3221.1&2&3 if it can be shown by limit analysis that specified loadings do not exceed two-thirds of the lower bound collapse load. However,
NB-3228.1 also states that “the design shall satisfy the minimum wall thickness requirements”. This last
statement sends the designer/analyst back to the linear elastic domain. Hechmer (2000) stated “To allow plastic analysis to supersede the elasticity definition of the minimum shell thickness, additional rules and a basis for them must be developed”. Therefore, until then, there is a need to establish an approach to handle pipe bend ovality under the linear elastic criteria when dealing with degraded geometries like wall thickness loss as considered in this study.
The ASME Code SEC III, being a construction code, does not provide explicit guidance as to how to deal with locally thinned areas (LTA). SEC XI Code Case N-597-2 of the ASME Code provides evaluation procedures and acceptance criteria to justify continued operation of Class 1, 2 & 3 piping items subject to wall thinning. Scarth et. al (2006) provided description of the Code Case technical bases and validation against experimental and historic wall thinning effects. Hasegawa, K. et. al (2009) presented validation for these procedures by comparing with field rupture data and pipe burst test data. The plastic failure mechanism in a locally thinned straight cylinder using the finite element method is explored by Reinhardt and Zobeiry (2009). Double tight radius bends with general and local wall thinning are analyzed using idealized wall thickness profiles implemented in detailed finite element models by Abdelsalam and Vijay (2009). In these analyses, pressure loading assessments of typical CANDU feeder pipe bends are performed according to the ASME Code SEC III NB-3221 criteria. These feeder pipes are made of Low Carbon Steel Grade B. The detailed modeling of the local thin area is achieved through smooth bounding axial and circumferential thickness profiles based on the measured thickness data. The concept of a location dependent thinning rate function is later on introduced by Abdelsalam and Vijay (2009 & 2010). In addition, results from elastic plastic limit analyses (NB-3228.1) are presented and compared to the results from the linear elastic rules of the ASME Code (NB-3221). Abdelsalam (2010) demonstrated the ability to qualify very thin local spots using the detailed FEA approach following the elastic rules of the ASME Code SEC III NB-3221. A tight radius pipe bend with general thinning and one locally thinned area is studied. The LTA is located on the inner surface of the bend. Results are presented for the analysis models to show the effect of the axial extension of the LTA on the life of the bend. Results from plastic limit analysis are also presented. Bend ovality effects on stresses are observed by Veerappan and Shanmugam (2008) and Xu et. al (2005). Vlaicu, D. (2008) presented a nonlinear shakedown analysis using FEA for piping bends taking into account the maximum ovality tolerance.
factor”. This ovality effect factor is used to magnify the linearized stress intensities from the case with zero ovality for comparison with the NB-3221.1&2&3 criteria.
PRELIMINARY
Geometry
The nominal piping cross-section dimensions used to build the geometric models are:
Outer Diameter, Do = 3.03 in (76.96 mm)
Nominal Thickness, tnom = 0.276 in (7.01 mm)
The bend dimensions are as follows:
Bend Angles = 73o, 70o (1st and 2nd tight radius bends)
Bend Radius, Rb = 4.5 in (114.3 mm)
Pressure Based Thickness (Straight Pipe)
The pressure based thickness, tmin, is calculated in accordance with the ASME Section III, NB-3641.1(1) as follows:
A
Py
S
PD
t
m
o
)
(
2
min (1)
Where,
P is the internal Design Pressure (1455 psig),
A is the Corrosion Allowance (not used),
Y is equal to 0.4, and
Sm is the max allowable stress intensity for the material at the design temperature (17.84 Ksi
at 605oF).
Therefore, the pressure-based thickness calculated using the above formula is, tmin = 0.124 in (3.15 mm)
Allowable Local Thickness for Pipe Bends
For pipe bend, the following equation is provided by the ASME Code SEC XI Code Case N-597-2 for the calculation of the allowable local wall thickness (taloc):
L b
aloc
R
R
t
t
cos
1
5
.
0
5
.
0
min
min
(2)where,
Rmin pipe mean radius based on tmin
Rb bend radius
ӨL Circumferential Coordinate
Therefore the required thickness for the tight radius bend in consideration is taloc =1.238 tmin (3.90 mm) on
the intrados (ӨL = 180o) and 0.878 tmin on the extrados (ӨL = 0 o).
NB-4223.2 Ovality Tolerance
The ASME Code states that “Unless otherwise justified by the Design Report, the ovality of piping after
bending shall not exceed 8% as determined by: 100* (Dmax – Dmin)/Do”
Where, Dmin & Dmax are the minimum and maximum outside diameters after bending or forming
FINITE ELEMENT ANALYSIS MODEL
Finite Element Mesh
Material Model
The numerical values for the material properties used in the analysis models are obtained from the ASME Code Section II Part D. A linear-elastic isotropic material model, using the properties of ASME material SA-106 Grade B, is used for the analysis. The material properties used are as follows:
Elastic Modulus, E = 26.45x10⁶ psi (at 605 oF)
Poisson’s Ratio, = 0.3
Allowable Stress Intensity, Sm =17.84 Ksi
Measured & Idealized Wall Thickness Profile
Thickness measurements of CANDU feeder bends are performed using a bracelet tool that has 14 probes
equally spaced along the circumference covering a 140o angle. For the intrados scan, the tool is centered
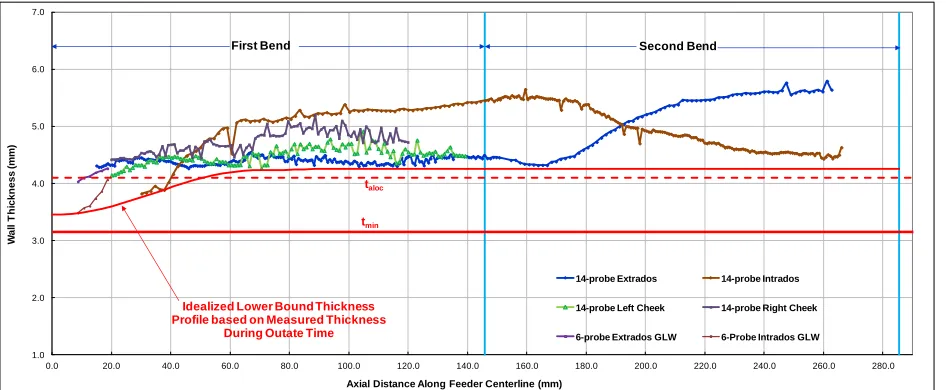
with the intrados of the tight radius bend and moved axially to cover the entire bend. Similarly, the tool is centered with the extrados, left cheek and right cheek and moved axially along the bend. Axial and circumferential idealized thickness profiles are developed ensuring a lower bound everywhere on the feeder bend considering the measured thickness data. Figure 1 illustrates the idealized axial thickness profile as a lower bound on the minimum measured thicknesses from all probes. Figure 2 shows the FEA
mesh axial thickness profile compared to the idealized bounding profile. Each point on Figure 2from the
FEA model represent the thickness measured between two corresponding nodes on the inside and outside surfaces of the tight radius bends.
Location Dependent Thinning Rate
The idealized axial and circumferential profiles at the outage time and the initial profiles are used to develop the axial and circumferential thinning rate distributions along the tight radius bend. A 7% thicker than nominal intrados and 7% thinner than nominal extrados are used to approximate the original thickness distribution. Close to the cheeks, both the intrados and extrados have original thickness equal to the nominal thickness. This increase and decrease in the initial wall thickness is consistent with data obtained from thickness measurements of inlet feeders (exhibiting insignificant thinning) and spare bends.
Projected Wall Thickness Profile at End of Evaluation Period
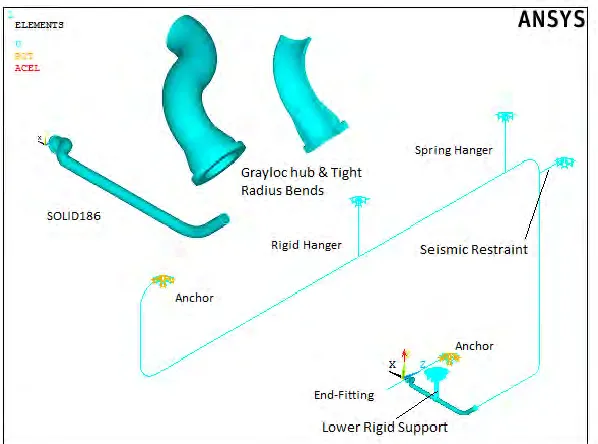
The idealized thickness profiles at the outage time are linearly projected to the end of the evaluation period using the location dependent thinning rate distributions producing the projected wall thickness idealized profile to be evaluated. Figure 3 shows the full length CANDU feeder pipe along with the supporting system (spring hanger, rigid hanger, lower rigid hanger, and seismic restraint). Close up views
of the Grayloc Hub and the 1st & 2nd tight radius bends are also included in Figure 3.
Figure 1: Axial Minimum Measured and Idealized Thickness Profiles along 1st & 2nd Tight Radius Bends
(6 & 14-probe Tools) 1.0
2.0 3.0 4.0 5.0 6.0 7.0
0.0 20.0 40.0 60.0 80.0 100.0 120.0 140.0 160.0 180.0 200.0 220.0 240.0 260.0 280.0
W
a
ll
T
h
ic
k
n
e
s
s
(
m
m
)
Axial Distance Along Feeder Centerline (mm)
14-probe Extrados 14-probe Intrados
14-probe Left Cheek 14-probe Right Cheek
6-probe Extrados GLW 6-Probe Intrados GLW
tmin taloc
Idealized Lower Bound Thickness Profile based on Measured Thickness
During Outate Time
Figure 2: FEA Idealized Thickness Profile along 1st & 2nd Tight Radius Bends
Figure 3: FEA Model of the Analyzed CANDU Feeder Pipe with Two Tight Radius Bends
LINEAR ELASTIC ANALYSIS
The finite element analysis is organized as follows:
Apply the internal pressure as a static load and perform a linear elastic finite element analysis.
Linearize the resulting stress solution across the wall thickness to obtain the corresponding
membrane, and membrane plus bending stress intensities.
Examine the membrane and membrane-plus-bending stress intensities against the ASME SEC III
NB-3221 criteria.
Linear Elastic FEA Results for Primary Loading (Pressure & Pressure + Dead Weight)
The primary membrane stress intensity (Pm) and the primary membrane + bending stress intensity (Pm + Pb) are obtained from the linearization of the stress intensity through the thickness. The linearization
1.0 2.0 3.0 4.0 5.0 6.0 7.0
0.0 5.0 10.0 15.0 20.0 25.0 30.0 35.0 40.0 45.0 50.0 55.0 60.0 65.0 70.0 75.0 80.0 85.0 90.0 95.0 100.0 105.0 110.0 115.0 120.0 125.0 130.0 135.0 140.0 145.0
W
a
ll
T
h
ic
k
n
e
s
s
(
m
m
)
Axial Distance Along Feeder Centerline (Deg)
FEA Thickness Profile
tmin taloc
First Bend Second Bend
Idealized Lower Bound Thickness Profile based on Measured Thickness
is carried out for all possible through thickness paths along the entire tight radius bends. The linearized stresses are normalized based on the allowable stress intensities as follows;
Pm/Sm for the primary membrane stress intensity,
PL/(1.5Sm) for the local primary membrane stress intensity, and
(Pm + Pb)/(1.5Sm) for the primary membrane plus bending stress intensities.
Figure 4 & Figure 5 show the results of the linearized stress intensity distributions (Pm, (Pm + Pb)i, and (Pm + Pb)o from the pressure plus deadweight analyses) along the axial and circumferential directions for the 0% ovality and 8% ovality, respectively. The NB-3221.1&2&3 criteria are represented by the red
horizontal lines.
Table 1
summarizes the normalized stress intensity results for both the first and secondtight radius bends (with 0% ovality) corresponding to the pressure and pressure + dead weight loadings.
Table 2
summarizes the normalized stress intensity results for both the first and second tight radius bends (with 8% ovality) corresponding to the pressure and pressure + dead weight loadings. As can be seenfrom Figure 4 &
Table 1
, the tight radius bend meets the code criteria comfortably. This is obviously notthe case when it comes to the 8% ovality results as demonstrated in Figure 5 &
Table 2
. In the case of8% ovality, the second tight radius bend exhibited significantly higher (Pm + Pb).
The ratios between the linearized stress intensities from the 8% ovality case and the 0% ovality
case are summarized in
Table 3
. A maximum of 65% increase in the stress intensity is observed with theprimary membrane plus primary bending stress intensity on the inner surface of the tight radius bend. As can be observed, the primary membrane stress intensity is not affected by the percentage ovality.
Figure 4: FEA Linear Elastic Stress Intensity Results - 2nd Tight Radius Bend PRESS+DWT (0% Ovality)
Table 1: Maximum Linearized Stress Intensity Ratio (max/allowable) - 0% Ovality
Code Classification Pm PL (Pm+Pb)i (Pm+Pb)o
Code Allowable Sm 1.5 Sm 1.5 Sm 1.5 Sm
Pressure 1
st Bend 1.00 0.70 0.78 0.65
2nd Bend 0.896 -- 0.62 0.58
Pressure + Deadweight 1st Bend 1.00 0.70 0.81 0.66
2nd Bend 0.924 -- 0.73 0.67
0 5 10 15 20 25 30
0 15 30 45 60 75
Pm
(K
s
i)
Axial Distance (Deg.)
Sm 1.1 Sm 1.5 Sm 0 5 10 15 20 25 30
0 90 180 270 360
Pm
(K
s
i)
Circumferential Distance (Deg.)
Sm INT RC LC 1.1 Sm 1.5 Sm 0 5 10 15 20 25 30
0 15 30 45 60 75
Pm + Pb (K s i)
Axial Distance (Deg.)
1.5 Sm Inner Surface 0 5 10 15 20 25 30
0 90 180 270 360
Pm + Pb (K s i)
Circumferential Distance (Deg.)
1.5 Sm Inner Surface INT RC LC 0 5 10 15 20 25 30
0 15 30 45 60 75
Pm + Pb (K s i)
Axial Distance (Deg.)
1.5 Sm Outer Surface 0 5 10 15 20 25 30
0 90 180 270 360
Pm + Pb (K s i)
Circumferential Distance (Deg.)
1.5 Sm Outer Surface
INT RC
Figure 5: FEA Linear Elastic Stress Intensity Results - 2nd Tight Radius Bend PRESS+DWT (8% Ovality)
Table 2: Maximum Linearized Stress Intensity Ratio (max/allowable) – 8% Ovality
Code Classification Pm PL (Pm+Pb)i (Pm+Pb)o
Code Allowable Sm 1.5 Sm 1.5 Sm 1.5 Sm
Pressure 1st Bend 1.00 0.70 0.93 0.84
2nd Bend 0.897 -- 1.02 0.90
Pressure + Deadweight 1st Bend 1.00 0.69 0.90 0.82
2nd Bend 0.931 -- 1.18 1.04
Table 3: Stress Intensity Ratio (8%Ovality stresses / 0% Ovality Stresses)
Code Classification Pm PL (Pm+Pb)i (Pm+Pb)o
Pressure 1
st Bend 1.00 1.00 1.19 1.29
2nd Bend 1.00 -- 1.65 1.55
Pressure + Deadweight 1
st Bend 1.00 0.99 1.11 1.24
2nd Bend 1.01 -- 1.62 1.55
PLASTIC ANALYSIS
The ASME SEC III NB-3228.1 Limit Analysis states that “The limits on General Membrane Stress
Intensity (NB-3221.1), Local Membrane Stress Intensity (NB-3221.2), and Primary Membrane Plus Primary Bending Stress intensity (NB-3221.3) need not be satisfied at a specific location if it can be shown by limit analysis the specified loadings do not exceed two-thirds of the lower bound collapse load”.
This statement is converted to the following mathematical form:
PD ≤ (2/3) PC OR PC /PD ≥ 1.5
Where,
PD Design Load
PC Collapse Load
The same finite element analysis models used for the linear elastic analyses are used for the limit analysis adopting an elastic perfectly plastic material model with the Code specified yield stress of 1.5Sm.
0 5 10 15 20 25 30
0 15 30 45 60 75
Pm
(K
s
i)
Axial Distance (Deg.)
Sm 1.1 Sm 1.5 Sm 0 5 10 15 20 25 30
0 90 180 270 360
Pm
(K
s
i)
Circumferential Distance (Deg.)
Sm INT RC LC 1.1 Sm 1.5 Sm 0 5 10 15 20 25 30 35
0 15 30 45 60 75
Pm + Pb (K s i)
Axial Distance (Deg.)
1.5 Sm Inner Surface 0 5 10 15 20 25 30 35
0 90 180 270 360
Pm + Pb (K s i)
Circumferential Distance (Deg.)
1.5 Sm Inner Surface INT RC LC 0 5 10 15 20 25 30
0 15 30 45 60 75
Pm + Pb (K s i)
Axial Distance (Deg.)
1.5 Sm Outer Surface 0 5 10 15 20 25 30
0 90 180 270 360
Pm + Pb (K s i)
Circumferential Distance (Deg.)
1.5 Sm Outer Surface
INT RC
Figure 6 shows the deformed shape of the tight radius bends region along with the von Mises stress contours for the 0% and 8% ovality corresponding to the collapse load time step (pressure + deadweight) iterations. Contrary to the linear elastic analysis, it is observed that the gross plastic deformation occurs at the intrados of the first tight radius bend. The finite element analysis results are post-processed to produce the displacement curves for all nodal points on the first tight radius bend. For each load-displacement curve, a tangent line (elastic line) is developed starting from the origin (0, 0). The angle that this line is making with the vertical axis is θ. A second line (double slope line) is developed with an angle Φ where tan(Φ) = 2 tan(θ). The intersection point between the double slope line (making an angle Φ with the vertical axis) and the load-displacement curve defines the collapse load, PC. The load displacement curve with the lowest nodal collapse load is plotted as shown in Figure 7.
Figure 7 shows the load displacement curves and the calculated collapse loads for the 0% ovality on the left and 8% ovality on the right. The calculated collapse loads are 2.0713 PD and 1.9690 PD. In both
cases, the calculated collapse load is meeting the criterion (Pc
≥
1.5 PD).Figure 6: FEA von Mises Stress Results for 0% & 8% Ovality
Table 4
lists the calculated collapse loads for the 0% and the 8% ovality cases. A percentage change of4.94 is calculated and rounded up to 5% and applied to the linear elastic results for the 0% ovality.
Table
5
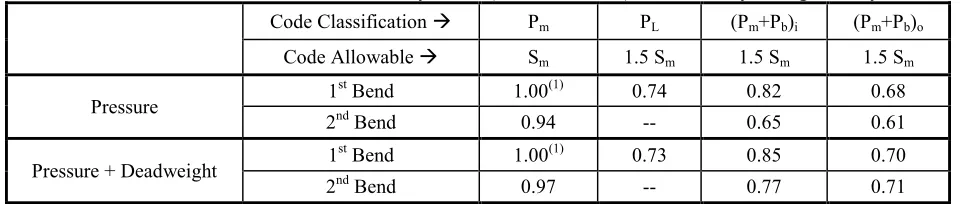
summarizes the scaled up linear elastic stresses after the application of the 5% increase due to ovality.As can be observed, all the stresses meet the NB-3221.1&2&3 criteria.
Table 4: NB-3228.1 Limit Analysis Results
0% Ovality 8% Ovality % Change Collapse Load, PC/PD 2.0713 1.9690
4.94 2/3 PC/PD 1.3809 1.3127
Table 5: Maximum Linearized Stress Intensity Ratio (max/allowable) - 8% Ovality Using Ovality Factor
Code Classification Pm PL (Pm+Pb)i (Pm+Pb)o
Code Allowable Sm 1.5 Sm 1.5 Sm 1.5 Sm
Pressure 1
st Bend 1.00(1) 0.74 0.82 0.68
2nd Bend 0.94 -- 0.65 0.61
Pressure + Deadweight 1
st Bend 1.00(1) 0.73 0.85 0.70
2nd Bend 0.97 -- 0.77 0.71
(1) There is no increase in the P
m as a result of the application of the 5% factor. PL increased along with its extent.
CONCLUSIONS
The ASME Code SEC III NB-3200 is used to assess the fitness for service of thinned tight radius pipe bends under internal pressure and deadweight loadings. Three dimensional finite element models are constructed to simulate general and local inner wall thinning. The thinning profiles are smoothly varied in both the axial and circumferential directions and are constructed as lower bounds to the measured wall thickness distribution over the entire tight radius bends region. A location dependent thinning rate function is developed to provide an estimate for the wall thickness at the end of an arbitrary evaluation period. Linear elastic analysis of the pressure and the pressure plus deadweight loads are performed. The stress intensity is linearized through the thickness of the tight radius bends to obtain the primary membrane and primary bending components. Limit analysis of the same loadings are also conducted following the NB-3228.1 approach. 8% ovality is introduced in the detailed FEA models and both the linear elastic and limit analyses are repeated.
Stress intensity results from the linear elastic FEA are checked against the ASME Code criteria of NB-3221.1&2&3. It is demonstrated that the linear elastic approach with the 8% ovality leads to very conservative results (~65% higher primary membrane plus bending stresses). The limit analysis results from the 0% and 8% ovality cases are used to calculate about 5% decrease in the collapse load when the ovality is considered. A magnification factor of 1.05 is used to scale up the 0% ovality linear elastic results and it is demonstrated that the feeder pipe meets the linear elastic code requirements.
REFERENCES
ASME Boiler and Pressure Vessel Code, Section III (2010). “Rules for Construction of Nuclear Power Plants”.
ASME Boiler and Pressure Vessel Code, Section II (2010). “Part D, Material Properties”.
ASME Code Case N-597-2, “Requirements for Analytical Evaluation of Pipe Wall Thinning”, Section XI, Division 1, Approved Date: November 18, 2003.
Abdelsalam, Usama and Vijay, Dk (2008). “Finite Element Modeling of Locally Thinned Short Radius
Pipe Bends”, Presented at the 8th International Conference on CANDU Maintenance (CMC2008),
Toronto, Ontario, Canada.
Abdelsalam, Usama and Vijay, Dk (2009). “Detailed FEA of Locally Thinned Pipe Bends”, 20th
International Conference on Structural Mechanics in Reactor Technology (SMiRT 20), SMiRT20-Division 3, Paper 2575, Espoo, Finland.
Abdelsalam, Usama and Vijay, Dk (2010). “ASME Code Qualification of Pipe Bends with Localized Wall Thinning”, Proceedings of the ASME 2010 Pressure Vessels and Piping Division Conference, PVP2010, Bellevue, Washington, USA.
Abdelsalam, Usama (2010). “Application of the ASME CODE SEC III Pressure Design Requirements on Locally Thinned Tight Radius Pipe Bends”, Proceedings of the ASME 2010 Pressure Vessels and Piping Division Conference, PVP2010, Bellevue, Washington, USA.
Hasegawa, Kunio, et. Al (2009). “Assessment of Piping Field Failures and Burst Tests on Carbon Steel Pipes with Local Wall Thinning Using ASME Section XI Code Case N-597-2”, Proceedings of the ASME 2009 Pressure Vessels and Piping Division Conference, PVP2009, July 26-30, 2009, Prague, Czech Republic.
Hechmer, John (2000). “Interpretation of ASME B&PV Code for Plastic Analysis”, PVP-Vol. 407, Pressure and Piping Codes and Standards – 2000.
Reinhardt, Wolf and Zobeiry, Nima (2009). “Implications of Limit Analysis on the Evaluation of Locally Thinned Vessels and Piping”, Proceedings of the ASME 2009 Pressure Vessels and Piping Division Conference, PVP2009-77896, Prague, Czech Republic, July 26-30, 2009.
Scarth, D.A. Hasegawa, K., Goyette, L.F., and Rush, P. (2006). “Supplementary Technical Basis for ASME Section XI Code Case N-597-2”, Proceedings of PVP2006-ICPVT-11, 2006 ASME Pressure Vessels and Piping Division Conference, July 23-27, 2006, Vancouver, BC, Canada.
Veerappan, A.R. and Shanmugam, S. (2008). “Analysis for Flexibility in the Ovality and Thinning Limits of Pipe Bends”, ARPN Journal of Engineering and Applied Sciences, Vol 3, No 1, February 2008. Vlaicu, D. (2008). “Nonlinear Cycling Analysis of Pipe Bends with Initial Ovality”, Proceedings of
PVP2008, July 27-31, 2008, Chicago, Illinois, USA.
Xu, Hong et. al (2005. “Stress Assessment Based on Ovality and Thickness Asymmetry for an Internally
Pressurized Pipe Elbow at High Temperature”, 18th International Conference on Structural Mechanics