DOI: 10.1534/genetics.105.044917
Estimating Diversifying Selection and Functional Constraint in the
Presence of Recombination
Daniel J. Wilson
1and Gilean McVean
Department of Statistics, University of Oxford, Oxford OX1 3TG, United Kingdom Manuscript received April 27, 2005
Accepted for publication December 26, 2005
ABSTRACT
Models of molecular evolution that incorporate the ratio of nonsynonymous to synonymous polymorphism (dN/dS ratio) as a parameter can be used to identify sites that are under diversifying
selection or functional constraint in a sample of gene sequences. However, when there has been recombination in the evolutionary history of the sequences, reconstructing a single phylogenetic tree is not appropriate, and inference based on a single tree can give misleading results. In the presence of high levels of recombination, the identification of sites experiencing diversifying selection can suffer from a false-positive rate as high as 90%. We present a model that uses a population genetics approximation to the coalescent with recombination and use reversible-jump MCMC to perform Bayesian inference on both thedN/dSratio and the recombination rate, allowing each to vary along the sequence. We demonstrate
that the method has the power to detect variation in thedN/dSratio and the recombination rate and does
not suffer from a high false-positive rate. We use the method to analyze the porB gene of Neisseria meningitidisand verify the inferences using prior sensitivity analysis and model criticism techniques.
A
S an indicator of the action of natural selection in gene sequences the ratio of nonsynonymous to syn-onymous substitutions (dN/dS) is versatile and widely used. An excess of nonsynonymous relative to synony-mous polymorphism is a clear signal of diversifying se-lection, whereas a lack of nonsynonymous relative to synonymous polymorphism is indicative of purifying selection imposed by functional constraint.Nielsen and Yang (1998) proposed a
maximum-likelihood phylogenetic approach to estimating thedN/ dS ratio that employs a codon-based mutation model (Goldmanand Yang1994) and treats thedN/dSratio
as an unknown parameter v. This method has sub-sequently been expanded (Yanget al. 2000; Yangand
Swanson 2002; Swanson et al. 2003), adapted into a
Bayesian setting (Huelsenbeckand Dyer2004), and
approximated for the purposes of computational effi-ciency (Massinghamand Goldman2005). Simulation
studies have shown that phylogenetic likelihood-based methods can be substantially more powerful than alter-native approaches (Anisimovaet al. 2001, 2002; Wong et al. 2004; KosakovskyPondand Frost2005).
Estimating the selection parametervusing these meth-ods has become widespread (e.g., Bishop et al. 2000;
Ford 2001; Mondragon-Palomino et al. 2002; Filip
and Mundy2004) and has been applied to many
or-ganisms. Analysis of pathogens such as viruses (Twiddy
et al. 2002;deOliveiraet al. 2004; Moury2004) and
bacteria (Peek et al. 2001; Urwin et al. 2002) is
par-ticularly informative, because they typically have high mutation rates and are consequently genetically diverse, which lends greater statistical power to estimation. The ability to observe these populations evolving in real time makes them especially interesting for the study of evo-lution (Drummondet al. 2003) and suggests that we may
be able to make useful epidemiological inferences from molecular sequence data (Wilsonet al. 2005).
However, the use of phylogenetic techniques is ques-tionable in organisms that are highly recombining, because recombination leads to not one, but multiple evolutionary trees along the sequence. If the recombi-nation rate is of the same order as the mutation rate, as has been found in some organisms (McVeanet al. 2002;
Stumpfand McVean2003), then there might be a new
evolutionary tree for every polymorphic site along the sequence. In such a scenario, which is plausible for many highly recombining microorganisms (Awadalla
2003) and eukaryotic genes containing recombination hotspots (McVeanet al. 2004; Winckler et al. 2005),
there is little hope of inferring any particular evolution-ary tree along the sequence. When a single evolutionevolution-ary tree is inferred for a sample of gene sequences that have in fact undergone recombination, the resulting tree is likely to have longer terminal branches and total branch length, yet a smaller time to the most recent common ancestor, in a way that superficially resembles the star-shaped topology of an exponentially growing popula-tion (Schierup and Hein 2000). The effect on the
1Corresponding author: Department of Statistics, 1 South Parks Rd.,
Oxford OX1 3TG, United Kingdom. E-mail: [email protected]
identification of sites experiencing diversifying selection is to cause a high number of false positives (Anisimova et al. 2003), as high as 90% (Shrineret al. 2003).
In this article we present a new method that coes-timates the selection parametervand the recombination rate along the sequence. We use a population genetics approximation (Liand Stephens2003) to the
coales-cent with recombination (Hudson 1983; Griffiths
and Marjoram 1997), rather than using a
phyloge-netic approach, and we adopt a Bayesian, rather than a maximum-likelihood strategy, to incorporate evolution-ary uncertainty. The method uses reversible-jump Mar-kov chain Monte Carlo (MCMC) to obtain the posterior distribution of parameters. We conduct simulation stud-ies, which show that there is good power to detect variation invand the recombination rate and that the method has a low false-positive rate. We use the method to analyze the porB gene of the bacterial pathogen Neisseria meningitidis and verify the inferences using prior sensitivity analysis and model criticism techniques.
THEORY
In this article, the parameters of primary interest are the selection parametervand the population recom-bination rater, both of which are allowed to vary along the sequence. The other model parameters are the transition–transversion ratiok, the rate of synonymous transversionm, and the insertion/deletion ratef. Key to maximum-likelihood or Bayesian inference is the likeli-hood function, PðHjQÞ, where H is the data (the haplotypes) andQ represents our model parameters. Phylogenetic methods typically estimate the maximum-likelihood tree, G^, and then calculate the likelihood conditional on the tree,PðHjG^;QÞ, using the pruning algorithm (Felsenstein1981). When there is
recombi-nation there can be multiple trees along the sequence, and there is typically little power to estimate those trees. Therefore we treat the trees as a nuisance parameter that we wish to average over, so
PðHjQÞ ¼
ð
PðHjG;QÞPðGÞdG; ð1Þ
where PðGÞis the probability density of the ancestral tree or trees, including branch lengths. There are various ways to modelPðGÞ. In the case of no recombination Huelsenbeckand Dyer(2004) used a model in which
all unrooted tree topologies were uniformly likely, and branch lengths had an exponential distribution. When the sequences are from a single population a nat-ural choice would be the coalescent (Kingman 1982;
Hudson1983; Griffithsand Marjoram1997), which
models a neutrally evolving, randomly mating popula-tion of constant size, with or without recombinapopula-tion. In this article we approximate Equation 1 in the case where PðGÞis the coalescent with recombination.
In a coalescent model the expected branch length between a pair of sequences is 2PNegenerations (where Pis the ploidy andNeis the effective population size), during which time there areuS synonymous mutations on average. uS is twice the synonymous mutation rate per PNe generations and, likewise, r is twice the re-combination rate per PNe generations. We use the codon model of Nielsen and Yang (1998), hereafter
NY98, which gives the mutation rate from codonitoj (i6¼j) in units ofPNegenerations as
qij¼pjm
1 for synonymous transversion
k for synonymous transition
v for nonsynonymous transversion
kv for nonsynonymous transition 0 otherwise;
8 > > > > < > > > >
: ð2Þ
where the frequency of codon j is pj. The diagonal elements of the mutation rate matrix are defined to be qii¼ Pj6¼iqij. When there is equal codon usage,
us ð615kÞm=155: ð3Þ
Inappendix awe extend the NY98 model specified by
Equation 2 to incorporate an insertion/deletion ratef. When there is no recombination, Equation 1 could be computed using importance sampling or MCMC (e.g., Huelsenbeckand Dyer2004). In the presence of
re-combination, importance sampling (Fearnhead and
Donnelly2001) and MCMC (Kuhneret al. 2000) have
been applied to simpler mutation models. However, these methods are highly computationally intensive. In the context of the NY98 mutation model, such methods are not feasible.
Instead we turn to an approximation to the likelihood in the presence of recombination (Li and Stephens
2003) called the product of approximate conditionals (PAC) likelihood. Their approach relies on rewriting the likelihood as
PðHjQÞ ¼PðH1jQÞPðH2jH1;QÞ
. . .PðHnjH1;H2;. . .;Hn1;QÞ; ð4Þ where H¼ ðH1;H2;. . .;HnÞ is the sample of n gene sequences (haplotypes). Li and Stephens approximate theðk11Þth conditional likelihood:
PðHk11jH1;H2;. . .;Hk;QÞ pˆðHk11jH1;H2;. . .;Hk;QÞ:
can think of the hidden Markov model doing so im-plicitly, but in an approximate way that is highly com-putationally efficient.
As a result of the approximate nature of the PAC likelihood, the ordering of the n haplotypes can in-fluence the value of the likelihood (were it not for the approximation, the haplotypes would be exchangeable). Therefore, the likelihood is assessed by averaging over multiple orderings of the haplotypes. We use 10 order-ings throughout unless otherwise stated.
We modify the approximation of Li and Stephens to incorporate the NY98 codon-based model with the ad-dition of an insertion/deletion ratef(seeappendix a
for details), and we adopt a Bayesian rather than a maximum-likelihood approach. Thus, our object of inference is the posterior distribution of parameters, PðQjHÞ, where
PðQjHÞ}PðHjQÞPðQÞ: ð5Þ
HerePðHjQÞis the likelihood function, described above and inappendix a, andPðQÞis the prior distribution on
the parameters.
Our primary aim is to obtain a posterior distribution for v, allowing v to vary along the length of the se-quence. The information regardingvat a given posi-tion along the sequence is limited by the number of mutations in the underlying evolutionary history. This is a potentially serious limitation, particularly for sequen-ces with low diversity. In an attempt to exploit to the full the available information, we use a prior distribution on
vin which adjacent sites may share a common selection parameter.
For a sequence of length L codons, our prior dis-tribution imposes a ‘‘block-like’’ structure on the varia-tion invwith two fixed andBð0#B#L1Þvariable transition points,
sðBÞ¼ ð
s0;s1;. . .;sB11Þ;
whereðs0 ¼0Þ,s1,s2,. . . ,sB,ðsB11 ¼LÞ. Blockjis delimited by transition pointsðsj;sj11Þand has a common selection parametervj. We model the number of variable transition points in the region as a binomial distribution with parametersðL1;pvÞ. Given
the number of transition points, the selection param-eter for each block is independently and identically distributed. For an exponential prior on vj with rate parameter l, the prior distribution on the transition points and selection parameters can be written
PðB;sðBÞ;vðBÞÞ ¼
pvBð1pvÞL
B1lB11
3expflðv01v11. . .1vBÞg: ð6Þ
In this model, the expected length of a block is L=ðpvLpv11Þ 1=pv. For pv¼0 there is a single
block, producing a constant model for v along the
sequence, and for pv¼1 every site has its own
in-dependent v. Therefore the user can choose not to impose a block structure on the variation invif desired. This model for variation invis based on the multiple change-point model of Green(1995), which was
adop-ted by McVean et al. (2004) to estimate variable
re-combination rates along a gene sequence, although the binomial model described here is designed specifically so that transition points must fall between codons at a finite (L1) number of positions. Multiple change-point models have also been used in the context of detecting parental and recombinant genomes in HIV-1 (Suchardet al. 2002; Mininet al. 2005). We implement
a model for the variation inrof the same form as that for
v, but the block structure for r is independent of the block structure for v, and the number of variable transition points is binomially distributed with param-etersðL2;prÞ. We assume that recombination occurs
only between codons and not within them. In this way we are able to perform inference jointly on variation in
v and r along the sequence. We use reversible-jump MCMC to explore the posterior distribution of Q(see
appendix b).
SIMULATIONS
To investigate the performance of the method, we undertook two simulation studies. In the first we simulated data with variation in the selection parameter along the sequence and a constant recombination rate. In the second, we simulated data with variation in the recombination rate along the sequence and a constant selection parameter. Each of these two studies consisted of simulating 100 data sets ofn¼20 sequences each of length L¼200 codons, using the coalescent with re-combination (Hudson1983; Griffithsand Marjoram
1997) and the NY98 mutation model.
To investigate the effect of the block model of variation inv, a third simulation study was undertaken in which a short sequence of lengthL¼21 codons was simulated with a single site experiencing diversifying selection in the middle (v¼5.0) against a background of functionally constrained sites (v¼0.2). One hun-dred data sets ofn¼20 sequences were simulated and analyzed, using both the block model for variation inv
(pv¼201) and the independent model for variation inv
(pv¼1).
In all three simulation studies, the MCMC was run twice for each analysis over 250,000 iterations, with a burn-in of 20,000 iterations. Initial values were chosen randomly from the priors independently for the two runs. The runs were compared for convergence and merged to obtain the posterior distributions.
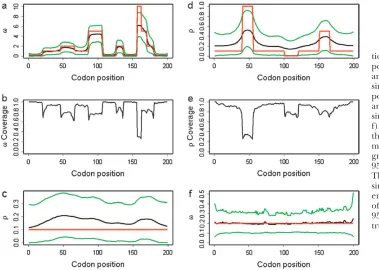
Simulation study A: This study was designed to sim-ulate data with variation invbut not inr. We variedv
between 0.1 and 10, as shown by the red line in Figure 1a.
The mutation parameters were set at m¼0:7 and
k¼3:0, which gives uS¼0:1. The recombination rate was set constant atr¼0:1, giving a total recombination distance for the region ofR ¼Pr¼19:9. The muta-tion and recombinamuta-tion parameters were chosen to mimic those estimated for the housekeeping genes ofN. meningitidis(Jolleyet al. 2005). Exponential
distribu-tions were used for the priors onm,k,v, and r, with means 0.7, 3.0, 1.0, and 0.1. A block model of variation invandrwas used withpv¼pr¼201, so that the average
length of a block would be 10% of the sequence length.
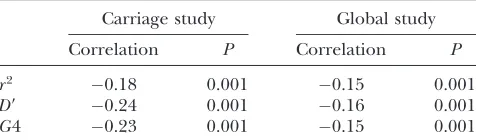
A permutation test based on the correlation between physical distance and three measures of linkage dis-equilibrium (LD), r2, D9, and G4 (see, for example, Meunierand Eyre-Walker2001; McVeanet al. 2002),
showed that phylogenetic analysis of these data sets was inappropriate because of the presence of recombina-tion. The numbers of data sets for which theP-value was
,0.05 were 99, 93, and 93 for the three test statistics, respectively.
Figure 1a shows the average over the 100 simulated data sets of the mean and 95% highest posterior density (HPD) interval for the posterior distribution of v at each site. The average mean posterior density follows the truth closely. Likewise the average 95% HPD interval generally encloses the true value ofv. As expected, the effect of fitting a prior with mean 1 was to cause the posterior to underestimate v when v.1 and over-estimatevwhenv,1. The effect is not great except for the most extreme values wherev¼10.
However, even where the average 95% HPD interval encloses the truth, that does not mean the 95% HPD
interval encloses the truth for all simulated data sets. Figure 1b shows the relevant quantity, the coverage ofv, for each site. Coverage is defined here as the proportion of data sets for which the 95% HPD interval encloses the truth. Half of sites have coverage .93%, and 95% of sites have coverage.66%. If a false positive is defined as the lower bound of the 95% HPD interval exceeding 1 when in truth v #1, then the false-positive rate was 0.5%. The estimate of the synonymous transversion rate
mexhibits upward bias (average 0.90), with 63% cover-age (Table 1), and the transition–transversion ratiokis estimated to be 3.1 on average, with 91% coverage.
Consistent with the findings of Li and Stephens
(2003), we observe that the recombination rate estima-tor has a small upward bias (Figure 1c). The average mean posterior is almost flat, and the average 95% con-fidence intervals enclose the truth completely, suggest-ing that the estimator is good notwithstandsuggest-ing its bias. The coverage is almost constant across sites at 95%. Table 1 shows that the estimate of the total recombina-tion distance,R, is also upwardly biased. Coverage ofR, Figure 1.—Results of
simula-tion studies A and B. (a) Average posterior ofv, (b) coverage ofv, and (c) average posterior ofrin simulation study A. (d) Average posterior ofr, (e) coverage ofr, and (f) average posterior ofvin simulation study B. (a, c, d, and f) The red line indicates the truth, the black line indicates the average mean of the posterior, and the green lines indicate the average 95% HPD interval of the posterior. The averages are taken over 100 simulated data sets. (b and e) Cov-erage is defined as the proportion of the 100 data sets for which the 95% HPD interval encloses the truth.
TABLE 1
Summary of posteriors for simulation study A
Average posterior
Parameter Truth Prior: mean
Lower 95% HPD Mean
Upper 95%
HPD Coverage
however, was only 43%, suggesting that the good cover-age forr at individual sites may be in part because of poor information. Importantly, Figure 1, a–c, shows that the effect of the selection parameter on the estimate ofris negligible, indicating that inference onr is not confounded byv.
Simulation study B:This study was designed to sim-ulate data with variation in r but not inv. Along the sequence we letrvary at 0.005, 0.1, 0.5, and 1, for which one would expect 0.018, 0.35, 1.8, and 3.5 recombina-tion events, respectively, per site in the ancestral history under a coalescent model (Griffithsand Marjoram
1997). The total recombination distance wasR ¼37:5. We letm¼3:6 andk¼3:0, givinguS ¼0:5 and a con-stant selection parameter ofv¼0:2. Exponential dis-tributions were used for the priors onm,k,vandr, with means 3.6, 3.0, 1.0, and 0.2. The same model of variation invandrwas used as for simulation study A.
Permutation tests showed that these data sets were not amenable to phylogenetic analysis because of the pres-ence of recombination. All 100 data sets yieldedP-values
,0.05 for all three measures of LD.
Variation in the recombination rate was detected by the new method, as seen in Figure 1d. The average over the 100 data sets shows that the mean and 95% HPD interval for the posterior distribution ofr at each site pick up the rate variation, but not to the full extent. As a result, the coverage shown in Figure 1e is generally good, on average 85%, but performs worst for the most extreme peak in rate between sites 41 and 55, where it consistently underestimates the height. The properties of the estimate of the total recombination distanceR (Table 2) are similar to those in simulation study A. There is a tendency to overestimate (average 50.9) and as a result coverage is 49%. This bias could be corrected empirically, as in Liand Stephens(2003). Nevertheless,
there is power to detect rate variation on such fine scales. The extent to which the posteriors underesti-mate the deviations from the mean recombination rate reflects the constraining effect of the prior when the signal in the data is weak.
Figure 1f shows that on average the estimates ofvare very close to the truth, with the average 95% HPD inter-vals completely enclosing the true value. Along the sequence, the estimates are flat, with mean 0.21 and
coverage 90%. The false-positive rate was zero. Reflect-ing simulation study A, there was no evidence that vari-ation in the recombinvari-ation rate confounded inference on the selection parameter. Table 2 shows that there was some upward bias in the mean estimate ofm¼4:1, with 58% coverage, and the transition–transversion ratio was estimated to be 3.2 on average, with 89% coverage. Most importantly, both simulation studies show that when there is variation invorrit can be detected, when there is no variation none is detected, and there is little or no confounding betweenvandr.
Simulation study C:This study was designed to inves-tigate the smoothing effect of the block-like prior for variation invon the detection of diversifying selection and functional constraint. As in simulation study A, the mutation parameters were set at m¼0:7 and k¼3:0, givinguS¼0:1. A single codon in the middle of theL¼ 21-codon sequence was simulated under diversifying se-lection (v¼5.0) whereas all the surrounding sites were functionally constrained (v ¼ 0.2). As in simulation study A, the recombination rate was set constant at
r¼0:1 and exponential distributions were used for the priors onm,k,v, andr, with means 0.7, 3.0, 1.0, and 0.1. All simulated data sets exhibited nonsynonymous poly-morphism at the codon under diversifying selection. Two analyses were conducted for each of the 100 sim-ulated data sets: in one a block model on variation inv
was used (pv ¼201) and in the other each site had an
independent v (pv ¼ 1). In both a block model on
variation inrwas used (pr¼201).
Figure 2a shows the average over the 100 data sets of the mean posterior ofvalong the sequence under the block model (solid line) and the independent model (shaded line). The mean of the prior is also shown (dashed line). In both models the mean value ofvis estimated to be .1 for the site under diversifying selection and
,1 for the functionally constrained sites. By combining information across functionally constrained sites, the block model has obtained an estimate ofvcloser to the truthðv¼0:2Þthan the independent model. At the site under diversifying selection, the effect of the block model is to smooth the variation inv, and as a result the estimate is only just.1 ˆðv¼1:3Þwhereas the independent model obtains an estimate closer to the true value of 5.0
ˆ
v¼2:9
ð Þ. Both are underestimates, which reflects the
effect of the prior when there is little information. For functionally constrained sites, the coverage was 99% for both models, although this partly reflects the wider HPD intervals for the independent model. For the site under diversifying selection, coverage was 16% for the block model and 67% for the independent model. However, for both models there is an appreciable increase in the estimate of v at the site under di-versifying selection, which is seen more clearly in Figure 2b. The sitewise posterior probability of diversifying selection ðv.1Þis plotted for the block model (solid line) and the independent model (shaded line). The
TABLE 2
Summary of posteriors for simulation study B
Average posterior
Parameter Truth Prior: mean
Lower 95% HPD Mean
Upper 95%
HPD Coverage
m 3.6 3.6 3.4 4.2 5.1 0.53 k 3.0 3.0 2.5 3.1 3.8 0.95 R 37.5 39.8 37.4 50.9 65.0 0.49
prior probability of diversifying selection is also dicated (dashed line). The posterior probability in-creases by a similar amount at the middle site for both models, although the increase is more abrupt for the independent model. By combining information across sites, the block model reports a lower posterior proba-bility of diversifying selection at the functionally con-strained sites, but the smoothing effect accordingly produces a lower posterior probability of diversifying selection at the middle site, compared to the indepen-dent model.
As expected, the smoothing effect of a block model for variation invimproves the estimates for series of sites that share a common selection parameter, but dis-favors lone sites with a very different selection param-eter, compared to a model in which each site has an independentv. The decision whether to use a block model or an independent model for variation invwill depend on the user’s prior beliefs as to the nature of variation in the selection parameter and the relative importance of obtaining improved estimates on average at the expense of lone unusual sites. Figure 2b shows that the strength of the block structure (1/pv) should be
taken into account when choosing a level above which a site is deemed to undergo diversifying selection; the signal of lone sites experiencing diversifying selection is still apparent for the block model, but the absolute posterior probability is lower.
APPLICATION TO MENINGOCOCCAL PORB
Using theporBlocus ofN. meningitidis, we demonstrate the application of the Bayesian approach to inference of selection and outline a coherent approach to model-based analysis, from rejection of a model with no re-combination through to prior sensitivity analysis and model criticism. Finally, we look at the effect on in-ference of assuming no recombination.
N. meningitidisis the bacterium responsible for menin-gococcal meningitis and septicemia. Despite its notori-ous pathogenesis, it is commonly found as a commensal organism occupying the nasopharynx of10% of the population (e.g., Jolleyet al. 2000). PorB is a porin
ex-pressed on the surface of the meningococcus and is thought to be important for both proper cell growth and pathogenesis. Two classes of PorB protein exist, with somewhat different molecular structure and evo-lutionary ancestry (Smith et al. 1995; Derrick et al.
1999), called PorB2 and PorB3. Urwinet al. (2002) used
a maximum-likelihood method (Yanget al. 2000)
im-plemented in the CODEML program of the PAML package (Yang1997) to infer selection in theporBlocus,
taking the porB2 and porB3 allelic classes separately. The CODEML method infers a maximum-likelihood phylogenetic tree for the sequences and then makes inference on the selection parameters on the basis of that tree. Therefore it does not take account of recom-bination that has occurred between those sequences since their most recent common ancestor.
Data: Here we analyze the 79 porB3 alleles from Urwin et al. (2002), using the new method
imple-mented in the program omegaMap. The 79 alleles do not constitute a random sample of any population in a meaningful sense, thus violating one of the assumptions of the coalescent model. Instead the sequences are a collection taken from an assortment of studies, includ-ing 37 isolates from healthy carriers from England and Wales obtained during swabbing programs at a military recruit training camp (see Urwinet al. 2002 for details).
Of these 37 isolates, 19 were obtained from 5 of the recruits and the remaining 18 were from 1 each. To account for this sampling bias, we took only 1 isolate from each recruit, yielding a sample size of 23. In the
discussion we explain the rationale behind this. We
called the sample of 23 the carriage study and the full collection of 79 theglobal study. Whereas the global study consisted of 77 unique haplotypes, the carriage study consisted of 12 unique haplotypes. R. Urwin kindly pro-vided us with her sequence alignments.
Preliminary analysis:To test the simpler model of no recombination, we applied the permutation tests de-scribed in simulation studies to the carriage and
global studies. Table 3 shows the results. For the carriage study, there was a 0.1% probability of observing as ex-treme a correlation between physical distance and LD under the model of no recombination, regardless of Figure2.—Results of simulation study C. (a) Average
pos-terior ofvwhen analyzed using the block model for variation inv(pv¼201, solid line) and the independent model (pv¼1,
shaded line). The average prior ofvis also shown (dashed line). (b) Sitewise posterior probability of diversifying selec-tion (v.1) when analyzed using the block model (pv¼201,
solid line) and the independent model (pv¼1, shaded line).
choice of LD statistic. The result was the same for the global study. Therefore these data are not amenable to phylogenetic analysis. In the analyses that follow we specified the codon frequencies using the observed co-don frequencies (Nakamuraet al. 2000) in theN. men-ingitidis Z2491 serogroup A genome (Parkhill et al.
2000), excluding the stop codons.
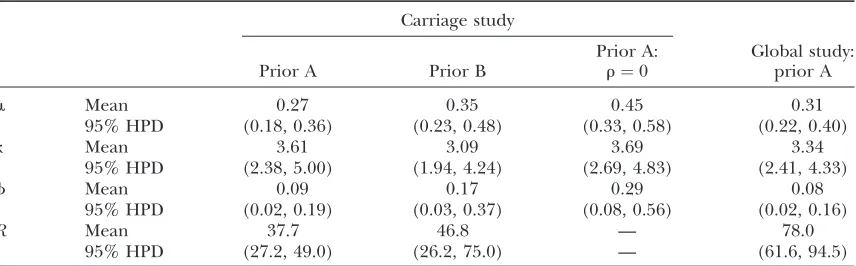
Carriage study: We chose to use exponential distri-butions for the priors onm,k,f,v, andr(Table 4, prior A). The mean of the prior onmwas 0.07, and the mean fork was put at 3. The rate of insertion/deletion was given a mean off¼0:1. Forv, the mean of the prior was set to 1, to represent our null model of selective neu-trality, and forr, the mean was set at 0.1. The prior on the number of blocks forvandrwas binomial withpv¼
pr¼301, so that the length of a block would be on average
10% of the sequence length (L¼298 codons). We ran
three MCMC chains, each 500,000 iterations in length, with a burn-in of 20,000 iterations. Having compared the chains for convergence, we merged them to obtain the posterior distributions.
Figure 3a shows a fire plot for the posterior distribu-tion of v at each site. More intense colors (closer to white) represent high posterior probabilities and less intense colors (closer to red) low posterior probabili-ties. The structure of PorB3 (Urwinet al. 2002) consists
of eight putative loop regions that extend out of the cell. Of these, there is clear and strong evidence for di-versifying selection at four of the eight loops. In these loop regions the 95% HPD intervals for the peakvare (3.58, 9.76), (3.01, 8.92), (3.26, 9.68), and (2.58, 7.57) for loops 1, 5, 6, and 7, respectively. Taking the point estimate ofvat a site, ˆv, as the mean of the posterior distribution, then the average ˆvfor the sequence is 0.90.
Excluding sites for which ˆv.1, this drops to 0.16. So the majority of the sequence is under strong functional constraint, but four of the eight loop regions are under strong diversifying selection.
Superimposing ˆv onto the three-dimensional struc-ture of the PorB3 protein (Figure 3b) illustrates the external position of loops 1, 5, 6, and 7. Because PorB3 is a cell surface protein, these outer loops are especially exposed to the immune system and are prime sites for recognition by antibody. It is striking that there is no evidence for diversifying selection outside the loops. Loops 2, 3, and 4 do not appear to be under diversifying selection; the three-dimensional structure suggests that they may be less exposed than the other loops. However, loop 8 is surprising because despite its prominent posi-tion (Figure 3b), there is very little support for diver-sifying selection between codons 280 and 295 (Figure 3a). The light blue shading in Figure 3b occurs at the N and C termini, outside the nucleotide alignment we analyzed. Therefore we have assigned to them the mean of the prior, ˆv¼1.
There was some evidence for variation in the recom-bination rate (Figure 4a). The posterior mean for the total recombination distance, R^ ¼37:7 (Table 5), was twice the prior mean of 19.9. The posterior onmwas very different from the prior ( ˆm¼0:27), while there was little discrepancy forkandf(ˆk¼3:61, ˆf¼0:09).
Prior sensitivity analysis:To determine the influence of our choice of priors on the posteriors, we repeated the analyses with alternative priors (Table 4, prior B). Formandrwe fit a uniform prior between 0 and 10 (10 being the highest value we considered plausible for either parameter). Following Huelsenbeckand Dyer
(2004) we fit a prior distribution on k describing the ratio of two independent and identically distributed exponential random variables. The moments, including the mean, for this distribution are undefined, but the median equals 1. For f we changed the mean of the exponential prior from 0.1 to 1. Finally, forvwe used a gamma distribution still with a mean of 1, but with shape parameter 2, which gives the distribution a mode at 0.5. This distribution retains the case of selective neutrality for its mean, but it tails off toward zero rather than increasing. We ran three MCMC chains, each 250,000 iterations in length, with a burn-in of 20,000 iterations. The chains were merged to obtain the posteriors.
Ninety-five percent HPD intervals for the peak vin loops 1, 5, 6, and 7 show that the magnitude of the estimates has been reduced by the gamma prior to (2.76, 6.80), (2.16, 5.79), (2.31, 6.70), and (2.16, 5.66), respectively. Despite this, the relative height of the peaks is conserved. The average ˆv for the sequence is 0.68, reflecting the more conservative effect of the gamma prior. Excluding sites for which ˆv.1, this drops to 0.17, which is almost identical to the inference based on prior A. This suggests that information about the absolute magnitude of sites under functional constraint is less
TABLE 3
Permutation test for recombination
Carriage study Global study
Correlation P Correlation P
r2 0.18 0.001 0.15 0.001
D9 0.24 0.001 0.16 0.001
G4 0.23 0.001 0.15 0.001
TABLE 4
Prior distributions
Prior A Prior B
m Exponential mean 0.07 Uniform 0–10 k Exponential mean 3.0 Exponential ratio f Exponential mean 0.1 Exponential mean 1.0 v Exponential mean 1.0 Gamma shape 2, scale 0.5 r Exponential mean 0.1 Uniform 0–10
influenced by the prior. Despite differences concerning the magnitude ofv, the priors strongly agree on which sites are under diversifying selection (Figure 5). The posterior probability of diversifying selection at a given site is
Prðv.1jHÞ ¼
ð‘
1
PrðvjHÞdv: ð7Þ
Prior A is represented in Figure 4 by the shaded line and prior B by the dashed line. The two lines are virtually indistinguishable from one another at every site, in-dicating that our inference on diversifying selected sites inporB3is robust to the choice of prior.
Figure 4, a and b, compares the posterior probability ofrgiven priors A and B. Under prior B, the posterior onris somewhat flatter, with tighter credible intervals. The average ˆr is largely the same for most of the sequence, except at the far ends, where ˆr increases sharply. This is an edge effect where, in the lack of information about the recombination rate, the poste-rior has been overwhelmed by the pposte-rior. The uniform prior onrhas mean 5, explaining the rapid increase. The effect is reflected in the posterior onR(Table 5), which has a similar lower bound, but a much increased upper bound. This striking sensitivity to the prior at the
edges suggests that we should be cautious in interpret-ing the rates at the extremes of the sequence.
The posterior onmis influenced by the high mean of the uniform prior (Table 5), to the extent that ˆm¼0:35 under prior B, which is only just inside the upper bound of the credible interval under prior A. In contrast,kis not particularly sensitive to the prior, with largely over-lapping credible intervals.fshows a similar sensitivity to
min responding to a considerable increase in the prior mean. The lower bound is almost unaffected, but the mean and upper bound show a marked increase.
Model criticism:An essential property of any statisti-cal model is that it should be falsifiable. A useful approach in Bayesian inference, and one that we use here, is that of posterior predictive P-values (Rubin
1984; see also,e.g., Bollback2002, 2005; Nielsenand
Huelsenbeck2002). Here we take model to mean the
probability model together with the posterior distribu-tion of the model parameters. In essence, if the model is a good description of the data, then further data sets simulated under that model ought to ‘‘look like’’ the real data. If they do not, then the model is failing in some important way. By look like we mean that with respect to some statisticD, the observed value of that statistic,DHshould fall well within the range of values for Figure3.—Posterior distribution ofvin theN.
meningitidis porB3carriage study. (a) Fire plot of the sitewise posterior distribution ofv. More in-tense colors (closer to white) represent high pos-terior probabilities and less intense colors (closer to red) low posterior probabilities. (b) Molecular structure of PorB3 color coded according to ˆv, the mean of the posterior distribution ofv. Dark blue indicates strong functional constraint and red indicates strong diversifying selection. This image was produced using protein explorer (Martz 2002; http://proteinexplorer.org). The
image is oriented with the surface-exposed re-gions at the top. Arrows indicate the position of loops I and V–VIII.
TABLE 5
Posterior distributions
Carriage study
Prior A Prior B
Prior A: r¼0
Global study: prior A
m Mean 0.27 0.35 0.45 0.31
95% HPD (0.18, 0.36) (0.23, 0.48) (0.33, 0.58) (0.22, 0.40)
k Mean 3.61 3.09 3.69 3.34
95% HPD (2.38, 5.00) (1.94, 4.24) (2.69, 4.83) (2.41, 4.33)
f Mean 0.09 0.17 0.29 0.08
95% HPD (0.02, 0.19) (0.03, 0.37) (0.08, 0.56) (0.02, 0.16)
R Mean 37.7 46.8 — 78.0
the simulated data sets,DH9, where we useH9to denote a
simulated data set.
The posterior predictive P-value is defined as the probability under the model of observing a discrepancy statisticDas large as that observed,
p¼
ð
PðDH9$DHjQ;HÞPðQjHÞdQ; ð8Þ
where the integration is approximated by
p 1 M
XM
i¼1
IðDH9i$DHÞ: ð9Þ
In this equation, M is a large number (we used M 15;000), H9i is simulated from the posterior dis-tributionPðQjHÞ, andIis the indicator function. It is important to note that we simulated under the exact probability model specified by the PAC likelihood and used in inference, which is not the coalescent but an approximation to it.
Discrepancy statistics have to be chosen that describe some aspect of the data that should be fit well by the model. This is important because it is unlikely that a model will fit all aspects of the data well. Statistics that
are sensitive to mutation areS, the number of segregat-ing sites and EðpÞ, the average number of pairwise differences. For recombination, the variance in the number of pairwise differencesVðpÞand the minimum number of recombination events Rm (Hudson and
Kaplan 1985) are useful statistics. We also used the
correlation between physical distance and LD (r2, D9, and G4) that we used previously in the permutation tests. For selection we introduceU, which is sensitive to any tendency for the simulated data to have too many or too few nonsynonymous changes on average,
U ¼
PL i¼1I u
ðiÞ
H9.u ðiÞ
H
PL i¼1I u
ðiÞ
H9 6¼u ðiÞ
H
; ð10Þ
where uðiÞis the number of nonsynonymous pairwise
differences minus the number of synonymous pairwise differences at sitei. U should be centered around 0.5. U .0:5 indicates a bias toward diversifying selection andU,0:5 a bias toward functional constraint. Finally, we use Tajima’s (1989) D, which is sensitive to
di-rectional selection, balancing selection, and demogra-phy, not forces that we modeled explicitly.
As with a classicalP-value, ifPis very small then the model does not fit the data well. Table 6 shows the ob-served values of all the discrepancy statistics and the two-tailed posterior predictiveP-values for the carriage study under priors A and B. Of all the discrepancy statistics, the only posterior predictiveP-value in the first two columns ,0.05 isSfor prior B. To obtain a single posterior predictiveP-value for each model we combined information from one each of the mutation-sensitive, recombination-sensitive, and selection-sensitive statis-tics (S, r2, and U). Accounting for the multiplicity of P-values using Bonferroni would be too conservative because the statistics are not independent. Instead we use the procedure in appendix c. Table 6 shows that
the combined posterior predictiveP-values for the car-riage study under priors A and B are P ¼0:268 and P ¼0:103, respectively. Neither one is in the 5% tail of the distribution, suggesting that the model fit is ade-quate with respect to mutation, recombination, and se-lection insofar as thedN/dSratio is concerned. Tajima’s Dwas positive (D¼1:05), which may indicate balancing selection or population structure, but the P-value for each prior was not in the 5% tail. So while we have not attempted to model these forces, the model fit appears to be adequate.
Global study: We analyzed the 79-sequence PorB3 data of Urwin et al. (2002) to investigate how the
violation of the coalescent model would affect infer-ence, using prior A. For computational tractability we used one randomly chosen ordering of the haplotypes. We ran three MCMC chains, each 500,000 iterations in length, with a burn-in of 20,000 iterations. The chains were merged to obtain the posteriors. Table 5 shows that Figure4.—Posterior distribution ofrin theN. meningitidis
porB3carriage and global studies. The sitewise mean (solid line) and 95% HPD intervals (dotted lines) are shown for (a) the carriage study under prior A, (b) the carriage study under prior B, and (c) the global study under prior A.
ˆ
m¼0:31 was barely larger than that for the carriage study, and the credible intervals overlapped almost entirely. The rate of insertion/deletion, f was not greatly affected ( ˆf¼0:08), nor was the transition– transversion ratio (ˆk¼3:34). But the total recombina-tion rate doubled to R^ ¼78:0 with no overlap in the credible intervals. Across the sites, the recombination map (Figure 4c) does not differ greatly in the left half of the sequence (cf. Figure 4a), but thereafter rises rapidly to r¼0:38. The low posterior predictive P-values for the recombination-sensitive discrepancy statistics (Table 6) suggest caution in the interpretation of ˆr.
However, inference onvwas hardly affected. Loops 1, 5, 6, and 7 still have very high posterior probabilities of diversifying selection. The magnitude ofvinferred for each loop is comparable, with the 95% HPD intervals for the four loops (2.89, 7.28), (3.47, 8.17), (3.22, 8.79), and (3.10, 7.60). The only substantive difference is in loop 8, which now also has high posterior probability of
v.1. The 95% HPD interval for the peakvin loop 8 is (0.66, 2.87) and Prðv.1Þ ¼0:92. This difference can be explained by sites in loop 8 that exhibit amino acid variation in the global study but not in the carriage study. The average ˆvfor the whole sequence is 0.91, and excluding sites for which ˆv.1, it drops to 0.22, both values comparable to those of the carriage study.
Effect of recombination on inference:Ancestral re-combination can cause false positives in phylogenetic methods (Anisimovaet al. 2003; Shrineret al. 2003). If
this has had an important effect on the analysis of meningococcal PorB3 then we should expect to see those false positives when we compare the results of the CODEML analysis (Urwin et al. 2002) to those
pre-sented here. Those sites identified as under weak (open squares) and strong (solid squares) diversifying selec-tion by CODEML are illustrated in Figure 5. All of the strongly selected sites and all but five of the weakly selected sites fall within loops 1 and 5–8. With the
TABLE 6
Posterior predictiveP-values
Carriage study
Global study
Observed Prior A Prior B
Prior A:
r¼0 Observed Prior A
S 67 0.236 0.039 0.008 92 0.391
EðpÞ 25.3 0.340 0.179 0.003 26.9 0.068
VðpÞ 94.0 0.268 0.391 0.000 98.2 0.118
Rm 15 0.293 0.658 0.070 12 0.036
r2 0.13 0.247 0.265 0.002 0.07 0.002
D9 0.24 0.440 0.353 0.000 0.10 0.059
G4 0.22 0.443 0.332 0.000 0.09 0.144
U 0.5 0.543 0.878 0.711 0.5 0.621
D 1.05 0.121 0.058 0.567 0.97 0.398
Combined 0.268 0.103 0.001 0.013
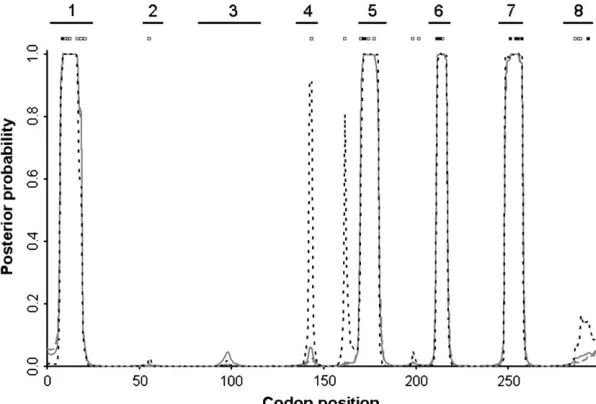
Figure5.—Sitewise posterior probability of
exception of loop 8 all these sites had high posterior probability of diversifying selection for the carriage study (Figure 5). When the global study is analyzed, loop 8 also has high posterior probability of diversifying selection. Therefore there are just five sites where CODEML inferred diversifying selection but omega-Map did not. These are candidates for false positives.
There are a number of possible explanations for discrepancies of this kind, including the following:
1. The approximation in omegaMap has given rise to false negatives. The PAC likelihood does not explic-itly model the genealogy and this might have un-expected effects.
2. The block-like prior in omegaMap caused false negatives. Imposing a model in which adjacent sites share a common selection parameter might disfavor isolated sites under diversifying selection.
3. Recombination has caused CODEML to give false positives.
In an attempt to distinguish between the explanations, we performed an analysis of the carriage study in which we forced the recombination rate to equal zero. Using prior A, we ran three chains for 500,000 iterations each. After a burn-in of 20,000 iterations the chains were com-pared for convergence and merged to give the posterior. In Figure 5 the sitewise posterior probability of diver-sifying selection is plotted (dotted line) for comparison with the other analyses. The false-positive candidates are located at sites 55, 143, 161, 198, and 201. Of these, the first two are located in loops 2 and 4, respectively. The remaining three are not in loops. Comparison of our Figure 3b to Urwinet al.’s (2002) Figure 2b shows that
these latter three disputed sites are located in a cytoplas-mic region of the protein. The sitewise posterior proba-bility of diversifying selection is very similar to our other analyses (Figure 5), except at two positions. These two positions correspond to two of the five false-positive can-didates: sites 143 and 161. Although we cannot be certain that these sites are false positives, the results are suggestive. The posterior predictiveP-values (Table 6) show that the deleterious effect of assuming no recombination is not confined to recombination-sensitive discrepancy statistics. The mutation-sensitive parameters also have extremely lowP-values [0.008 and 0.003 forSandEð Þ,p
respectively]. The combined test shows that the model as a whole is a very poor description of the data (P ¼0:001). Although the selection-sensitive parame-ters do not have significantP-values, the consequence of the model inadequacy is to cast doubt on all inferences made from it.
The PAC model in the absence of recombination does not default to the coalescent with no recombination because the tree is still not modeled explicitly. There-fore it is unlikely that the assumption of no recombina-tion will affect a PAC model and a phylogenetic model in an exactly equivalent fashion. Nevertheless, when we
assume there is no recombination, sites that otherwise had low posterior probability of diversifying selection attained high posterior probabilities. This outcome is exactly what is predicted by the work of Shrineret al.
(2003) and Anisimovaet al. (2003).
DISCUSSION
In this article we have presented a new method for estimating the selection parametervand the recombi-nation rate r from a sample of gene sequences. Un-certainty in the evolutionary history was taken into account using a coalescent-based approximate (PAC) likelihood. Variation invandrwas modeled as a block-like structure with a variable number of blocks. We aver-aged over the number and position of the blocks using reversible-jump MCMC to obtain the posterior distribu-tion of the parameters. Using simuladistribu-tions, we showed that the new method has good power to detect variation invandr, and that the two do not appear to be con-founded. The method has a low false-positive rate for detecting sites under diversifying selection. We applied the method to the porB locus of N. meningitidis and performed prior sensitivity analysis and model criticism to verify the results.
In addition to the ability to coestimatevandr, there are several advantages to the new method. Some of these are a consequence of the Bayesian approach, and all of them rely on the computational tractability of the PAC model. First among these is that our posterior probabil-ities of diversifying selection are fully Bayesian, so they incorporate uncertainty about the evolutionary history, as well as uncertainty in the other parameters. In the pres-ence of recombination, there is likely to be a great deal of uncertainty in the evolutionary history. The computa-tionally efficient PAC likelihood means that in the poste-rior,vcan take on any positive value, rather than having to constrain it to a discrete number of points or approximate a continuous distribution in a similar manner.
In any Bayesian approach it is necessary to specify a prior distribution on all parameters. It is possible to represent a lack of prior knowledge with relatively flat priors, although we note that in reversible-jump MCMC it is not possible to use an improper prior (Green1995).
However, in this article we have taken a different ap-proach, that of prior sensitivity analysis. Prior sensitivity analysis reveals which aspects of the posterior distribu-tion, if any, are unduly influenced by the choice of prior. This in turn reveals which aspects of the model the data are uninformative about. For example, Figure 4b shows that the data contained very little information about recombination rates at the extremes of the sequence. In contrast, inference about diversifying selection inporB3 (Figure 5) was robust to the prior.
In a Bayesian setting it is entirely natural to impose a block-like structure on the joint distribution ofvacross sites. At sites where the data are compatible with a block
structure this allows information about v to be com-bined across sites, but when the signal in the data is strong enough it will overwhelm the block model. The sensitivity to the signal is controlled bypv. The user can
also specify an independentvfor every siteðpv¼1Þor a
singlevfor the whole sequence ðpv¼0Þ. Imposing a
block-like structure is biologically justifiable insofar as adjacent sites in the primary sequence will be closely juxtaposed in the tertiary structure and, as such, are more likely to perform similar functional duties. If any-thing, the model is overly simplistic because the tertiary structure could in principle be used to impose longer-range dependencies on the prior. In a maximum-likelihood setting, implementing the block structure described here would be computationally unfeasible.
On the basis of previous work (Schierupand Hein
2000; Anisimova et al. 2003; Shriner et al. 2003) and
because of clear model misspecification we have claimed that it is inappropriate to analyze data that show evi-dence for recombination using phylogenetic methods. Yet neither the coalescent nor the approximation to the coalescent we use here inevitably fits data from a recom-bining population. That is why we have advocated the use of goodness-of-fit testing. Posterior predictiveP-values allow for goodness-of-fit testing in a Bayesian setting when no explicit alternative model is specified. The posterior predictiveP-values in Table 6 showed that the model with no recombination is a very poor fit to the data, and Figure 5 showed that in the PAC model the assump-tion of no recombinaassump-tion leads to an increase in the number of sites experiencing diversifying selection, which would be expected if this assumption increases the false-positive rate. Posterior predictiveP-values have been crit-icized for being conservative in the sense that the true discrepancy between the model and the data is sup-pressed by using the same data for both fitting the model and evaluating its goodness-of-fit (see,e.g., Meng1994).
However, in the absence of truly independent subsets of the data, caused by shared evolutionary ancestry in the gene sequences, posterior predictive P-values are a pragmatic choice for the important task of goodness-of-fit testing.
Posterior predictiveP-values (Table 6) suggested that the coalescent approximation was not a good fit to the N. meningitidis global study. This was not unexpected because the global study did not represent a random sample from any population in a meaningful sense. In constructing the carriage study we were careful not to include more than one haplotype from any one host. The idea was to envisage the bacterial population as a metapopulation in which each deme corresponds to a host; colonization and extinction correspond to in-fection and clearing of inin-fection. Wakeleyand Aliacar
(2001) have shown that a metapopulation model with many demes converges to a coalescent model when migration (transmission) events are random and each deme is represented by no more than a single haplotype. Consistent with this model, the posterior predictive
P-values showed that the coalescent approximation did provide an adequate fit to the carriage study (Table 6). There is more work to be done on formalizing the rela-tionship between genetic models, such as the coalescent, and epidemiological models, but it may be possible in the future to use models such as the one presented here to estimate parameters of epidemiological relevance.
We thank Rachel Urwin for her help and advice and providing the sequence alignments for the meningococcal data; Jeremy Derrick, who provided the molecular structure of PorB3; Ziheng Yang for kindly offering part of his C code for this work; and Stephen Leslie, Jonathan Marchini, and Bob Griffiths for useful ideas and advice. This work was conducted on a multinode AMD compute cluster that was bought with a grant awarded by the Wolfson Foundation to Peter Donnelly, without which it could not have been completed. D.J.W. is funded by the Biotechnology and Biological Sciences Research Council. The program omegaMap can be downloaded from www. danielwilson.me.uk.
LITERATURE CITED
Anisimova, M., J. P. Bielawskiand Z. Yang, 2001 Accuracy and
power of the likelihood ratio test in detecting adaptive molecular evolution. Mol. Biol. Evol.18:1585–1592.
Anisimova, M., J. P. Bielawskiand Z. Yang, 2002 Accuracy and
power of Bayes prediction of amino acid sites under positive se-lection. Mol. Biol. Evol.19:950–958.
Anisimova, M., R. Nielsenand Z. Yang, 2003 Effect of
recombina-tion on the accuracy of the likelihood method for detecting pos-itive selection at amino acid sites. Genetics164:1229–1236.
Awadalla, P., 2003 The evolutionary genomics of pathogen
recom-bination. Nat. Rev. Genet.4:50–60.
Bishop, J. G., A. M. Deanand T. Mitchell-Olds, 2000 Rapid
evo-lution in plant chitinases: molecular targets of selection in plant-pathogen coevolution. Proc. Natl. Acad. Sci. USA97:5322–5327.
Bollback, J. P., 2002 Bayesian model adequacy and choice in
phy-logenetics. Mol. Biol. Evol.19:1171–1180.
Bollback, J. P., 2005 Posterior mapping and posterior predictive
distributions, pp. 439–462 inStatistical Methods in Molecular Evolu-tion, edited by R. Nielsen. Springer-Verlag, New York.
deOliveira, T., M. Salemi, M. Gordon, A. Vandamme, E. J.van
Rensburget al., 2004 Mapping sites of positive selection and amino
acid diversification in the HIV genome. Genetics167:1047–1058. Derrick, J. P., R. Urwin, J. Suker, I. M. Feaversand M. C. J. Maiden,
1999 Structural and evolutionary inference from molecular var-iation in Neisseria porins. Infect. Immun.67:2406–2413.
Drummond, A. J., O. G. Pybus, A. Rambaut, R. Forsbergand A. G.
Rodrigo, 2003 Measurably evolving populations. Trends Ecol.
Evol.18:481–488.
Fearnhead, P., and P. Donnelly, 2001 Estimating recombination
rates from population genetic data. Genetics159:1299–1318.
Felsenstein, J., 1981 Evolutionary trees from DNA sequences: a
maximum likelihood approach. J. Mol. Evol.17:368–376. Filip, L. C., and N. I. Mundy, 2004 Rapid evolution by positive Darwinian
selection in the extracellular domain of the abundant lymphocyte protein CD45 in primates. Mol. Biol. Evol.21:1504–1511. Ford, M. J., 2001 Molecular evolution of transferrin: evidence for
positive selection in salmonids. Mol. Biol. Evol.18:639–647.
Goldman, N., and Z. Yang, 1994 A codon-based model of
nucleo-tide substitution for protein-coding DNA sequences. Mol. Biol. Evol.11:725–736.
Green, P. J., 1995 Reversible jump Markov chain Monte Carlo
com-putation and Bayesian model determination. Biometrika 82:
711–732.
Griffiths, R. C., and P. Marjoram, 1997 An ancestral
recombina-tion graph, pp. 257–270 inProgress in Population Genetics and Human Evolution, edited by P. Donnellyand S. Tavare. Springer-Verlag,
Berlin/Heidelberg, Germany/New York.
Grimmett, G., and D. Stirzaker, 2001 Probability and Random
Hudson, R. R., 1983 Properties of a neutral allele model with
intra-genic recombination. Theor. Popul. Biol.23:183–201.
Hudson, R. R., and N. L. Kaplan, 1985 Statistical properties of the
number of recombination events in the history of a sample of DNA-sequences. Genetics111:147–164.
Huelsenbeck, J. P., and K. A. Dyer, 2004 Bayesian estimation of
positively selected sites. J. Mol. Evol.58:661–672.
Jolley, K. A., J. Kalmusova, E. J. Feil, S. Gupta, M. Musileket al.,
2000 Carried meningococci in the Czech Republic: a diverse re-combining population. J. Clin. Microbiol.38:4492–4498. Jolley, K. A., D. J. Wilson, P. Kriz, G. McVeanand M. C. J. Maiden,
2005 The influence of mutation, recombination, population history, and selection on patterns of genetic diversity inNeisseria meningitidis.Mol. Biol. Evol.22:562–569.
Kingman, J. F. C., 1982 On the genealogy of large populations.
J. Appl. Probab.19A:27–43.
KosakovskyPond, S. L., and S. D. Frost, 2005 Not so different
after all: a comparison of methods for detecting amino-acid sites under selection. Mol. Biol. Evol.22:1208–1222.
Kuhner, M. K., J. Yamatoand J. Felsenstein, 2000 Maximum
likeli-hood estimation of recombination rates from population data. Genetics156:1393–1401.
Li, N., and M. Stephens, 2003 Modeling linkage disequilibrium
and identifying recombination hotspots using single-nucleotide polymorphism data. Genetics165:2213–2233.
Martz, E., 2002 Protein explorer: easy yet powerful
macromolecu-lar visualization. Trends Biochem. Sci.27:107–109.
Massingham, T., and N. Goldman, 2005 Detecting amino acid sites
under positive selection and purifying selection. Genetics169:
1753–1762.
McVean, G., P. Awadallaand P. Fearnhead, 2002 A
coalescent-based method for detecting and estimating recombination from gene sequences. Genetics160:1231–1241.
McVean, G. A. T., S. R. Myers, S. Hunt, P. Deloukas, D. R. Bentley et al., 2004 The fine-scale structure of recombination rate vari-ation in the human genome. Science304:581–584.
Meng, X.-L., 1994 Posterior predictiveP-values. Ann. Stat.22:1142–
1160.
Meunier, J., and A. Eyre-Walker, 2001 The correlation between
linkage disequilibrium and distance: implications for recombina-tion in hominid mitochondria. Mol. Biol. Evol.18:2132–2135. Minin, V. N., K. S. Dorman, F. Fangand M. A. Suchard, 2005 Dual
multiple change-point model leads to more accurate recombina-tion detecrecombina-tion. Bioinformatics21:3034–3042.
Mondragon-Palomino, M., B. C. Meyers, R. W. Michelmoreand
B. S. Gaut, 2002 Patterns of positive selection in the complete
NBS-LRR gene family ofArabidopsis thaliana.Genome Res.12:
1305–1315.
Moury, B., 2004 Differential selection of genes of cucumber mosaic
virus subgroups. Mol. Biol. Evol.21:1602–1611.
Nakamura, Y., T. Gojoboriand T. Ikemura, 2000 Codon usage
tab-ulated from international DNA sequence databases: status for the year 2000. Nucleic Acids Res.28:292.
Nielsen, R., and J. P. Huelsenbeck, 2002 Detecting positively
selected amino acid sites using posterior predictive p-values, pp. 576–588 in Pacific Symposium on Biocomputing, Proceedings, edited by R. B. Altman, A. K. Dunker, L. Hunter, K. Lauderdale
and T. E. Klein. World Scientific, Singapore.
Nielsen, R., and Z. Yang, 1998 Likelihood models for detecting
positively selected amino acid sites and applications to the HIV-1 envelope gene. Genetics148:929–936.
Parkhill, J., M. Achtman, K. D. James, S. D. Bentley, C. Churcher
et al., 2000 Complete DNA sequence of a serogroup A strain of
Neisseria meningitidisZ2491. Nature404:502–506.
Peek, A. S., V. Souza, L. E. Eguiarteand B. S. Gaut, 2001 The
in-teraction of protein structure, selection, and recombination on the evolution of the type-1 fimbrial major subunit (fimA) from
Escherichia coli.J. Mol. Evol.52:193–204.
Rubin, D. B., 1984 Bayesianly justifiable and relevant frequency
calculations for the applied statistician. Ann. Stat.12:1151–1172.
Schierup, M. H., and J. Hein, 2000 Consequences of
recombina-tion on tradirecombina-tional phylogenetic analysis. Genetics156:879–891.
Shriner, D., D. C. Nickle, M. A. Jensenand J. I. Mullins, 2003
Po-tential impact of recombination on sitewise approaches for de-tecting positive natural selection. Genet. Res.81:115–121. Smith, N. H., J. M. Smithand B. G. Spratt, 1995 Sequence evolution
of theporBgene ofNeisseria gonorrhoeaeandNeisseria meningitidis— evidence of positive Darwinian selection. Mol. Biol. Evol.12:363–370.
Stumpf, M. P. H., and G. A. T. McVean, 2003 Estimating
recombina-tion rates from popularecombina-tion-genetic data. Nat. Rev. Genet.4:959–968.
Suchard, M. A., R. E. Weiss, K. S. Dormanand J. S. Sinsheimer,
2002 Oh brother, where art thou? A Bayes factor test for recom-bination with uncertain heritage. Syst. Biol.51:715–728.
Swanson, W. J., R. Nielsenand Q. Yang, 2003 Pervasive adaptive
evolution in mammalian fertilization proteins. Mol. Biol. Evol.
20:18–20.
Tajima, F., 1989 Statistical method for testing the neutral mutation
hypothesis by DNA polymorphism. Genetics123:585–595.
Twiddy, S. S., C. H. Woelkand E. C. Holmes, 2002 Phylogenetic
evidence for adaptive evolution of dengue viruses in nature. J. Gen. Virol.83:1679–1689.
Urwin, R., E. C. Holmes, A. J. Fox, J. P. Derrickand M. C. J. Maiden,
2002 Phylogenetic evidence for frequent positive selection and recombination in the meningococcal surface antigen PorB. Mol. Biol. Evol.19:1686–1694.
Wakeley, J., and N. Aliacar, 2001 Gene genealogies in a
meta-population. Genetics159:893–905.
Wilson, D. J., D. Falushand G. Mcvean, 2005 Germs, genomes
and genealogies. Trends Ecol. Evol.20:39–45.
Winckler, W., S. R. Myers, D. J. Richter, R. C. Onofrio, G. J.
Mcdonaldet al., 2005 Comparison of fine-scale recombination
rates in humans and chimpanzees. Science308:107–111. Wong, W. S., Z. Yang, N. Goldmanand R. Nielsen, 2004 Accuracy
and power of statistical methods for detecting adaptive evolution in protein coding sequences and for identifying positively se-lected sites. Genetics168:1041–1051.
Yang, Z., 1997 PAML: a program package for phylogenetic analysis
by maximum likelihood. Comput. Appl. Biosci.13:555–556. Yang, Z., and W. J. Swanson, 2002 Codon-substitution models to
de-tect adaptive evolution that account for heterogeneous selective pressures among site classes. Mol. Biol. Evol.19:49–57. Yang, Z., R. Nielsen, N. Goldmanand A. M. Pedersen, 2000
Codon-substitution models for heterogeneous selection pressure at amino acid sites. Genetics155:431–449.
Communicating editor: J. Wakeley
APPENDIX A: MUTATION MODEL
Liand Stephens(2003) use a hidden Markov model (HMM) to model the sampling distribution of haplotypes in
the presence of recombination. Under the model, theðk11Þth haplotype is a mosaic copy of the firstkhaplotypes. The latent variable of the HMM records which of the first khaplotypes the ðk11Þth is a copy of at a given site. Conditional on the latent variable, the emission probability gives the probability of observing stateHk11;i at sitei.
Informally, we think of the latent variable as recording the haplotype that is the least distant in the evolutionary tree at that site (call this haplotypex,x¼1;2;. . .;k). Under a coalescent model (Kingman1982; Hudson1983), the time
(in units of PNe generations) to the common ancestor of haplotypes x and k11 is known (R. C. Griffiths,
unpublished data) and to the order of the approximation is exponentially distributed with ratek.
Leta ¼Hk11;i andb¼Hx;i. The probability of observing a pair of statesða;bÞgiven the timetto their common ancestor for a reversible mutation rate matrix is
Pða;bjtÞ ¼dabpapabð2tÞ; ðA1Þ where
dab¼ 1 fora ¼b 2 fora 6¼b;
ðA2Þ
andpðtÞis the transition probability matrix. The transition probability can be solved numerically (
e.g., Grimmettand
Stirzaker2001), so
Pða;bjtÞ ¼dabpaX
c2C
vacvcbð1Þexpf2dctg; ðA3Þ
whereCrepresents the possible states (in our case 61 codons),vis a matrix of eigenvectors of the mutation rate matrix,
v1is its inverse, anddis a vector of the corresponding eigenvalues. Thus using the coalescent model for the timet, we
can obtain an expression for the HMM emission probability under any reversible mutation model:
Pða;bÞ ¼
ð‘
0
Pða;bjtÞPðtÞdt¼dabpaX
c2C
vacvcbð1Þ k
k2dc: ðA4Þ
To be able to handle indels, we use a very simple extension of NY98 in which there is an extra indel state. This model is applied only to sites in the alignment that are segregating for an indel. Codons mutate to the indel state at rate
pindelfvand back at rateð1pindelÞfv. Herepindelis the equilibrium frequency of indels (in sites segregating for indels),fis the rate of insertion/deletion, andvis the selection parameter for the block containing that site. The motivation for using this model is to capture the information regarding the underlying tree structure and mode of selection at sites segregating for indels, in the simplest possible way.
APPENDIX B: MCMC MOVES
In the MCMC scheme we use standard Metropolis–Hastings moves to changemandk, which are of the same form as move A below. To explore the block structure for the variation in the selection parameter we have four moves. Moves A and B are Metropolis–Hastings moves, while moves C and D are complementary reversible-jump moves (Green1995).
The moves for exploring the recombination rate are of the same form as those described here. For the purpose of illustration, we use an exponential prior forvwith rate parameterl.
Move A—changevwithin a block:A new valuev9is chosen so thatv9¼vexpðUÞ, whereUUniform(1, 1). The acceptance probability is
aAðQ/Q9Þ ¼min 1;PðHjQ9Þ
PðHjQÞexpflðv9vÞg
v9 v
: ðB1Þ
Move B—extend a block 59 or 39: The block to extend is chosen uniformly at random, and for each block the direction is chosen with equal probability. If the 59-most or the 39-most block is chosen to be extended 59or 39, respectively, the move is rejected. The number of sites to extend the block,g 2 ½1; ‘Þis chosen from a geometric distribution with some parameter. If extending the blockgsites in the chosen direction would cause it to merge with the adjacent block, the move is rejected. The acceptance probability is
aBðQ/Q9Þ ¼min 1;PðHjQ9Þ
PðHjQÞ
: ðB2Þ
Following Green(1995), when there areBtransition points, moves C and D are proposed with relative probabilitiescB
anddB, where
cB dB
¼min 1f ;PðB11Þ=PðBÞg min 1f ;PðB1Þ=PðBÞg:
v9ðs*sjÞ
j v9
ðsj11s*Þ
j11 ¼v
ðsj11sjÞ
j
and
v9j11
v9j ¼
1U U ;
whereUUniform(0, 1). The acceptance probability is
aCðQ/Q9Þ ¼min 1;PðHjQ9Þ
PðHjQÞ
pvlelðv9j1v9j11Þ
ð1pvÞelðvjÞ
dB11ðLB1Þ
cBðB11Þ
ðv9j1v9j11Þ2 vj
( )
: ðB3Þ
Move D—merge a block:One of the 59-mostBblocks is chosen uniformly at random to merge with its 39neighbor. The parameter for the merged blockv9jis chosen from the current blocks’ parametersvj andvj11so that
v9ðsj12sjÞ
j ¼v
ðsj11sjÞ
j v
ðsj12sj11Þ
j11 and the acceptance probability is
aDðQ/Q9Þ ¼min 1;PðHjQ9Þ
PðHjQÞ
ð1pvÞelðv9jÞ
pvlelðvj1vj11Þ
cB1B dBðLBÞ
v9j ðvj1vj11Þ2
( )
: ðB4Þ
APPENDIX C: COMBININGP-VALUES
From the posterior distribution of parameters we simulate a large number of data sets, M. For any particular discrepancy statistic we can calculate a marginal posterior predictiveP-value using Equation 9. TheP-value is made two-tailed in the usual way. To combine two-two-tailed P-values for N different discrepancy statistics, denote the vector of discrepancy statistics for data setj:
Dj ¼ ðD1j;D2j;. . .;DNjÞ: ðC1Þ Transform the marginal distribution of each discrepancy statistic i (Di1;Di2;. . .;DiM) into a standard normal distribution, so that
Zij¼F1 Wij11 M11
; ðC2Þ
whereWijis the marginal rank (with respect toj) of discrepancy statisticDij, andF1is the quantile function (inverse cumulative distribution function) for the standard normal distribution. We then assume that the joint distribution of
Zj¼ Z1j;Z2j;. . .;ZNj
is multivariate normal with zero mean and variance–covariance matrixS, where
Skl ¼ rkl ifk6¼l 1 ifk¼l;
ðC3Þ
whererklis the correlation coefficient between the transformed discrepancy statisticskandl(ZkjandZlj) over data sets j. Next transformZjto remove the correlation structure
Yj¼L1Zj; ðC4Þ
whereLis obtained from the matrix factorization
S¼LLT: ðC5Þ
Include the observed values of the discrepancy statisticsDHin the above procedure to obtainYH. Assuming that the uncorrelated transformed discrepancy statistics are independent, then
Xj ¼X N
i¼1
Yij2 ðC6Þ
has a chi-squared distribution withNdegrees of freedom. This can be verified by a histogram of theXj’s. A one-tailed chi-square test ofXHcombines the two-tailed posterior predictiveP-values.