ISSN(Online) : 2319-8753 ISSN (Print) : 2347-6710
I
nternational
J
ournal of
I
nnovative
R
esearch in
S
cience,
E
ngineering and
T
echnology
(An ISO 3297: 2007 Certified Organization)
Vol. 5, Issue 8, August 2016
Prediction of Air Pollutants Dispersion
Emitted from Point and Line Sources along
the Highway Passing Through Industrial Area
of Mysuru- AERMOD and CALINE4 Models
B. M. Prakash1, M. Mahadevaswamy2, S. Mahesh3, N. Vishala4
Environmental Officer, Karnataka State Pollution Control Board, Chamarajanagara, Karnataka, India1 Professor, Dept. of Environmental Engineering, S. J. College of Engineering, Mysuru, Karnataka, India2,3 P.G. Student, Dept. of Environmental Engineering, S. J. College of Engineering, Mysuru, Karnataka, India4
ABSTRACT: Highway passing through the industrial area of Mysuru constantly experiences emissions from vehicles
and industries situated in close proximity to the highway. Prediction of the seasonal variations on the air pollutants concentrations at three receptor locations along the highway contributed from line source; point sources, and combined line and point sources using CALINE4 and AERMOD air pollutant dispersion models, respectively, have been studied.CALINE4 model predicted PM10 concentration was found to be in good agreement when compared with monitored values showing R2 value of 0.943, whereas, the model marginally underpredicted NOx concentration with R2 value of0.901. Further, CALINE4 model was sensitive to changes in wind speed. At location 2, the measured PM10concentration of 140.5 µg/m3was found to be maximum during summer season, which was mainly due to vehicular emission sources. The AERMOD predicted PM10, NOx and SO2 pollutants concentration emitted from point sources at different averaging time periods were found to be within the NAAQ Standards. AERMOD was found to be underpredicted the PM10 concentration contributed from combined point and line sources with R2 value of 0.260.Maximum contribution of PM10 and NOxconcentration wasfound to be from vehicular sources when compared to industrial sources at the receptor locations.
KEYWORDS: Particulate matter, Sulfur dioxide, Nitrogen Oxide, Ambient Air Quality Monitoring,CALINE4 model,
AERMOD
I. INTRODUCTION
ISSN(Online) : 2319-8753 ISSN (Print) : 2347-6710
I
nternational
J
ournal of
I
nnovative
R
esearch in
S
cience,
E
ngineering and
T
echnology
(An ISO 3297: 2007 Certified Organization)
Vol. 5, Issue 8, August 2016
and MOBILE 6.2 (Motor Vehicle Emissions Factor Model).The recent Gaussian based air pollutant dispersion models like AERMOD and CALINE4 are the widely used models for urban air quality studies.
II. RELATED WORK
Ambient air quality is one of the most severe environmental concerns in urban areas around the world, particularly in developing countries such as India, China, Africa etc. To assess the impact on the ecosystem from various emission sources, air quality monitoring and air quality modeling studies are required. In the past, many researchers have conducted ambient air quality monitoring studies of various cities / towns to measure the impact of major air pollutants such as, NOx, SO2, particulate matter, CO, etc. on the environment.Ambient Air Quality Monitoring (AAQM) was carried out in Madurai city, Tamilnadu, India over a period of one year to measure the level of air pollutants such as PM10 and lead (Pb) contributed from various sources (vehicles, industries, diesel based electricity generators, burning biomass for cooking) in the city [1]. The results indicated, PM10 concentrations found to be maximum during summer season and minimum during monsoon season. It was due to the photochemical reactions in summer season which produced peak PM10 concentration.AERMOD was used to predict NO2 concentration at two places in Delhi wherein four emission sources namely power plants, vehicles, industries and household sectors was chosen. It was stated, as the averaging period increased, predictions of AERMOD became better [10]. Hence, at both stations, predicted and observed values of NO2 showed a good agreement with 24 hour period than for 1 hour and 8 hour. Further, CALINE4 model was used to predict NOx and PM10 concentrations from vehicular sources along the highway in Mysuru. The results indicated that, model results were found to be in good agreement with monitored data [11]. Dispersion modeling on PM2.5, NOx and SO2 from point and major line source emissions was conducted using AERMOD. Model Results showed the validity of using AERMOD to estimate surface impact of major point and line sources in complex terrain, differing land use patterns and large variability in annual meteorology [4]. From the above it is observed that, vehicular and industrial source of emissions are highly contributing to air pollution in urban areas. In the present investigation, it has been proposed to validate the field monitored results with that of CALINE4 (for line source) and AERMOD (for point source and combined point and line source) air quality dispersion model results along the highway passing through the Industrial area of Mysuru, India.
III. METHODOLOGY
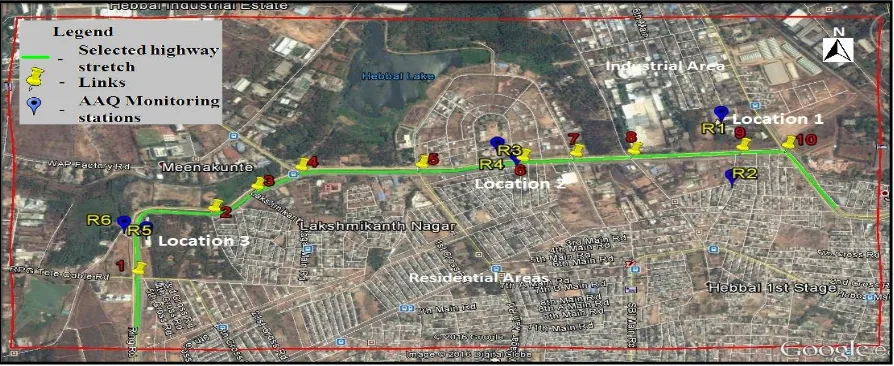
Mysuru is an emerging second metropolitan city of Karnataka state, India, with a population of about 10.25 lakhs.On the Contrary, due to increase in the developmental activities, the ambient air quality in Mysuru is gradually getting deteriorated. There will be continuous movement of vehicles in the ring road which represents the outskirts of Mysuru city. The highway (Bengaluru - Mercara) which connects ring road passes through the industrial area in Northwestern part of Mysuru which is about 7 Km from the heart of the city. In the present study, AAQM was carried out at three selected locations along the highway stretch passing through the industrial area of Mysuru shown in Figure 1.
ISSN(Online) : 2319-8753 ISSN (Print) : 2347-6710
I
nternational
J
ournal of
I
nnovative
R
esearch in
S
cience,
E
ngineering and
T
echnology
(An ISO 3297: 2007 Certified Organization)
Vol. 5, Issue 8, August 2016
Airquality modeling using CALINE4 and AERMOD model
In order to predict the ambient air pollutant concentration for PM10 and NOx contributed from vehicular emission along the highway passing through industrial area in Mysuru, CALINE4 Model was used. 8 hour, daily and seasonal variation in the concentration of PM10 and NOx in the atmosphere were estimated and the type of vehicular sources include : 2 wheelers (2w); 3 wheelers (3w); 4 wheelers (4w - Cars) and heavy duty vehicles (HDV). CALINE4 is the fourth generation simple Gaussian dispersion model which predicts the ambient air pollutant concentrations upto 500 m from the roadway [9]. The highway stretch was divided into a series of 10 links (Figure 1). The emission factors specified by Automotive Research Association of India (ARAI) were used to calculate the weighted emission factors [2,12] for predicting the ambient air pollutant concentrations. The vehicular count was taken with the help of a cctv camera footage which was fixed at a commercial building situated along the highway. The other model input parameters include: wind speed, wind direction, mixing height, stability class, road geometry and receptor locations.
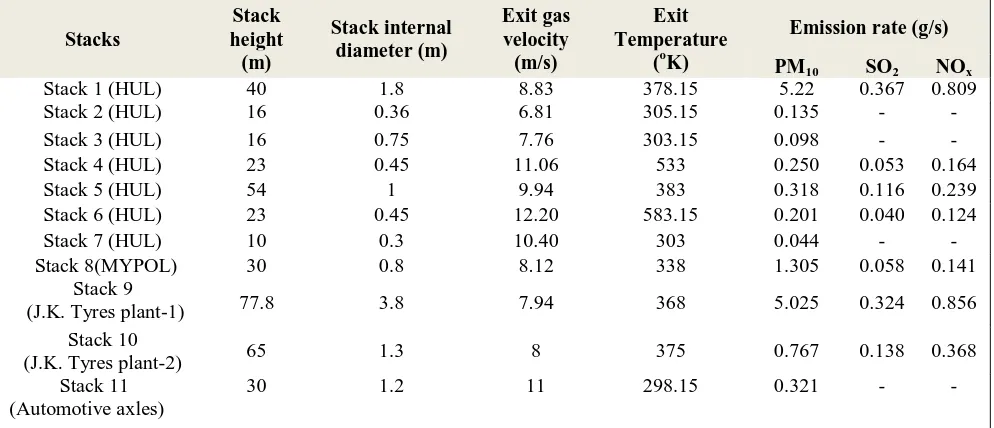
AERMOD (American meteorological society Environment protection agency Regulatory dispersion Model) is the recent air pollution dispersion model which is an improved version of ISCST3 (Industrial Source Complex Short Term model 3) model. It can predict pollutant concentration upto 50 Km [6]. In the present study, AERMOD model was used to predict the air pollutant concentrations such as PM10, SO2 and NOx and the variation in pollutants concentrations during 8 hr, 24 hr and seasonal averaging time intervals was also studied for point sources. AERMOD was also used to predict PM10 concentration from combined point as well as line sources for 8 hr and seasonal averaging time intervals. The emitted pollutant sources were from large scale industries (point sources) which are situated near the highway (Figure 2). Five major industries identified in the study area include: Hindustan Unilever limited (HUL - P1); Mysore Polymers (Mypol - P2); J.K. tyre plant-1 (P3); J.K. tyre plant-2 (P4) and Automotive Axles Pvt. Ltd. (P5). Stack emission characteristics data were collected from Karnataka State Pollution Control Board, Mysuru (KSPCB-Mysuru) shown in Table 1 which have been used as input into the model equation. Emission rate for each pollutant was estimated as a product of flowrate and pollutant concentration [5]. The study area was divided into grids of uniform spacing of 1 km × 1 km by selecting uniform Cartesian coordinate in the model with a total area of 20 km × 20 km. The meteorological data for the study area was generated by AERMET (AERMOD’s meteorological data preprocessor). AERMAP (AERMOD’s terrain data preprocessor) was used to get the topographical elevation data of the study area obtained from U.S. Geological Survey (USGS) digital elevation dataset which have been input to the model.
ISSN(Online) : 2319-8753 ISSN (Print) : 2347-6710
I
nternational
J
ournal of
I
nnovative
R
esearch in
S
cience,
E
ngineering and
T
echnology
(An ISO 3297: 2007 Certified Organization)
Vol. 5, Issue 8, August 2016
Meteorological data
Daily actual observed meteorological data such as temperature, wind speed, wind direction and relative humidity was obtained from the website www.imdagrimet.gov.in. Hourly wind speed, wind direction and precipitation data was
obtained from the website www.wunderground.com and used in plotting monthly wind rose diagrams. Table 1: Industrial Stacks Characteristics
(Source: KSPCB-Mysuru)
IV. FIELD EXPERIMENTAL RESULTS
Vehicular Traffic Density
Results of vehicular traffic study showed that, the study area majorly comprised of 2w fleet followed by the 4w, HDV and 3w. A plot of daily variation in traffic volume of different category of vehicles against time was made shown in Figure 3. The average number of all the vehicles on a weekday was observed to be 25,000 to 27,000. The daily peak traffic flow was observed between 09:00 am and 11:00 am and, 17:00 pm and 20:00 pm. During morning hours, from 1:00 am to 5:00 am, more number of HDV were observed than other categories of vehicles which is mainly due to supply of raw materials to the industries which are located along the highway [11].
Meteorological Observations
Wind rose plots showed that, the wind direction changed over the study area seasonally. The wind blew from East and Northeast directions during winter season and from West and Southwest in monsoon season. During summer season, wind direction was found to be variable, which changed from East to Southeast and Southwest. The average wind speed during winter, summer and monsoon seasons were found to be 1.87 m/s, 2.62 m/s and 4.17 m/s, respectively. The temperature was maximum during summer season which found to be 39.9°C in the month of April and the minimum temperature of 10.6°C was found to be in the month of January during winter season. Minimum relative humidity of about 22 % was found in winter season whereas, maximum relative humidity of about 97 % was found to be during the warm month of May.
Stacks
Stack height (m)
Stack internal diameter (m)
Exit gas velocity
(m/s)
Exit Temperature
(oK)
Emission rate (g/s)
PM10 SO2 NOx
Stack 1 (HUL) 40 1.8 8.83 378.15 5.22 0.367 0.809
Stack 2 (HUL) 16 0.36 6.81 305.15 0.135 - -
Stack 3 (HUL) 16 0.75 7.76 303.15 0.098 - -
Stack 4 (HUL) 23 0.45 11.06 533 0.250 0.053 0.164
Stack 5 (HUL) 54 1 9.94 383 0.318 0.116 0.239
Stack 6 (HUL) 23 0.45 12.20 583.15 0.201 0.040 0.124
Stack 7 (HUL) 10 0.3 10.40 303 0.044 - -
Stack 8(MYPOL) 30 0.8 8.12 338 1.305 0.058 0.141
Stack 9
(J.K. Tyres plant-1) 77.8 3.8 7.94 368 5.025 0.324 0.856
Stack 10
(J.K. Tyres plant-2) 65 1.3 8 375 0.767 0.138 0.368
Stack 11 (Automotive axles)
ISSN(Online) : 2319-8753 ISSN (Print) : 2347-6710
I
nternational
J
ournal of
I
nnovative
R
esearch in
S
cience,
E
ngineering and
T
echnology
(An ISO 3297: 2007 Certified Organization)
Vol. 5, Issue 8, August 2016
Fig. 3. Daily variations in traffic volume along the highway stretch passing through industrial area of Mysuru.
Field Monitoring
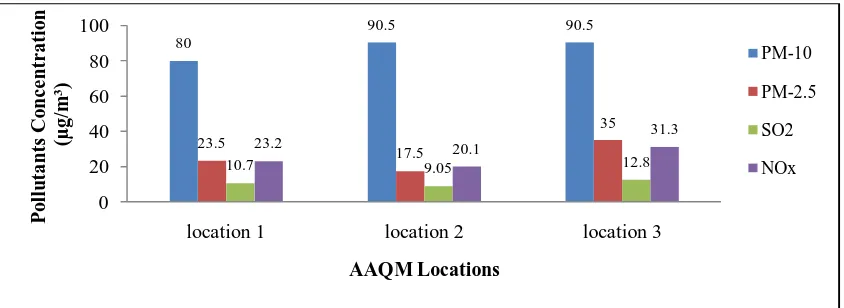
AAQM was carried out for 8 hours on different days during winter, summer and monsoon seasons at all the three identified locations along the highway. At each monitored locations two stations were established across the road to know the lateral dispersion of pollutants in the study area. The concentrations of PM10, PM2.5, SO2 and NOx were measured at the three locations viz. location 1 (near CIPET), location 2 (near V-LEAD) and Location 3 (near Sheshadripuram College) shown in the Figures 4, 5 and 6. It was found that, the average pollutant concentrations at all the three locations during winter season were found to be within the National Ambient Air Quality Standards (NAAQS), CPCB, India (Figure 4). However, PM10 concentration was found to be almost nearer to the limiting concentration of 100 µg/m3. This was due to the reduced mixing height observed during winter season which builds the pollutant concentrations near the ground level and thereby increases in the PM10 concentration.
Fig. 4. Graph showing the results of AAQM conducted during winter season.
The PM10 concentration at location 1 and 2 was found to exceed the (NAAQS) during summer season (Figure 5) which may primarily due to photochemical reactions in the atmosphere [1]. Infact, the meteorology and source strength also influenced the pollutant concentrations. Heavy vehicular movement during summer season when compared to other seasons might have added to the pollutant concentration due to vehicular emissions. It was also due to frequent variation in wind direction during summer season which influenced some of the Industrial sources (P2, P3 and P4) emissions located on upwind of all three receptor locations. During monsoon season, less concentrations of
0 200 400 600 800 1000 1200 1400
1 2 3 4 5 6 7 8 9 10 11 12 13 14 15 16 17 18 19 20 21 22 23 24
V eh ic u lar t raf fi c v o lu m e (N u m b er s) Time (Hours) 2 wheelers 3 wheelers 4 wheelers Heavy duty vehicles 80 90.5 90.5 23.5 17.5 35
10.7 9.05 12.8
23.2 20.1 31.3
0 20 40 60 80 100
location 1 location 2 location 3
ISSN(Online) : 2319-8753 ISSN (Print) : 2347-6710
I
nternational
J
ournal of
I
nnovative
R
esearch in
S
cience,
E
ngineering and
T
echnology
(An ISO 3297: 2007 Certified Organization)
Vol. 5, Issue 8, August 2016
PM10 was found at monitoring stations (Figure 6) due to the precipitation which scavenged the particulate matters to the ground and also high wind velocities caused turbulent dispersion leading to lower ground level pollutants concentration.
Fig. 5. Graph showing the results of AAQM conducted during summer season.
Fig.. 6. Graph showing the results of AAQM conducted during monsoon season.
V. AIR QUALITY DISPERSION MODELS RESULTS
Present study mainly focused on monitoring of ambient air quality for PM10 and NOx concentrations during winter, summer and monsoon seasons and validated with the CALINE4 model. Results of predicted PM10 concentrations were found to be agreeable, while the predicted NOx values were found to be marginally underpredicted by the CALINE4 model when compared to the observed values. The averaged PM10 monitored concentration observed was 83.8 µg/m3, whereas the CALINE4 predicted averaged concentration of PM10 was found to be 62.1 µg/m3. The correlation coefficient (R2) for PM10 concentration was found to be 0.943 which indicates that, the model predictions were almost in good agreement with monitored values (Figure 7a). The R2 value obtained for NOx (0.901) shows marginal underprediction by the CALINE4 model (Figure 7b). Infact, the reason for underprediction of CALINE4 model values for NOx may be due to overlapping of NOx concentrations from the industrial sources, vehicular emissions and also the presence of atmospheric NOx which was not being considered in the model. The temperature, wind speed and stability of the atmosphere was also fluctuating in the study area hourly, daily and seasonally. The maximum and minimum wind speed was observed to be varied from 1 m/s to 5.3 m/s, and the temperature in the study area ranged from 10.6°C to 39.9°C. CALINE4 model was run for varied wind speed as well as temperature for different stability class of atmosphere (1 to 7). The sensitivity analysis of CALINE4 model showed that the model predicted PM10 concentration was 132 µg/m3 at location 2 when the wind speed was 1 m/s. Similarly, the predicted PM10 concentration was found to be 37 µg/m3 at location 1 when the wind speed was 5 m/s.
106
140.5
86
21.5 24 19
13.524.25 13.6 10.1
28.2 21
0 50 100 150
location 1 location 2 location 3
P o ll u tan ts C o n c e n tr ati o n (µ g/ m 3) AAQM Locations PM-10 PM-2.5 SO2 NOx 70 49 42
12.812 12 9.3 1110.4
19 15 12.1 0 20 40 60 80
location 1 location 2 location 3
ISSN(Online) : 2319-8753 ISSN (Print) : 2347-6710
I
nternational
J
ournal of
I
nnovative
R
esearch in
S
cience,
E
ngineering and
T
echnology
(An ISO 3297: 2007 Certified Organization)
Vol. 5, Issue 8, August 2016
Fig. 7. Plot of correlation coefficient between measured and CALINE4 predicted pollutants concentrations (a) PM10(b) NOx
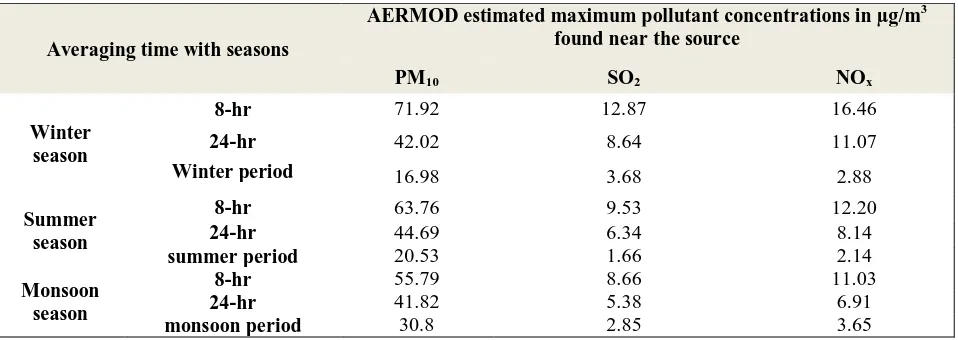
The results of AERMOD predicted for PM10, NOx and SO2 concentrations from point emission sources were conformed to NAAQ Standards at all three receptor locations. It was observed that, the predicted concentration of pollutants varied from source to receptor locations. The 8 hr predicted PM10, SO2 and NOx concentrations averaged over all three receptor locations during winter, summer and monsoon seasons were found to be 16.67 µg/m3, 17.04 µg/m3 and 11.7 µg/m3; 1.57 µg/m3, 2.93 µg/m3 and 2.25 µg/m3; and 2 µg/m3, 3.31 µg/m3 and 2.05 µg/m3, respectively. Therefore, AERMOD predicted 8 hr average pollutant concentrations was found to be very less at the receptor locations than found at the source (Table 2) and it was also found to be less when compared to the 8-hr monitored values. Similarly, 24 hr and the seasonal average pollutants concentration were found to be less at the receptor locations. The high PM10 concentration (30.8 µg/m3) during monsoon season (Table 2) was due to the shorter averaging time period (i.e., between 1st June and 10th July, 2016) being considered while modeling, whereas three months average time was considered for summer (March, April and May, 2016) and two months average for winter seasons (January and February, 2016).
AERMOD model estimated air pollutant concentrations of PM10, SO2 and NOx near the source at different averaging time are presented in Table 2. From Table 2 it is observed that, the predicted pollutants concentrations by AERMOD became accurate when the averaging time period increased from 8 hr to the seasonal averaging.
Table 2: AERMOD model estimated maximum air pollutant concentrations near the source at different averaging time
Averaging time with seasons
AERMOD estimated maximum pollutant concentrations in µg/m3
found near the source
PM10 SO2 NOx
Winter season
8-hr 71.92 12.87 16.46
24-hr 42.02 8.64 11.07
Winter period 16.98 3.68 2.88
Summer season
8-hr 63.76 9.53 12.20
24-hr 44.69 6.34 8.14
summer period 20.53 1.66 2.14
Monsoon season
8-hr 55.79 8.66 11.03
24-hr 41.82 5.38 6.91
monsoon period 30.8 2.85 3.65
y = 0.738x + 0.342 R² = 0.943
0 20 40 60 80 100 120
0 50 100 150
C A LI N E4 P r e d ic te d P M 10 c o n c e n tr ati o n (µ g/ m 3)
Measured PM10 concentration (µg/m3)
y = 0.632x + 3.642 R² = 0.901
0 5 10 15 20 25 30
0 20 40
C A LI N E4 p r e d ic te d N Ox C o n c e n tr ati o n (µ g/ m 3)
Measured NOxconcentration (µg/m3)
ISSN(Online) : 2319-8753 ISSN (Print) : 2347-6710
I
nternational
J
ournal of
I
nnovative
R
esearch in
S
cience,
E
ngineering and
T
echnology
(An ISO 3297: 2007 Certified Organization)
Vol. 5, Issue 8, August 2016
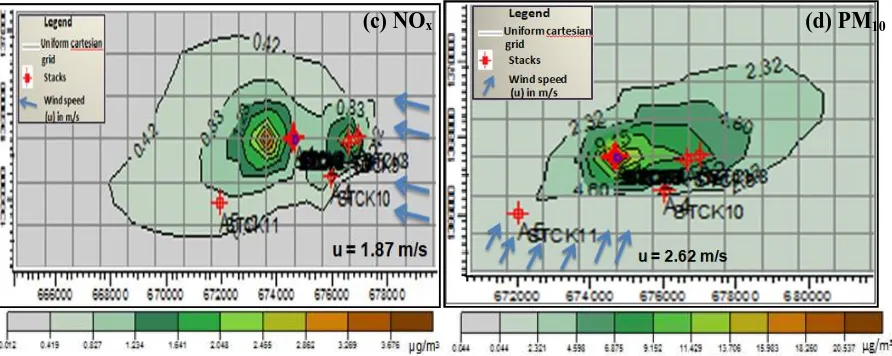
AERMOD predicted surface concentration of PM10, SO2 and NOx during winter, summer and monsoon seasons were estimated depicted in Figures 8, 9 and 10. Most of the time as the wind direction was from North-east (NE) and East directions during winter season, the pollutant PM10 dispersed towards west and west-south-west (WSW) directions. The PM10 concentration decreased from 16.98 µg/m3 near HUL industry to about 3.62 µg/m3 at 4 km away from HUL (Figure 8a) as was observed during winter season. Similarly, SO2 and NOx were found to disperse towards west direction during winter season (Figures 8(b) and 8(c)). Thus, during winter, some portion of the pollutants was carried towards residential areas located in the South-west (SW) part of the study area.
The average PM10 concentration for the whole summer period was found to disperse towards East-North-East (ENE) over a distance of 3.5 km from HUL and also towards west direction (2 km) of HUL shown in the Figure 8(d). The predicted SO2 and NOx concentrations during summer season were also found to get dispersed towards ENE and slightly towards west direction (Figures 9(a) and (b)). This was mainly due to the fluctuations in the wind direction which was observed during summer season. Similar observation has been made by Khare et al. (2012). Further, AERMOD will not process under calm wind conditions [3] which were observed to be more (39.28 %) during winter season. Hence, PM10 concentration during summer season was found to be higher than was observed during winter season.
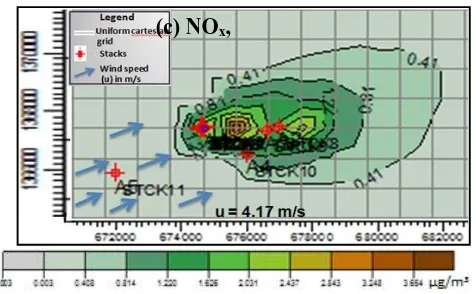
In monsoon season, the AERMOD predicted values for PM10, NOx and SO2 concentrations (Figures 10 (a), (b) and (c)) were found to be very less compared to the predicted pollutants values during winter and summer seasons. This was mainly due to the wet deposition of gaseous and particulate matter [8] emitted from stacks. The average wind speed of 4.17 m/s and the wind which blew from West-South-West (WSW) direction observed in the month of June was also a reason for the less pollutant concentration found during monsoon season. Thereby, the pollutants were carried away from the residential areas and found to get dispersed towards agriculture fields located towards NE direction of the study area during monsoon season. In all the monitored seasons, it was found that, AERMOD predicted maximum concentration of pollutants was found near to the point sources of emissions. As there is not much variation in the terrain elevation, in addition, the building downwash effects were not considered in the model [14], hence, it became favorable for the pollutants to disperse rapidly over large area.
ISSN(Online) : 2319-8753 ISSN (Print) : 2347-6710
I
nternational
J
ournal of
I
nnovative
R
esearch in
S
cience,
E
ngineering and
T
echnology
(An ISO 3297: 2007 Certified Organization)
Vol. 5, Issue 8, August 2016
Fig.8. Plots of surface concentration of pollutants estimated by AERMOD during winter season (a) PM10, (b) SO2
and (c) NOx; and summer season (d) PM10.
It was found that, the AERMOD underpredicted the pollutants concentration when compared to the monitored concentrations at all the three receptor locations. The correlation coefficient (R2) for AERMOD predicted PM10, SO2 and NOx concentrations (for point source alone)versus the corresponding observed values were found to be 0.309, 0.241 and 0.271, respectively. It is clearly indicated, the model is underpredicting all the pollutants concentration which may be due to not considering the background pollutants concentration in the model equation.
Fig. 9. Plots of surface concentration of pollutants estimated by AERMOD during summer season (a) SO2 and
(b) NOx over the study area.
(d) PM10 (c) NOx
(b) NOx (a) SO2
ISSN(Online) : 2319-8753 ISSN (Print) : 2347-6710
I
nternational
J
ournal of
I
nnovative
R
esearch in
S
cience,
E
ngineering and
T
echnology
(An ISO 3297: 2007 Certified Organization)
Vol. 5, Issue 8, August 2016
Fig. 10. Plots of surface concentration of pollutants estimated by AERMOD for monsoon season (a) PM10, (b) SO2and (c) NOx
AERMOD was also run to know the effect of combined vehicular and industrial sources on the dispersion of PM10 concentration along the highway for 8 hr and seasonal averaging time periods during winter, summer and monsoon seasons. It was found that, 8 hr predicted PM10 concentrations averaged over all three receptor locations during winter, summer and monsoon periods were found to be 28.69 µg/m3, 53.62µg/m3 and 13.96 µg/m3, respectively which is well within the NAAQ Standards of 100 µg/m3. It is observed from the Table 3 that, maximum 8 hr predicted PM10 concentration was found to be during summer season, which may be due to the photochemical reactions of the pollutants further leads to more ground level PM10 concentration. During seasonal averaging time period, the predicted maximum PM10 concentration (26.46 µg/m
3 ) during summer season was found to be less when compared to during winter and monsoon seasons. This may be due to longer averaging time of three months (March, April and May) was considered for summer season when compared to winter (two months) and monsoon seasons (1 month and 10 days).
The AERMOD results as indicated in Table 3 showed high PM10 concentration when combined point and line sources are considered. However, PM10 concentration showed lower values when only point sources considered. It indicate that, vehicular emission will have significant impact on the industrial air quality. Further, R2 value of the AERMOD model predicted PM10 concentration for combined point and line sources versus the observed value was found to be 0.260, which indicated AERMOD is underpredicting the PM10 concentrations at the receptor locations. This may also be due to not considering the background PM10 concentration in the model equation for the study area.
Table 3: AERMOD estimated maximum pollutant concentrations from combinedpoint and line sources at different averaging time
Averaging time with seasons AERMOD estimated maximum PM10 pollutant
concentrations in µg/m3 found near the source
Winter season 8hr 105.37
Winter period 35.81
Summer season 8hr 151.92
summer period 26.46
Monsoon season
8hr 94.74
monsoon period
ISSN(Online) : 2319-8753 ISSN (Print) : 2347-6710
I
nternational
J
ournal of
I
nnovative
R
esearch in
S
cience,
E
ngineering and
T
echnology
(An ISO 3297: 2007 Certified Organization)
Vol. 5, Issue 8, August 2016
Further, from the Table 4, it was found that, the dominant source of PM10 contribution over the receptors at the study area is from vehicular source as predicted from CALINE4 model during all the seasons studied and very less contribution was observed from the industrial sources as predicted from AERMOD model which found to be 16.26 %, 15.5 % and 21.80 % during winter, summer and monsoon seasons, respectively. Similarly the vehicles are the dominant source of NOx emitters in the study area when compared to industrial sources whose percentage contribution from vehicular source and that from industrial sources are presented in Table 5.Therefore,vehicles are considered to be the dominant sources contributing to thePM10and NOx concentrations over the study area.
Table4: Seasonal variation in PM10 concentration contributed from vehicular and industrial sources along the study area.
Seasons
PM10 concentration (µg/m3)
averaged over the study area as estimated by CALINE4 and
AERMOD models
Observed PM10
concentration(µg/
m3) averaged
over the study area
Percentage contribution of PM10
concentration
Vehicular source Industrial source From vehicular source
From industrial source
Winter 58.71 14.15 87 67.48 % 16.26 %
Summer 86.7 17.18 110.8 78.2 % 15.5 %
monsoon 41.3 11.7 53.6 77.05 % 21.8 %
Table5: Seasonal variation in NOx concentration contributed from vehicular andindustrial sources along the study area.
Seasons
NOx concentration (µg/m3) averaged
over the study area as estimated by CALINE4 and AERMOD models
Observed NOx
concentration(µg/
m3) averaged
over the study area
Percentage contribution of NOx
concentration
Vehicular source Industrial source
From vehicular source
From industrial source
Winter 19.23 2.08 24.85 77.3 % 8 %
Summer 18.5 3.24 24.50 76.19 % 13.28 %
monsoon 14.13 2.06 15.4 91.75 13.37 %
VI. CONCLUSION
ISSN(Online) : 2319-8753 ISSN (Print) : 2347-6710
I
nternational
J
ournal of
I
nnovative
R
esearch in
S
cience,
E
ngineering and
T
echnology
(An ISO 3297: 2007 Certified Organization)
Vol. 5, Issue 8, August 2016
concentration in the model equation. Maximum contribution of pollutants such as PM10 and NOx at the receptor locations along the highway was from vehicular emissions in all three seasons.
ACKNOWLEDGMENT
The authors would like to acknowledge KSPCB-Mysuru, M/s. Ganesh Consultancy, Mysuru and M/s. Aqua Tech Enviro Engineers, Bengaluru, India who have contributed to the successful completion of the project.
REFERENCES
1. Bhaskar, B. V., JebaRajasekhar, R. V., Muthusubramanian, P., and Kesarkar, A. P., “Measurement and modeling of respirable particulate (PM10) and lead pollution over Madurai, India”, Air Quality and Atmospheric Health, Vol.1, pp. 45-55, 2008.
2. Chadetrik, R., Sunil G., and Mukesh, S., “Air Quality Prediction along a Highway Corridor under Mixed Traffic Condition”,International Journal of Earth Sciences and Engineering, Vol.8, Issue 5, pp. 2017-2024, 2015.
3. Cohan, A., Wu, J., and Dabdub, D., “High resolution pollutant transport in the San Pedro Bay of California”, Atmospheric Pollution Research, Vol.2, pp. 237-246, 2011.
4. Gibson, M. D., Kundu, S., and Satish, M., “Dispersion model evaluation of PM2.5, NOx and SO2 from point and major line sources in Nova
Scotia, Canada using AERMOD Gaussian plume air dispersion model”, Atmospheric Pollution Research, Vol.4, pp. 157-167, 2013.
5. Gulia, S., Shrivastava, A., Nema, A.K., and Khare M., “Assessment of Urban air quality around a heritage site using AERMOD: A case study of Amritsar city, India”, Environ Model Assess,Vol.6, 2015.
6. Kesarkar, A.P., Dalvi, M.,Kaginalkar, A., andOjha, A., “Coupling of the Weather Research and Forecasting Model with AERMOD for pollutant dispersion modeling. A case study for PM10 dispersion over Pune, India”, Atmospheric Environment, Vol.47, pp. 1976-1988, 2007.
7. Khare, M., Nagendra S., and Gulia S., “Performance evaluation of air quality dispersion models at urban intersection of an Indian city: a case study of Delhi city”, Air Pollution, Vol.157, 2012.
8. Ma, J., Yi, H., Tang, X., Zhang, Y., Xiang, Y., and Pu, Li., “Application of AERMOD on near future air quality simulation under the latest national emission control policy of China: A case study on an industrial city”, Journal of Environmental Sciences, Vol.25, Issue 8, pp. 1608– 1617, 2013.
9. Majumdar, B.K., Dutta, A.,Chakrabarty, S., and Ray, S., “Assessment of vehicular pollution in Kolkata, India, using CALINE 4 model”, Environ Monit Assess, Vol.170, pp. 33-43, 2010.
10. Mishra, D., and Goyal, P., “Performance of AERMOD over Delhi Urban Area at Different Time Scales”, International Journal of Earth and Atmospheric Science, Vol.2, Issue 2, pp. 49-57, 2015.
11. Prakash, B.M.,Mahadevaswamy, M., Mahesh, S., andSiddhanti, S.R., “Air Quality Assessment along the Highway Due To Vehicular Emissions and Validation of Air Quality Monitored Data with the CALINE4 Model”, International Journal of Innovative Research in Science, Engineering and Technology, Vol.4, Issue 9, pp. 8369-8376, 2015.
12. Sharma, N. Gulia, S. Dhyani, R. Singh, A.“Performance evaluation of CALINE4 dispersion model for an Urban highway corridor in Delhi”, Journal of Scientific and Industrial Research, Vol.72, pp. 521-530, 2013.
13. Volk, H. E., Lurmann, F., Penfold, B., Picciotto, I. H., and McConnell R., “Traffic-Related Air Pollution, Particulate Matter, and Autism”, American Medical Association, Vol.70, Issue 1, 2013.