18th International Conference on Structural Mechanics in Reactor Technology (SMiRT 18) Beijing, China, August 7-12, 2005 SMiRT18-C03-4
PELLET CLADDING MECHANICAL INTERACTION ASSESSMENT
USING 3D MODELLING
B. MICHEL, D. PLANCQ, C. STRUZIK, Ph GARCIA, S. LANSIART
DEC/SESC CEA Cadarache 13108 St, Paul Lez Durance, FRANCE
Phone: (33)442-253-473, Fax: (33)442-252-949
E-mail: [email protected]
ABSTRACT
This study has been achieved in the framework of the Pellet Cladding Mechanical Interaction (PCMI) analyses for fuel rods of Pressurized Water Reactors. In order to evaluate the local cladding failure conditions in case of “Class 2” power transient, a 3D simulation tool has been developed at CEA. The application used in this study is named TOUTATIS; a new multi-dimensional application for PWR (ALCYONE) is now under development.
Objectives of this study are to validate the 3D simulation and to analyse the local loading applied to the cladding during a power ramp test. A set of 15 fuel rodlets is extracted from the CEA-EDF-FRAMATOME ANP experimental data base for the validation. These rodlets, made of a Uranium Dioxyde (UO2) pellet and a
Zircaloy-4 (Zy-4) cladding, are submitted to a base irradiation in a power reactor and then a power ramp test in the experimental reactor OSIRIS. Burn up at the end of base irradiation, maximum power ramp test level and power ramp test holding times are respectively in the range 26 to 53 GWd/tU, 39.5 to 53 kW/m and 0 to 12 hours.
The validation is mainly based on the comparison between simulated and experimental cladding outer diametral profilometries at the end of base irradiation and power ramp test. The computation/experiment comparison for primary ridges height and mid-pellet plane cladding outer diameter, after base irradiation, leads us to conclude that the 3D simulation has a good capacity to assess gap closure time differences between inter and mid pellet planes. Out of ridge diameter variation during the ramp test can also be reasonably assessed by the 3D simulation. Experimental primary ridge height is not strongly affected by the ramp test, and simulation has some difficulties to quantify the variation. Concerning secondary ridge height assessment, simulated results are qualitatively good for low measured values but tend to underestimate measures for every cases where secondary ridges are greater than 10 µm. A sensitivity analysis shows that secondary ridges assessment is better when the friction coefficient at pellet-cladding interface is reduced.
Finally, displacement controlled loading applied by the pellet to cladding during the power ramp test is detailed and a discussion concerning local cladding stress-strain field is proposed.
Keywords: PWR Fuel, pellet cladding mechanical interaction, finite element simulation.
1. INTRODUCTION
especially friction modelling at pellet-cladding interface implemented in a recent release [5], and to analyse the local loading applied to the cladding during a power ramp test.
The proposed validation, on a set of 15 fuel rods extracted from the CEA-EDF-FRAMATOME ANP experimental data base, is mainly based on the comparison between simulated and experimental cladding outer diametral profilometries at the end of base irradiation and power ramp test. A hundred computations have been achieved in order to analyse the sensitivity of the final profilometries to different parameters such as the friction coefficient at the pellet cladding interface. The analysis of ridges height and cladding outer diameter variation during base irradiation and power ramp test is detailed in order to understand the strain controlled cladding loading process and then to select first order parameters. Finally a discussion concerning local loading in the cladding and future modelling improvements is proposed.
2. 3D SIMULATION OF PCMI
2.1 Introduction
Fuel behaviour simulation at CEA was previously achieved using a one dimensional approach with a code named METEOR [4]. The one dimensional approach enables us to quantify the contribution of many phenomena (such as densification, solid and gaseous swelling, pellet and cladding creep…) to gap closure and cladding diameter evolution during base irradiation and power ramp tests. However this approach, which represents mainly the mid-pellet plane, was not detailed enough to understand cladding crack location and also to determine an intrinsic failure riterion. These limitations lead to develop a 3D simulation tool devoted to PCMI analysis, in order to improve the understanding of cladding failure scenario. The 3D simulation tool TOUTATIS [2] is based on the CAST3M CEA finite element code for thermo-mechanical aspects of the fuel component behaviour and on the GIBIANE macro command language for fuel chemical-physic modelling. This latter aspect of fuel behaviour was simplified in the 3D approach, or used pre-computed results of the 1D code (case of gaseous swelling), in order to focus on cladding thermo-mechanical loading which seems to be a first order parameter in PCMI failures.
2.2 Geometry and boundary conditions
Support conditions on (xOy) fixed plane Symmetry plane
(yOz)
z
y x
O Contact conditions
at cladding-pellet interface
∆ z = Cst after the 1rst
cladding-pellet contact
Pellet compression spring strength
Contact conditions at interfragment plane Symmetry plane for
the cladding
Figure 1 : Geometry and boundary conditions in PCMI 3D simulation
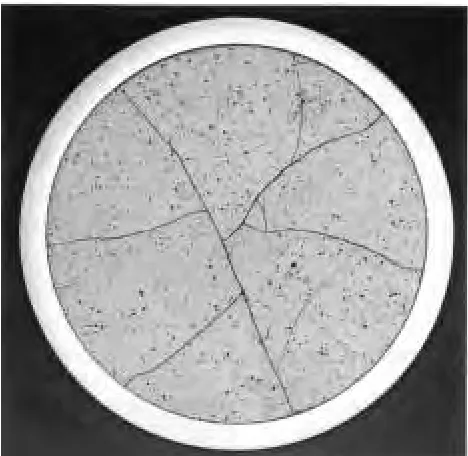
Figure 2 : Ceramographic examinations on rods after 2 cycles of base irradiation
The boundary conditions shown on Figure 1, allow to take into account the geometrical symmetries of the problem and also the interaction between pellet and cladding and between pellet fragments. The inter-pellet plane is materialized with the (O,x,y) plane and an unilateral contact condition on this plane. The mechanical reaction of the fissile column above and under the meshed fragment is represented with a kinematical relationship between pellet and cladding mid planes. This mid plane locked condition is used only when the pellet cladding gap is closed at least at one point. Concerning load boundary conditions, internal pressure is applied on the cladding inner surface and pellet outer surface (only on points without displacement boundary conditions), external pressure is applied on the cladding outer surface, and pressure end effect is also applied on the cladding mid-plane.
2.3 fuel behaviour modeling
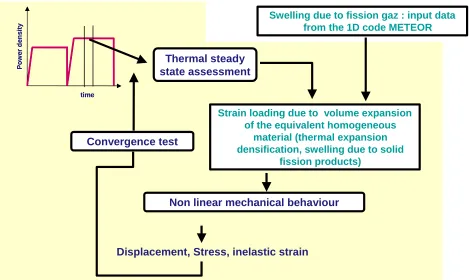
due to fission products, and on the other side power evacuation and mechanical stresses and strains induced by local volume variations. Formers are mainly linked to mechanisms at an atomistic scale (densification and solid swelling process, gaseous fission products behaviour…), when the latter are more relevant of larger scale commonly used for integrity assessment of structure under thermo-mechanical loading. The numerical scheme used in the 3D approach is based on a weak coupling formulation between thermal, physic of irradiation and mechanical problems as presented on Figure 4. On the latter we can see that gaseous swelling constitutive equations are not included in the convergence loop, but are considered as an input data coming from a one dimensional computation in the METEOR code.
•PELLET
9Nuclear power deposition
9Power evacuation (conduction)
9Material properties evolution under
irradiation (densification, swelling, fission products)
9Thermo-Mechanical behaviour (thermal
expension, thermal and irradiation creep, rupture)
•PELLET-CLADDING INTERFACE
9Power evacuation (conduction, convection
and radiation)
9Mechanical interaction (contact)
•CLADDING
9Power evacuation
(conduction, convection on external surface)
9Thermo-Mechanical behaviour
(pressure, thermal expension, thermal and irradiation creep, rupture)
Figure 3 : PWR fuel component behaviour
Thermal steady state assessment
P
o
w
e
r de
ns
ity
time
P
o
w
e
r de
ns
ity
time
Strain loading due to volume expansion of the equivalent homogeneous
material (thermal expansion densification, swelling due to solid
fission products)
Non linear mechanical behaviour
Displacement, Stress, inelastic strain Convergence test
Swelling due to fission gaz : input data from the 1D code METEOR
2.4 Constitutive equations
Fuel pellet
Non linear viscoplastic behaviour under irradiation is taken into account in the pellet, where fission density leads to an induced creep effect, with a low level of activation energy, and an enhancement of the thermal creep. Fuel creep rate evolution under irradiation is introduced through the only effect of porosity. The latter is linked to several phenomena such as densification under irradiation, gaseous swelling due to fission products or mechanical compressibility. As mentioned above, crack propagation in the pellet fragment is not represented in this first step simulation. In order to yield the stress level in the pellet an instantaneous perfectly plastic law is added to the creep law, via a two inelastic strain model formulation [6]. In the 3D analysis, fuel material changes under irradiation are derived from simple models or pre-computed METEOR results because a lot of CPU time is needed for the non-linear thermo-mechanical problem.
Cladding
For the cladding, the viscoplastic law depends not only on fast neutron flux (E>1MeV), which largely increases the creep rate at low stresses, but also on neutron fluence which, on the contrary, reduces the cladding viscoplasticity, especially at high stresses. To take into account material behaviour on the whole loading range, two different laws are used for creep at low stress level (base irradiation) and high stress level (ramp test). For the latter, a two inelastic strain model [6] is also used for instantaneous plasticity and thermal creep. In this first step study, anisotropic cladding behaviour is not taken into account, although Hill model coefficients could be identified under various loading type conditions [7] and available through MISTRAL, a numerical tool for cladding mechanical behaviour modelling.
Pellet-cladding interface
Thermal flux through the interface is computed with an equivalent convection exchange coefficient taking into account conduction and radiation when gap is opened, or thermal contact resistance when gap is closed. Concerning mechanical aspects, unilateral contact is assessed by the lagrangian multiplier method of the CAST3M Finite Element code, and a “Coulomb” type model, with a friction factor of 0.5, is introduced to take into account friction-slipping or sticking phenomena.
3. 3D VALIDATION PROGRAM
An important cooperative experimental program between CEA, EDF and FRAMATOME ANP has been achieved. These experiments are based on the same protocol which is composed of a first irradiation of a whole fuel rod in an EDF power reactor (base irradiation) for nominal conditions, and then of a power ramp test on a rodlet, extracted from the parent rod, in the experimental reactor OSIRIS. The power ramp test rate has been conventionally set up at 100 W/cm/min. In this study, experimental results of twelve rodlets have been used for validation. Main characteristics of these rodlets and their irradiation history are detailed in Table 1.
Validation of the 3D simulation is mainly based on cladding external diameter assessment after base irradiation and power ramp test. The cladding profilometry is an interesting data because it gives quantitative elements on pellet-cladding mechanical interaction which leads to a significant amount of residual strains in the cladding. Axial variation of cladding outer diameter is decomposed in 3 geometrical parameters (see Figure 5) : out of ridge diameter, primary ridge and secondary ridge.
Table 1 : Experimental input data
Material Base irradiation Power ramp test
Rodlet Pellet/cladding Burn-up (GWd/tU)
Maximum power level (kW/m)
Time at final power
I2 UO2/Zy4 26 45 0
F2 UO2/Zy4 28 42 14min
D2 UO2/Zy4 27 46 7min
E2 UO2/Zy4 27 44 12h
H2 UO2/Zy4 27 41 16min
G2 UO2/Zy4 27 40 12h19min
B2 UO2/Zy4 24 47 2h10min
C2 UO2/Zy4 24 53 2min
K3 UO2/Zy4 41 43 12h26min
L3 UO2/Zy4 40 53 6min
O4 UO2/Zy4 52 46 0
9,430E-03 9,435E-03 9,440E-03 9,445E-03 9,450E-03 9,455E-03 9,460E-03
1,0E-01 1,2E-01 1,4E-01 1,6E-01 1,8E-01 2,0E-01
z (m)
Ext
er
nal
di
amet
er
(
m
)
pellet
Pri
m
ar
y
rid
g
e
Se
condar
y
rid
g
e
O
ut of
rid
ge dia
m
et
er
Figure 5 : Ridges measurement on cladding outer profilometry.
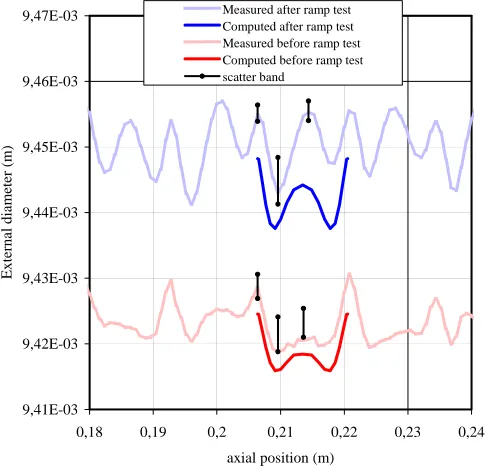
Computed and measured results for outer profilometry of F2 rodlet are compared before and after ramp test on Figure 6. Concerning measurements, a scatter band, deduced from the results of the 5 pellets around the maximal flux plane, has been plotted : it shows that the incertitude on diameter doesn’t exceed 7 µm. This comparison lead us to conclude that the simulation has a good capacity to assess the external cladding profilometry variation after base and ramp test irradiations. Actually out of ridge diameter variation during ramp test and primary ridge height before and after ramp test are in good agreement with measured values compared to experimental scatter band. For this rodlet the simulation tends to under estimate out of ridge diameter after base irradiation and secondary ridge height after ramp test.
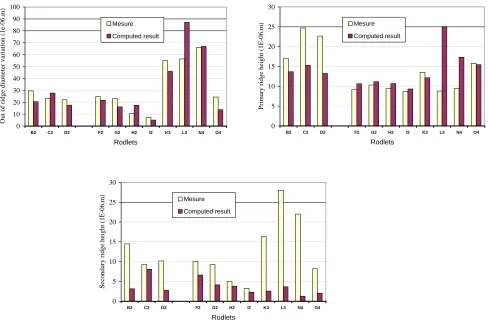
The validation has been then extended to the whole experimental data base of Table 1; the results are presented on Figure 7 for base irradiation and on Figure 8 after ramp test. This analysis is based on the geometrical parameters mentioned above.
9,41E-03 9,42E-03 9,43E-03 9,44E-03 9,45E-03 9,46E-03 9,47E-03
0,18 0,19 0,2 0,21 0,22 0,23 0,24
axial position (m)
External diameter (m)
Measured after ramp test Computed after ramp test Measured before ramp test Computed before ramp test scatter band
Figure 7 : Validation of outer cladding pr
ent after base irradiation
Figure 8 : V
ent after ramp test.
Aft 2-cycle
rods and uel rod
resu 9380 9400 9420 9440 9460 9480 9500 9520 9540
B2 C2 D2 E2 F2 G2 H2 I2 K3 L3 N4 O4
Rodlets
Out of ridge diameter (m)
Mesure Computed result 0 2 4 6 8 10 12 14 16 18 20
B2 C2 D2 E2 F2 G2 H2 I2 K3 L3 N4 O4
Rodlets
Primary ridge height (1E-06.m)
Mesure
Computed result
ofilometry assessm
alidation of outer cladding profilometry assessm
0 5 10 15 20 25
B2 C2 D2 F2 G2 H2 I2 K3 L3 N4 O4
Rodlets
Secondary ridge
height (1E-06.
m) Mesure
Computed result
er base irradiation, out of ridge diameter is slightly under estimated (less than 10 microns) for over estimated for 3 and 4 cycle (up to 30 microns) rods. The small discrepancy for 2 cycle f lts could probably be improved by using another estimation of the pellet conductivity, leading to increase the central pellet temperature of about 50 °C. This new temperature assessment, steel included in the experimental scatter band, will be enough to reduce the gap closure time in the mid-pellet plane and then to increase the final diameter. For higher cycle numbers, the 3D models are probably not enough detailed to describe the pellet 0 10 20 30 40 50 60 70 80 90
B2 C2 D2 F2 G2 H2 I2 K3 L3 N4 O4
Rodlets Out of r idge diameter var iation ( 1 e-06.m) Mesure Computed result 0 5 10 15 20 25
B2 C2 D2 F2 G2 H2 I2 K3 L3 N4 O4
Rodlets
Primary ridge height (1E-06.
m) Mesure
Computed result
2 cycles 3 cycles 4 cycles 2 cycles2 cycles 3 cycles3 cycles 4 cycle4 cycless
100 30
Out of ridge essed by the 3D
simulation, which cladding stress
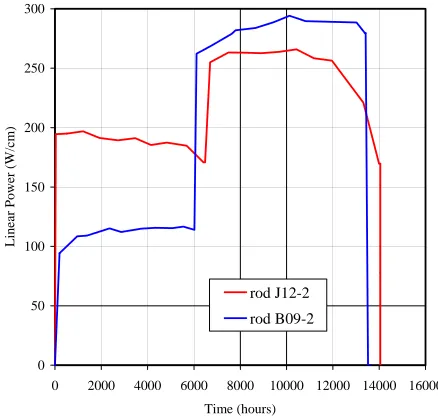
and strain field. Experimental primary ridge height is not strongly affected by the ramp test, and simulation has some difficulties to quantify the variation. Concerning secondary ridge height assessment we can see on Figure 8 microstructure evolution under irradiation, and then can hardly assess the final diameter with a high level of precision. Primary ridge height is reasonably estimated by the 3D approach, if we consider that the experimental scatter band of this data can reach 30 to 50%. The simulation has a good capacity to differentiate fuel rods versus the base irradiation history. If we compare for instance the power history of rods I2 and B2 (Figure 9) we can understand why I2 out of ridge diameter is lower than B2 one, and why I2 primary ridge height is also lower than B2 one. Concerning out of ridge diameter a higher mean power level during base irradiation in I2 lead to increase creep strains in cladding and to reduce the final mean diameter. For the primary ridge, which is created after gap closure at the inter-pellet plane at the end of the first cycle, a higher power level during second cycle in the B2 rod lead to enhance pellet hour-glass shape magnitude and then primary ridge height after irradiation.
300
Figure 9 : Power history of base irradiation in I2 and B2 rods
0 50 100 150 200 250
0 2000 4000 6000 8000 10000 12000 14000 16000
Time (hours)
Linear Power (W/cm)
rod J12-2 rod B09-2
Figure 10 : Secondary ridge height assessment after a ramp test.
0,0E+00 5,0E-06 1,0E-05 1,5E-05 2,0E-05 2,5E-05
0,0E+00 5,0E-06 1,0E-05 1,5E-05 2,0E-05 2,5E-05 3,0E-05 Simulation (m)
Measur
e (
m
)
Friction coefficient = 0 Friction coefficient = 0,47 computed = measured computed=measured + 5 microns computed = measured - 5 microns 3,0E-05
that
xial direction when friction coefficient incr
In order to understand the loading process imposed by the pellet to the cladding, displacements and pellet sed on Figure 11. At the end of the conditioning holding period the whole pellet-cladding gap is closed, and then the whole radial displacement of the pellet outer cladding inner surface. Ridges height evolution during the transient stage and at the begi
ion shear stresses due to differential tangential displacement at pellet-cladding interface. Stress loca
simulated results are qualitatively good for low measured values. However, computed values underestimate measures for every cases where secondary ridges are greater than 10 µm.
In order to understand the reason why computed results tend to under estimate secondary ridge height, we first analyse on Figure 10 the sensitivity of these results to the friction coefficient. As we can see on this figure, computed results without friction give a better assessment of secondary ridge height greater than 10 µm. This results is linked to an enhancement of the pellet inelastic strains in the a
eases. However, this problem to assess secondary ridges height doesn’t seem only linked to the friction factor, but also to the plasticity model used to describe fuel fracture. In fact, when a secondary crack pattern appears in the pellet fragment during the ramp test, material properties are not isotropic any more as it is the case in the plasticity model. Moreover inelastic strains assessed by plasticity are uncompressible, which is not consistent with inelastic strains due to crack opening.
4. STRAIN CONTROLLED LOADING ASSESSMENT
4.1 3D results analysis
shape variations during a typical power ramp test are analy
surface is transmitted to the
nning of the holding period is detailed on Figure 11. The primary ridge increases at the beginning of the transient stage, then it tends to decrease for a power level higher than 39.5 kW/m and during the hold period. The secondary ridge is small at the end of the conditioning period and starts to increase for a power level greater than 30 kW/m. Then it grows up to a value of 11 µm after 260 s of holding time at the maximum power level. On Figure 11, inelastic strains and gaseous swelling in the pellet have also been plotted. These results show that secondary ridge enhancement and primary ridge reduction are linked to the development of inelastic strains in the pellet. Moreover, gaseous swelling leads to increase inelastic strains, and then indirectly secondary ridge height, which is consistent with experimental knowledge. The simulation shows that the mechanical effects of power increase (thermal expansion) and of gaseous swelling are very similar, but the latter occurs after the maximum power level is reached because of the delay needed for gaseous swelling to take place.
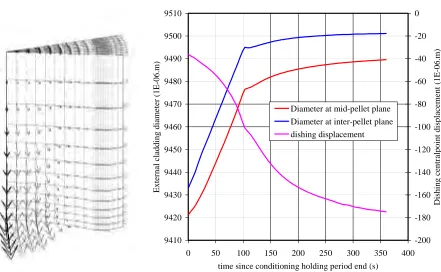
Displacement variation between 100 and 350 seconds is plotted using a vector field representation on Figure 12. The latter illustrates the viscoplastic flow in the pellet, which tends to fill up the dishing and to reduce radial displacements in the inter-pellet plane area, whereas the viscoplastic flow in the mid-plane area leads mainly to a radial extension.
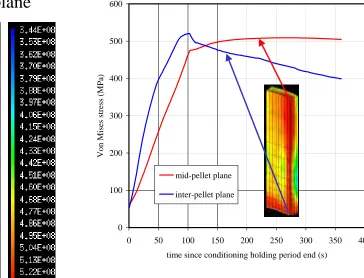
Cladding loading is analysed via the Von Mises stress distribution at the beginning of the hold period as shown on Figure 13. It appears that the equivalent Von Mises stress is maximal on the edge of the pellet fragment in circumferential and axial directions. Stress localisation in the circumferential direction can be explained by frict
0 5 10 15 20 25 30
0 50 100 150 200 250 300 350 400
time since conditioning holding period end (s)
Ridge height (1E-06 m)
150 200 250 300 350 400 450
Linear power (W/cm)
Primary ridge Secondary ridge Linear power 0 0,002 0,004 0,006 0,008 0,01 0,012 0,014 0,016 0,018
0 50 100 150 200 250 300 350 400
time since conditioning holding period end (s)
C ente r pe lle t ine la stic e quiva le nt stra in -0,5% 0,0% 0,5% 1,0% 1,5% 2,0% 2,5% 3,0% 3,5% 4,0%
Gaseous swelling varia
tion a t c ente r pe lle t
Strain at inter-pellet plane Strain at mid-pellet plane Gaseous swelling
Figure 11 : Pellet strains and external profilometry during the power ramp test
9410 9420 9430 9440 9450 9460 9470 9480 9490 9500 9510
0 50 100 150 200 250 300 350 400 time since conditioning holding period end (s)
External cladding diameter (1E-06.m)
-200 -180 -160 -140 -120 -100 -80 -60 -40 -20 0
Dishing centralpoint displacement (1E-06.m)
Diameter at mid-pellet plane Diameter at inter-pellet plane dishing displacement
mid-pellet plane
Free surface of pellet frag
m
ent
Von Mises stress (Pa) at the
beginning of the holding period
0 100 200 300 400 500 600
0 50 100 150 200 250 300 350 400
time since conditioning holding period end (s)
Von Mises stress (MPa)
mid-pellet plane inter-pellet plane
Figure 13 : Von Mises stress in the cladding during the power ramp test.
Stress variation at inner cladding surface during the power ramp test is plotted for two different locations along the pellet-fragment edge as shown on Figure 13. The inter-pellet point stress is higher during the transient power stage, then it decreases at the beginning of the holding period and becomes lower than the mid-pellet plane stress after 30 seconds of dwell. These variations can be correlated to ridges evolution presented on Figure 11, the primary ridge growth during transient stage lead to a higher loading level at inter-pellet plane, and then secondary ridge increase stress level at mid-pellet plane at the beginning of the holding period.
4.2 Discussion on local cladding loading
For structural integrity assessment of the cladding, a local estimation of the stress-strain field is needed to define an intrinsic rupture criterion. Post ramp test examinations of failed rods show that cladding crack propagation is mainly located near the inter pellet plane in front of crack between two pellet-fragments. As shown in the previous section, friction modelling leads to assess a higher stress level in the cladding in front of the pellet fragment edge. This result is quite consistent with circumferential crack location in the cladding, but it is still difficult to explain the axial crack location near the inter-pellet plane. Concerning this point, an improvement could be expected by lowering the pellet clad friction coefficient around the mid-pellet plane, comparatively to the one near the inter-pellet plane. For 2-cycle rods, this relatively higher friction level at inter-pellet plane could be the consequence of the pellet dumbbell effect which induces a stronger interaction at inter-pellet plane, as revealed by the presence of a quasi continuous internal ZrO2 layer while only ZrO2 spots can be observed elsewhere. As previously indicated, a lower friction coefficient (around mid-pellet plane) would also give a more adequate simulation of the secondary ridging.
of study, presently in progress, already gives some interesting results concerning local stress distribution in the cladding around the gap between pellet fragments. It shows, for instance, a first order effect of the shear stress at the pellet-cladding interface, which can lead to higher stress values than those computed with the 3D present mesh refinement. This result might help to improve the modelling of stress corrosion damage in the clad, especially in the crack initiation phase. Moreover, the local shear stress at pellet-cladding interface should be strongly linked to the friction level and to the fuel rupture properties, which seems also promising to understand why critical power ramp level is much higher for certain types of fuels, such as MOX fuel [8] or doped fuel [9].
10
µ
m
Figure 14 : Circumferential gap opening between pellet-fragments
5. CONCLUSIONS
The validation of 3D fuel behaviour modelling on a large experimental data base has been presented. The computation/experiment comparison for primary ridges height and mid-pellet plane cladding outer diameter after base irradiation, leads us to conclude that the 3D simulation has a good capacity to assess gap closure time differences between inter and mid pellet planes. These results enable us to quantify the influence of each mechanism such as densification, swelling, thermal and irradiation creeps in the pellet and the cladding. Out of ridge diameter variation during the ramp test can also be reasonably assessed by the 3D simulation, which enabled us to quantify the impact of thermal dilatation and gaseous swelling on cladding stress and strain field. Experimental primary ridge height is not strongly affected by the ramp test, and simulation has some difficulties to quantify the variation. Concerning secondary ridge height assessment, simulated results are qualitatively good for low measured values but tend to underestimate measurements for every cases where secondary ridges are greater than 10 µm. A sensitivity analysis shows that secondary ridges assessment is better when the friction coefficient is reduced. This result is linked to an enhancement of the pellet inelastic strains in the axial direction when friction coefficient increases. A significant improvement of secondary ridges assessment is expected with the next modelling, now under development, taking into account a secondary cracks pattern in the pellet fragment.
REFERENCES
[1] BROCHARD J., BENTEJAC F. and HOURDEQUIN N., “Non-Linear Finite Element Studies of the Pellet Cladding Mechanical Interface in PWR Fuel”, Transactions of the 14th SMIRT, Lyon, France, 1997."TOUTATIS an application of the CAST3M finite element code for PCI three dimensional modelling”.
[2] PLANCQ D., G. THOUVENIN and al, "PLEIADES : a unified environment for multi-dimensional fuel performance modelling", International Meeting on LWR Fuel Performance, Florida, 2004.
[3] MOUGEL C. and al., “Power ramping in the osiris reactor : Data base analysis for standard UO2 Fuel with
Zy-4 cladding”, International seminar on Pellet-Clad interactions with water reactor fuels, Aix en Provence, March 2004.
[4] C. STRUZIK, M. MOYNE, J.P. PIRON, “High burn-up modelling of UO2 and MOX fuel with METEOR/TRANSURANUS version 1.5” ANS International Topical Meeting on Light Water Reactor Fuel Performances, Portland (1997).
[5] F. BENTEJAC, N. HOURDEQUIN, "TOUTATIS an application of the CAST3M finite element code for PCI three dimensional modelling”, International seminar on Pellet-Clad interactions with water reactor fuels, Aix en Provence, March 2004.
[6] E. CONTESTI, G. CAILLETAUD, "Description of creep plasticity interaction with non unified constitutive equations : application to an austenitic stainless steel", Nucl. Eng. and Design, 116, 1989.
[7] SONIAK A., L’HULLIER N., MARDON J. P., REBEYROLLE V., BOUFFIOUX P., BERNAUDAT C., “Irradiation Creep Behavior of Zr-Base Alloys”, Zirconium in the Nuclear Industry : Thirteenth International Symposium, ASTM STP 1423, G. D. Moan and P. Rudling, Eds., ASTM International, West Conshohocken, PA, 2002, pp. 837-862.
[8] COOK P. and al, “Post-Irradiation examination and testing of BNFL SBR MOX Fuel”, International Meeting on LWR Fuel Performance, Florida, 2004.