Performance Tests of Reactor Containment Structures of the HTTR
Kazuhiko IIGAKI, Nariaki SAKABA, Satoshi KAWAJI and Tatsuo IYOKU
Department of HTTR Project, Oarai Research Establishment, Japan Atomic Energy Research Institute, Oarai-machi, Higashiibaraki-gun, Ibaraki-ken, Japan
ABSTRACT
The containment structures of the high temperature engineering test reactor (ITI~R) consist of a reactor containment vessel (CV), a service area (SA) and an emergency air purification system, which minimize the release of fission products from the reactor facilities in the postulated accidents. In the high temperature gas-cooled reactor, the pressure boundary of coolant in the leakage test should be closed to prevent from releasing of fission products into the CV. Thus, we propose to perform the overall leakage test of the CV keeping the pressure boundary of coolant closed and the local leakage test of the CV isolation valves. Results of performance tests of the CV, the SA and the emergency air purification system could meet the requirement for them.
INTRODUCTION
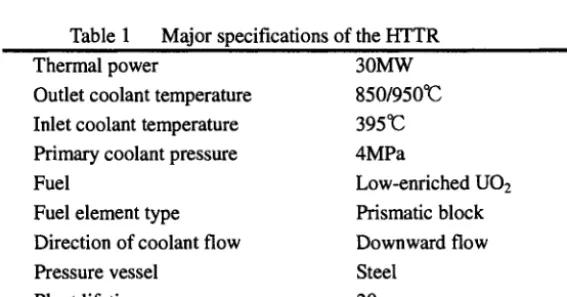
The high temperature gas-cooled reactor (HTGR) is expected to be one of alternative energy sources in the near future because it can supply high temperature heat and has high thermal efficiency. The high temperature engineering test reactor (HTTR) [ 1 ] built by Japan Atomic Energy Research Institute (JAERI) as the first HTGR in Japan, attained its first criticality on November 10 in 1998. The HTTR is a graphite-moderated and helium-gas-cooled test reactor with an outlet gas temperature of 850°C at the rated operation and 950°C at the high temperature test operation as well as a thermal power of 30MW. Table 1 shows the major specifications of the HTTR.
Table 1 Thermal power
Outlet coolant temperature Inlet coolant temperature Primary coolant pressure Fuel
Fuel element type Direction of coolant flow Pressure vessel
Plant lifetime
Major specifications of the HTTR 30MW 850/950°C 395°(3 4MPa
Low-enriched UO2 Prismatic block Downward flow Steel
20yr
Fig.1 shows an outlined description of the containment structures of the HTTR [2]. The containment structures of the HTTR consist of the reactor containment vessel (CV), the service area (SA) and the emergency air purification system, which minimize the release of fission products from the reactor facilities in the postulated accidents.
Prior to startup core physics tests of the HTTR, the JAERI carried out performance tests of the reactor containment structures with no fuel conditions in 1996. These tests are also perfomed every year afer fuel loading.
Refueling hatch
S
~ ~ ~ L .
Maintenance hatch
Entrance
e m e r g e n c y ?
Thermocouple~-
exchange hatch
\ /
Reacior coolant
"/~a
!
pressure boundary
Service area
Reactor containment~
k
~
~
_ _ . @
Exhaust duct
_
Blower
Exhaust filtering unit
Emergency air purification system
Electric heater
Corpuscle filter
Iodine removal filter
( ~
Exhaust
monitor
Fig.1 Outlined description of containment structures of the H'Iq'R
In conventional light water reactors (LWRs), the leakage test of the CV is conducted keeping the pressure boundary of coolant open [3]. However, the pressure boundary of coolant in the leakage test of the HTGR should be closed to prevent from releasing of fission products into the CV. Thus, we put forward to perform the overall leakage test of the CV keeping the pressure boundary of coolant closed and the local leakage test of the CV isolation valves. The leakage rate of the CV is estimated considering results of the overall and local leakage tests.
In this paper, the conditions and the results of the performance tests of the reactor containment structures are described.
OUTLINE OF REACTOR CONTAINMENT STRUCTURES
Reactor Containment Vessel
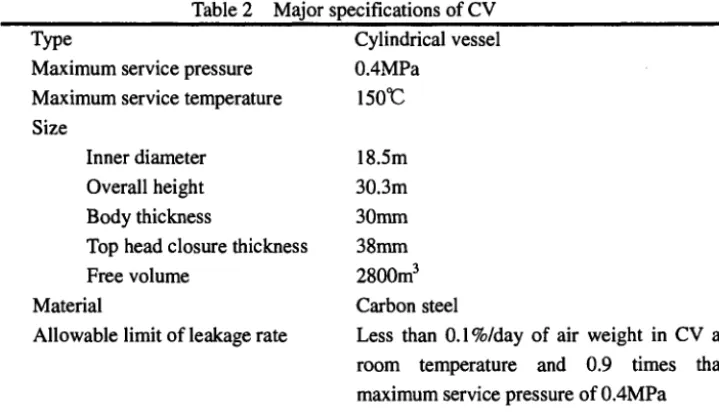
The CV made of carbon steel is 30.3m in height, 18.5m in inner diameter, and 2800m 3 of free volume. Its configuration is shown in Fig. 1. The CV is designed to withstand the temperature and pressure transients and to be leak-tight within the specific limits in case of a rupture of primary piping; i.e. depressurization accident [4]. The size of the CV is smaller than that in the LWRs to minimize the amount of air which may react with in-core graphite components during the depressurization accident.
Table 2 ml |
Type
Maximum service pressure Maximum service temperature Size
Inner diameter Overall height Body thickness
Top head closure thickness Free volume
Material
Allowable limit of leakage rate
Major specifications of CV i i Cylindrical vessel 0.4MPa
150°C
18.5m 30.3m 30mm 38mm 2800m 3 Carbon steel
Less than 0.1%/day of air weight in CV at room temperature and 0.9 times that maximum service pressure of 0.4MPa
Service Area
The SA surrounding the CV is the space containing the fuel handling and storage systems as well as the primary helium purification system. The free volume of the SA is about 23000m 3. The air pressure inside the SA is maintained to be slightly lower than that of atmosphere by the air ventilation system in the normal operation and by the emergency air purification system in an accident.
Emergency Air Purification System
The emergency air purification system removes airborne radioactivities and maintains proper pressure in the SA during the accidents. Also, it has two lines as shown in Fig. 1. Each line is composed of an exhaust filtering unit, an exhaust blower and butterfly valves. The exhaust filtering unit discharge the purified air to atmosphere through an exhaust duct. Table 3 shows the major specifications of the emergency air purification system.
Table 3 i Exhaust filter unit
Type Number
Each volume velocity Charcoal layer thickness
Allowable limit of removal efficiency Iodine
Corpuscle
Major specifications of emergency air purification system
i i
Corpuscle and iodine removal filter 2
3360m3/h 50mm
More than 95% More than 99%
i
PERFORMANCE
CV Leakage Test
Amount of leakage Q (%) is evaluated through the absolute air pressure and temperature in the CV, and is given by equation (1).
Q = G 1 - G E x l 0 0 = (1 - PmET1 / x l 0 0 (1)
G1 PmlT2
Q: amount of leakage (%)
G: air weight (kg)
Pm: absolute air pressure in CV (mmHg)
T: absolute air temperature in CV (K)
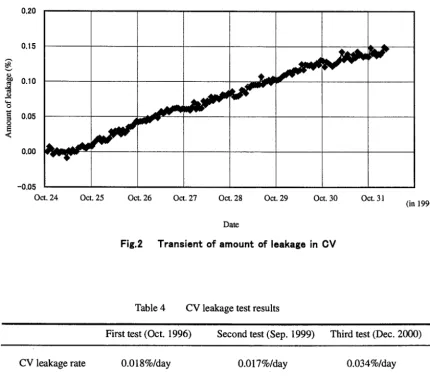
Prior to the overall leakage test, it is confirmed that the CV retains the boundary under the air pressure condition of 0.44MPa. After that, the overall CV leakage test was performed keeping the air pressure of 0.36MPa and the coolant pressure of 0.05MPa. Fig. 2 shows a transient of amount of leakage in the CV between October 24 and 31 in 1996. As a result of the leakage test, the leakage rate of the CV was 0.018%/day, which was well below the allowable limit of 0.1%/day.
0.20
0.15
&.
0.10
= 0.05
°
j
< 0.00
-0.05
Oct. 24 Oct. 25 Oct. 26 Oct. 27 Oct. 28 Oct. 29 Oct. 30 Oct. 31
Fig.2
Date
Transient of amount of leakage in CV
(in 1996)
Table 4 CV leakage test results i
First test (Oct. 1996) Second test (Sep. 1999) Third test (Dec. 2000)
CV leakage rate 0.018%/day 0.017%/day 0.034%/day
Table 4 shows CV leakage test results at each year. It can be seen from the Table 4 that the CV leakage rate was well below the allowable limit of 0.1%/day at each year. Thus, it was confirmed that the integrity of the CV is maintained.
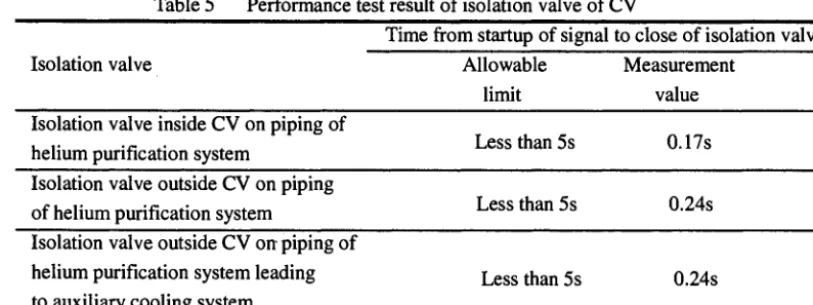
purification system occur. The CV isolation valves are divided into the following three type valves. (1) Isolation valve inside CV on piping of helium purification system
(2) Isolation valve outside CV on piping of helium purification system
(3) Isolation valve outside CV on piping of helium purification system leading to auxiliary cooling system
As shown in Table 5, the time from the startup of signal to the close of the CV isolation valves for inside and outside the CV isolation valves were 0.17s and 0.24s, respectively. The time of all the CV isolation valves was well below the allowable limit of 5s.
Table 5 Performance test result of isolation valve of CV
Time from startup of signal to close of isolation valve
Isolation valve Allowable Measurement
limit value
Isolation valve inside CV on piping of
helium purification system Less than 5s 0.17s
Isolation valve outside CV on piping
of helium purification system Less than 5s 0.24s
Isolation valve outside CV on' piping of helium purification system leading to auxiliary cooling system
Less than 5s 0.24s
Airtight Test Of Service Area
If the depressurized accident and rupture of the piping for the primary helium purification system happen, the SA is isolated by signals such as ' pressure difference between primary coolant and pressurized water is low'. The SA needs to maintain the air pressure of less than -59Pa after the startup of the emergency air purification system. In the airtight test of the SA, the opening of air regulation damper of the emergency air purification system changes from 20 to 55% as a parameter, Table 6 shows the relationship between the air pressure in the SA and elapsed time after the startup of the emergency air purification system at the opening of the air regulation damper of the emergency air purification system of 55%. By the opening of the air regulation damper of 55%, the air pressure of the SA was kept to be below -59Pa within
lmin from the startup of the emergency air purification system.
Table 6 Relationship between air pressure in SA and elapsed time after startup of emergency air purification system at opening of air regulation damper of 55%
System Elapsed time(min) 0 1 2 3 4 5
A Air pressure in SA (Pa) 17 -75 -86 -82 -85 -87
B Air pressure in SA (Pa) 18 -71 -79 -81 -81 -82
Performance Test Of Emergency Air Purification System
rate of bypass filter path through freon gas (R-112). The corpuscle and iodine removal efficiencies are calculated as follows;
Corpuscle removal efficiency (%)= { 1-( X / Y ) } X 100 (2)
X: DOP concentration at downstream path to filter Y: DOP concentration at upstream path to filter
Iodine removal efficiency (%) = adsorption efficiency of active carbon X (l-R/100) (3)
R = (B-D)/(A-C) X 100 (4)
R: leakage rate (%)
A " freon gas concentration at upstream path to filter B : freon gas concentration at downstream path to filter C " air concentration at upstream path to filter
D " air concentration at downstream path to filter
As a result of the test, the corpuscle and iodine removal efficiencies were estimated to be 99.99% and 99.59%, respectively.
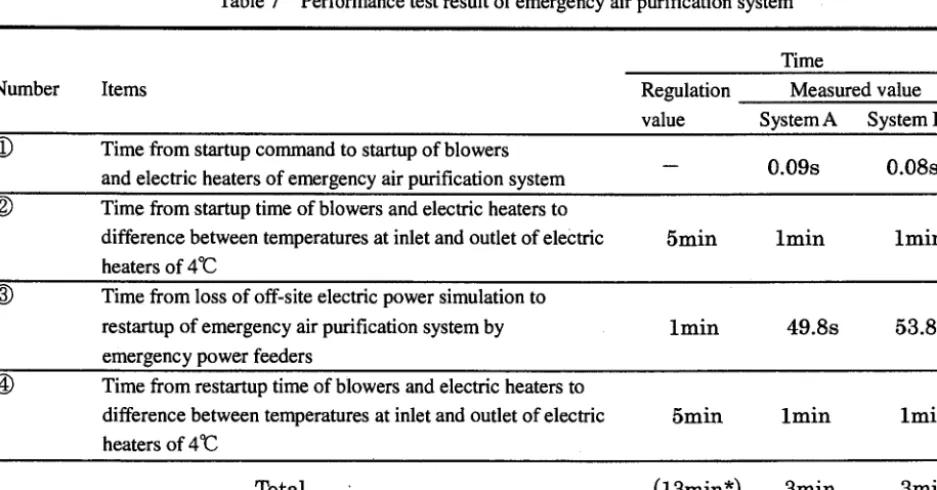
In addition, the startup time of the emergency air purification system is very important to prevent the public people from suffering the excessive radiation exposure. In the safety analyses of the HTTR, the startup time of 13min was employed considering conservatively from the viewpoint of the radiation exposure. The startup time corresponds to total time from the following items (1) to (4).
(1) Time from the startup command to the startup of blowers and electric heaters of the emergency air purification system
(2) Time from the startup time of the blowers and the electric heaters to the difference between temperatures at inlet and outlet of the electric heaters of 4°C.
(3) Time from the loss of off-site electric power simulation to the restartup of the emergency air purification system by the emergency power feeders.
(4) Time from the restartup time of the blowers and the electric heaters to the difference between temperatures at inlet and outlet of the electric heaters of 4°C.
As shown in Table 7, the startup of the emergency air purification system was less than 3min, which was well below the allowable limit of 13min.
Table 7 Performance test result of emergency air purification system i
Time
Number Items Regulation Measured value
value System A System B
®
®
Time from startup command to startup of blowers and electric heaters of emergency air purification system Time from startup time of blowers and electric heaters to difference between temperatures at inlet and outlet of electric heaters of 4°C
Time from loss of off-site electric power simulation to restartup of emergency air purification system by emergency power feeders
®
0 . 0 9 s 0 . 0 8 s
5 r a i n l m i n l m i n
l m i n 4 9 . 8 s 53.8s
@
Time from restartup time of blowers and electric heaters todifference between temperatures at inlet and outlet of electric heaters of 4°C
5 m i n l m i n l m i n
T o t a l
i
* Total time of (~), (~) and (~) as well as safety margin of 2min
CONCLUSION
The followings are the major conclusions from the performance tests of the reactor containment structures of the HTTR
1. The leakage rate of the CV was 0.018%/day, which was well below the allowable limit of 0.1%/day in 1996 and the CV leakage rate was also well below the allowable limit of 0.1%/day in 1999 and 2000. The time of all the isolation valves was well below the allowable limit of 5s.
2. The air pressure of the SA was kept to be below -59Pa within lmin from the startup of the emergency air purification system.
3. The corpuscle and iodine removal efficiencies of the emergency air purification system were estimated to be 99.99% and 99.59%, respectively. The startup of the emergency air purification system was less than 3min, which was well below the allowable limit of 13min.
REFERENCES
1. Saito S., "Design of High Temperature Engineering Test Reactor (HTTR)," JAERI 1332, 1994
2. Sakaba N., "Performance Tests of the Reactor Containment Structures of HTTR," JAERI-Tech 98-013, 1998
3. Japan Electric Association, "Definitions Code of Reactor Coolant Pressure Boundary and Reactor Containment Vessel Boundary," JEAC 4602, 1992
4. Kunitomi K., 'Thermal Transient Analyses during a Depressurization Accident in the High Temperature Engineering Test Reactor (HTTR)," JAERI-M 91-163, 1991