DOI: 10.1534/genetics.104.032292
The Influence of Genes on the Aging Process of Mice:
A Statistical Assessment of the Genetics of Aging
Joa˜o Pedro de Magalha˜es,*
,1Jose´ A. S. Cabral
†and Domingos Magalha˜es
‡*Department of Genetics, Harvard Medical School, Boston, Massachusetts 02115,†FEUP, University of Porto, 4150-564 Porto, Portugal and‡FLUP, University of Porto, 4200-465 Porto, Portugal
Manuscript received June 14, 2004 Accepted for publication September 29, 2004
ABSTRACT
Genetic interventions that accelerate or retard aging in mice are crucial in advancing our knowledge over mammalian aging. Yet determining if a given intervention affects the aging process is not straightfor-ward since, for instance, many disease-causing mutations may decrease life span without affecting aging. In this work, we employed the Gompertz model to determine whether several published interventions previously claimed to affect aging in mice do indeed alter the aging process. First, we constructed age-specific mortality tables for a number of mouse cohorts used in longevity experiments and calculated the rate at which mortality increases with age. Estimates of age-independent mortality were also calculated. We found no statistical evidence that GHRHR, IGF1R, INSR, PROP1, or TRX delay or that ATM⫹TERC, BubR1, klotho, LMNA, PRDX1, p53, WRN⫹TERC, or TOP3B accelerate mouse aging. Often, changes in the expression of these genes affected age-independent mortality and so they may prove useful to other aspects of medicine. We found statistical evidence that C/EBP, MSRA, SHC1, growth hormone, GHR, PIT1, and PolgA may influence aging in mice. These results were interpreted together with age-related physiological and pathological changes and provide novel insights regarding the role of several genes in the mammalian aging process.
A
LTHOUGH aging is a major biological problem, the rate at which mortality increases with age, which is the mechanisms involved are largely a mystery. a normal outcome of aging in most species (Pletcher One essential tool in understanding the biological basis et al.2000). Using the Gompertz equation it is possible of aging is the manipulation of the aging process in to calculate the mortality rate doubling time (MRDT; animal models. Namely, genetic interventions that ac- Finch 1990, pp. 22–24;Mueller et al. 1995). Caloric celerate or retard aging in mice are crucial in advancing restriction (CR) in rodents, for example, fulfills both our knowledge over the genetic and molecular mecha- these criteria since it roughly doubles the MRDT and nisms of mammalian aging (Liang et al. 2003;Hasty delays age-related debilitation (Weindruchand Wal-andVijg2004;QuarrieandRiabowol2004). Several ford 1988). Unfortunately, details of age-related interventions, including mutations, have been reported changes and MRDT calculations are rarely available in to increase or decrease life span when compared to genetic interventions affecting longevity in mice and so wild-type controls (Table 1). Yet determining if these researchers often assume that a change in longevity is interventions accelerate or delay aging is not straightfor- representative of a change in the aging process when ward since, for instance, many disease-causing muta- such may not be the case. Instead, changes in aging-tions may decrease life span without affecting aging. independent mortality may be the cause of a shortened Therefore, for genetic interventions to enhance our or lengthened life span (Finch 1990, pp. 22–25). For knowledge over aging it is crucial to discriminate be- example, cancer-promoting genes may decrease life span tween interventions affecting the aging process and in- in mice by increasing cancer rates without affecting terventions affecting health, as proposed by many others aging (Donehoweret al.1992).(Williams1999;Hayflick2000;Pletcheret al.2000). In this work, we first wanted to evaluate the Gompertz To ascertain whether aging changed or not due to a model to study aging in mice, particularly since such given intervention, one approach is to determine whether experiments often involve small cohorts. Afterward, we the pace of age-related changes and/or the onset of wanted to determine whether several published genetic age-related pathologies has shifted (e.g., Kuro-o et al. interventions affecting longevity in mice that have 1997;Miller2001). Another approach is to calculate hinted to influence aging do indeed affect the aging process. We calculated the MRDT for the mouse cohorts used in these experiments and tested whether the
1Corresponding author:Department of Genetics, Harvard Medical
changes in the MRDT derived from genetic interven-School, 77 Ave. Louis Pasteur, Room 238, Boston, MA 02115.
E-mail: [email protected] tions are statistically significant. If available, the
Given the short life span of many mutant cohorts, these values tion of age-related changes and pathology was also taken
were, at times, adjusted. Moreover, if the increase in hazard into consideration when interpreting the results. Our
rates decelerated at very old ages, these values were not consid-ultimate goal was to identify those genes that may be ered. When the logistic model was used, the entire mortality related to mammalian aging by determining which ones trajectory was analyzed.
To reduce the noise in the data, the T4253H smoothing affect aging rather than health and thus allow research
algorithm from the SPSS package (SPSS, Chicago) was applied on the biology of aging to focus on the mechanisms
to obtain the mortality curves. The smoothed values were used that indeed influence aging and not merely health.
to interpret the visual representations of the data, not to fit the Gompertz parametric model.
We tested for differences in the regression coefficient␣to MATERIALS AND METHODS calculate whether the MRDT differed among cohorts of the same experiment. Through a “dummy variables” test, we com-Mortality data were obtained from a number of published
pared the slopes of the experimental and wild-type hazard experiments that might alter the rate of aging in rodents
functions obtained by linear regression, as previously de-(Table 1). As described (Finch 1990, pp. 22–23, 123), data
scribed (Keppel1991, pp. 317–320;Guimara˜esandCabral
on mortality rate as a function of age were obtained from
1997, pp. 535–538). TheP-value was then obtained through mortality schedule data, where available, or extracted from
a one-tailedt-test since our aim was to find differences in one survivorship graphs. If necessary, the digital imaging software
specific direction. Paint Shop Pro 7 ( Jasc, Eden Prairie, MN) was used to capture
For each set of experiments we always used the same meth-from graphs the exact number of animals dying at each
con-odology in calculating the Gompertz parameters, so that de-stant time interval. In experiments where individual deaths
spite different approximations and different genetic back-were reported, discrete time intervals back-were set and the number
grounds and housing conditions used across experiments, we of animals dying at each interval counted. Even though other
could compare the Gompertz parameters for each experiment. methodologies may use individual day of death to infer the
The complete results are available as supplementary material at Gompertz parameters (Pletcheret al.2000), frequently such
http://www.genetics.org/supplemental/. Data analysis was per-data were unavailable and so we based our method on regular
formed using the SPSS package version 11.5 and regression time intervals. The length of the time interval for each cohort
analysis was obtained using SigmaPlot 7 (SPSS). was chosen to maximize the number of consecutive mortality
estimates during the exponential increase in mortality. For each time interval, the age-specific mortality (qx) was estimated
as the number of animals alive at the end of the interval over RESULTS the number of animals at the start of the interval. The hazard
The Gompertz mortality model:Given the large
num-rate (hz) was estimated by hz⫽2qx/(2⫺qx).
The Gompertz equation was used to model the aging pro- ber of experimental settings used in the studied cohorts, cess:Rm⫽R0e␣t, whereRmis the chance of dying—i.e., the hz our first step was to create coherent mortality curves
function—at aget,R0is the nonexponential factor in mortality, permitting an analysis of Gompertz parameters.
Unfor-and␣is the exponential parameter (Finch1990, pp. 13–22;
tunately, many published interventions affecting
longev-Strehler1999, pp. 111–113). Although other mathematical
ity in mice provide data in different forms, such as mor-models may be more accurate, given the limitations in sample
size, the Gompertz model is the most appropriate choice for tality schedule data and survivorship graphs. Therefore, this analysis since it is accurate while being simple enough to we built mortality tables using discrete time intervals fit most data (Wilson1994;Pletcheret al.2000;Pletcher
and estimating the age-specific mortality at each time 2002). The weighted linear regression was obtained from:
interval. These results are available as supplementary mate-ln(Rm)⫽ln(R0)⫹ ␣t and the MRDT given by: MRDT⫽0.693/
␣. Maximum-likelihood estimates of the Gompertz parameters rial at http://www.genetics.org/supplemental/ and may were also obtained through an R script by David Steinsaltz serve as the basis for other similar studies attempting to (http://www.demog.berkeley.edu/dstein/agingpage.html). compare the mortality curves of different mouse cohorts.
Larger data sets were also fit by the logistic model, which
We attempted to fit the Gompertz model to these data maintains the ␣-parameter while accounting for hazard-rate
sets. Since most experiments involved a small number of deceleration at old ages (Pletcheret al.2000):Rm⫽R0e␣t/
(1⫹s(R0/␣)(e␣t⫺1)). Importantly, our aim in this work was animals, the Gompertz model was deemed the most
not to find the best model to fit the whole mortality data appropriate (Wilson1994;Pletcher2002). Although but rather to determine whether the exponential increase of
we also derived Gompertz parameters using a maxi-mortality—i.e., the␣-parameter—was affected by a number of
mum-likelihood estimation (MLE) approach, the re-genetic perturbations. Consequently, we preferred the
sim-sults using linear regression yielded less MRDT variation pler, nested Gompertz model (withs⫽0) and, in the larger
data sets, frequently excluded data prior to the onset of senes- in control cohorts: 46%, while using MLE the relative cence and when hazard rates decelerated at very old ages, as standard deviation was 62%. Gompertz curves obtained detailed below; even so, we never excluded⬎10% of animals.
using an MLE approach were also less accurate in pre-The time when the exponential increase in mortality
oc-dictingt50(age when 50% of animals have died): 60% curred was selected, as previously done (Flurkeyet al.2001),
vs.11% using linear regression in relative variation be-and the initial mortality rate (IMR) was calculated from the
Gompertz equation on the basis of the mortality rate prior to tween the predicted and the observedt50. As such, and the age-related increase in mortality. If data were available for given the small size of the cohorts under study, the the entire life span of animals, then frequently a value oft⫽
Gompertz parameters estimated through linear regres-0.25 years was used, as previously described (Finch1990, pp.
sion were preferred. Moreover, in 14/15 experiments 22–23, 123). Alternatively, if data were available only after a
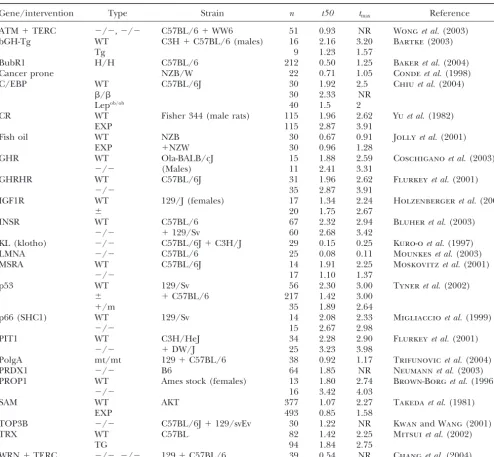
TABLE 1
Mortality parameters for different rodent populations with altered life span
Gene/intervention Type Strain n t50 tmax Reference
ATM⫹TERC ⫺/⫺,⫺/⫺ C57BL/6⫹WW6 51 0.93 NR Wonget al.(2003)
bGH-Tg WT C3H⫹C57BL/6 (males) 16 2.16 3.20 Bartke (2003)
Tg 9 1.23 1.57
BubR1 H/H C57BL/6 212 0.50 1.25 Bakeret al.(2004)
Cancer prone NZB/W 22 0.71 1.05 Condeet al.(1998)
C/EBP WT C57BL/6J 30 1.92 2.5 Chiuet al.(2004)
/ 30 2.33 NR
Lepob/ob 40 1.5 2
CR WT Fisher 344 (male rats) 115 1.96 2.62 Yuet al.(1982)
EXP 115 2.87 3.91
Fish oil WT NZB 30 0.67 0.91 Jollyet al.(2001)
EXP ⫹NZW 30 0.96 1.28
GHR WT Ola-BALB/cJ 15 1.88 2.59 Coschiganoet al.(2003)
⫺/⫺ (Males) 11 2.41 3.31
GHRHR WT C57BL/6J 31 1.96 2.62 Flurkeyet al.(2001)
⫺/⫺ 35 2.87 3.91
IGF1R WT 129/J (females) 17 1.34 2.24 Holzenbergeret al.(2003)
⫾ 20 1.75 2.67
INSR WT C57BL/6 67 2.32 2.94 Bluheret al.(2003)
⫺/⫺ ⫹129/Sv 60 2.68 3.42
KL (klotho) ⫺/⫺ C57BL/6J⫹C3H/J 29 0.15 0.25 Kuro-oet al.(1997)
LMNA ⫺/⫺ C57BL/6 25 0.08 0.11 Mounkeset al.(2003)
MSRA WT C57BL/6J 14 1.91 2.25 Moskovitzet al.(2001)
⫺/⫺ 17 1.10 1.37
p53 WT 129/Sv 56 2.30 3.00 Tyneret al.(2002)
⫾ ⫹C57BL/6 217 1.42 3.00
⫹/m 35 1.89 2.64
p66 (SHC1) WT 129/Sv 14 2.08 2.33 Migliaccioet al.(1999)
⫺/⫺ 15 2.67 2.98
PIT1 WT C3H/HeJ 34 2.28 2.90 Flurkeyet al.(2001)
⫺/⫺ ⫹DW/J 25 3.23 3.98
PolgA mt/mt 129⫹C57BL/6 38 0.92 1.17 Trifunovicet al.(2004)
PRDX1 ⫺/⫺ B6 64 1.85 NR Neumannet al.(2003)
PROP1 WT Ames stock (females) 13 1.80 2.74 Brown-Borget al.(1996)
⫺/⫺ 16 3.42 4.03
SAM WT AKT 377 1.07 2.27 Takedaet al.(1981)
EXP 493 0.85 1.58
TOP3B ⫺/⫺ C57BL/6J⫹129/svEv 30 1.22 NR KwanandWang(2001)
TRX WT C57BL 82 1.42 2.25 Mitsuiet al.(2002)
TG 94 1.84 2.75
WRN⫹TERC ⫺/⫺,⫺/⫺ 129⫹C57BL/6 39 0.54 NR Changet al.(2004)
n, number of animals in cohort;t50, time, in years, at which 50% of animals had died;tmax, maximum life span for cohort in
years. NR, not reported.
cohorts, similar results were obtained using linear re- MRDT in the wild-type cohorts: 110%vs. 34%, respec-tively. As also expected, the inverse correlation between gression and MLE. Both sets of results are available
as supplementary material at http://www.genetics.org/ ln(IMR) and t50was highly significant across cohorts for which we were able to fit the Gompertz model (P⬍ supplemental/.
Through linear regression, we calculated the MRDT 0.001), as was the correlation between ln(IMR) and the maximum life span or tmax (P ⬍ 0.001). Interestingly, for a number of experiments previously claimed to alter
aging in mice. Estimates of the IMR, which is expected to the correlation between MRDT andt50was not as statis-tically significant as the correlation between MRDT and be independent of the rate of aging, were also calculated
(Tables 2 and 3). Since the MRDT is expected to be tmax:P⫽0.103vs. P⫽0.007, respectively. This is clearly in support of the commonly cited notion that changes species specific and not affected by housing conditions,
TABLE 2
Gompertz parameters for cohorts used in life-extending experiments
MRDT ⌬age
Gene/intervention Type Strain ␣ ln(R0) r2 (yr) IMR changes
C/EBP WT C57BL/6J 2.53 ⫺5.70 0.86 0.27 0.52
/ 1.54 ⫺5.00 0.84 0.45 0.38 NR
Lepob/ob 3.26 ⫺5.70 0.94 0.21 0.19 NR
CR AL Fisher 344 4.13 ⫺8.61 0.84 0.17 0.031
CR (Male rats) 1.85 ⫺6.68 0.97 0.37 0.034 Delayed
FO AL NZB 9.10 ⫺6.26 0.92 0.08 0.73
FO ⫹NZW 4.92 ⫺5.34 0.79 0.14 0.56 NR
GHR WT Ola-BALB/cJ 1.94 ⫺4.34 0.81 0.36 0.52
KO (Males) 1.51 ⫺4.18 0.77 0.46 0.59 Delayed
GHRHR WT C57BL/6J 2.38 ⫺6.56 0.91 0.29 0.19
KO 2.50 ⫺7.31 0.84 0.28 0.15 NR
IGF1R WT 129/J 1.79 ⫺2.80 0.97 0.39 0.30
KO (Females) 2.20 ⫺4.26 0.97 0.32 0.06 NR
INSR WT C57BL/6 1.95 ⫺4.97 0.83 0.36 0.078
KO ⫹129/Sv 2.43 ⫺6.61 0.81 0.29 0.035 NR
p66 WT 129/Sv 6.22 ⫺13.37 0.92 0.11 1.7
KO 2.81 ⫺7.05 0.77 0.25 0.29 NR
PIT1 WT C3H/HeJ 3.05 ⫺7.63 0.90 0.23 0.020
KO ⫹DW/J 2.28 ⫺8.35 0.92 0.30 0.0035 Delayed
PROP1 WT Ames stock 0.92 ⫺2.06 0.45 0.75 1.29
KO (Females) 1.98 ⫺6.86 0.76 0.35 0.74 Unclear
TRX WT C57BL 1.71 ⫺3.27 0.64 0.41 1.13
TG 1.84 ⫺3.93 0.89 0.38 0.69 NR
␣, Gompertz slope or exponential parameter; ln(R0), nonexponential factor in mortality;r2, sum of squares; ⌬age changes, shift in pace of age-related changes; IMR, initial mortality rate in probability of dying per year; NR, none reported.
Strehler-Midvan theory (Strehler 1999, pp. 111–113; a physiological perspective that C/EBP delays aging (Chiuet al. 2004). In the same experiment, mice car-119–124), we found an inverse correlation between
log(R0) and ␣ (P ⬍ 0.001) but not between ln(IMR) rying theLepob/ob gene, which become obese due to an
excessive food intake, lived shorter lives than did con-and␣(P ⫽0.13).
In addition to the Gompertz parameters, we also de- trols and the MRDT decreased 22%, but the change in MRDT was not statistically significant (P⫽0.060). rived mortality plots as a data exploration technique
(Figures 1–3). Given the limitations in the Gompertz The MRDT increased almost 28% in mice mutant for GHR. Even though a slight shift in the slope of the calculations (seediscussion), plots with smoothed data
may be used as a complementary approach to the com- Gompertz curve was visible (Figure 1B), this was not statistically significant (P⫽0.300). From a physiological puted Gompertz parameters. Since the choice of onset
of senescence and outliers is partly subjective, different perspective it is arguable that GHR delays the onset of age-related pathology (Coschigano et al.2000, 2003; plots can be obtained for the same mortality data and
different interpretations are possible, as detailed below. Bartke2003). Given the small number of animals used in the experiment (n ⫽ 26), however, further studies
Genes deemed as delaying aging: Contrary to the
suggestion that they delay aging, manipulations in the are necessary.
An over twofold increase in MRDT was found in p66shc GHRHR, IGF1R, INSR, PROP1, and TRXloci failed to
increase the MRDT when compared to the correspond- ⫺/⫺mice when compared to controls, which was appar-ently a result of a delayed aging process (P ⫽ 0.007). ing control cohorts (Table 2). The MRDT increased in
C/EBP,GHR,p66shc, andPIT1mutants and so we decided Given the small number of animals used in the
experi-ment, however, the assumption that p66shc influences to further evaluate the significance of these results.
We found evidence thatC/EBPinfluences the rate of the rate of aging is premature. We did not remove any values from our calculations, given the small sample aging. Mice homozygous for the C/EBP protein had
a 67% higher MRDT, suggesting that aging is influenced size, and so the Gompertz slope appeared to decrease in the double-mutant mice (Figure 1C). In contrast, by C/EBP. The shift in MRDT was statistically significant
TABLE 3
Gompertz parameters for cohorts used in life-reducing experiments
MRDT ⌬age
Gene/intervention Type Strain ␣ ln(R0) r2 (yr) IMR changes
ATM⫹TERC ⫺/⫺,⫺/⫺ C57BL/6⫹WW6 0.52 ⫺1.76 0.16 ND 0.60 Accelerated
bGH-Tg WT C3H⫹ 2.03 ⫺4.83 0.90 0.34 0.17
Tg C57BL/6 (males) 3.73 ⫺5.08 0.87 0.19 1.28 Accelerated
BubR1 KO C57BL/6 2.34 ⫺2.69 0.879 0.30 1.0 Accelerated
klotho KO C57BL/6J⫹C3H/J 17.90 ⫺3.47 0.75 ND 7.8 Accelerated
LMNA KO C57BL/6 43.30 ⫺3.77 0.69 0.016 13 NR
MSRA WT C57BL/J6 1.39 ⫺2.25 0.99 0.50 0.41
KO 3.39 ⫺2.75 0.96 0.20 0.24 NR
NZW/B WT NZB/W 4.26 ⫺3.69 0.68 0.16 1.7 NR
p53 WT 129/Sv 2.76 ⫺7.55 0.80 0.25 0.48
KO ⫹C57BL/6 1.97 ⫺4.12 0.83 0.35 0.95 NR
TG 2.16 ⫺5.27 0.74 0.32 0.92 Accelerated
PolgA mut 129⫹C57BL/6 8.84 ⫺8.90 0.87 0.078 1.2 Accelerated
PRXD1 KO B6 1.00 ⫺2.97 0.34 0.70 0.64 NR
SAM WT AKT 1.85 ⫺3.86 0.80 0.37 0.63
SAM 3.27 ⫺4.06 0.89 0.21 0.77 Accelerated
TOP3B KO C57BL/6J⫹129/svEv 0.45 ⫺2.42 0.27 ND 1.2 NR
WRN⫹TERC ⫺/⫺,⫺/⫺ 129⫹C57BL/6 0.36 ⫺2.50 1.64 ND 1.17 Accelerated
␣, Gompertz slope or exponential parameter; ln(R0), nonexponential factor in mortality;r2, sum of squares;⌬age changes,
shift in pace of age-related changes; IMR, initial mortality rate in probability of dying per year; NR, none reported; ND, not determined.
in the slope of the Gompertz curve was no longer statisti- did not find similar evidence forPROP1(Table 2), which sits upstream ofPIT1.
cally significant (P⫽0.110).
Mice double mutant for PIT1 had a higher MRDT Nutrition and aging: Since CR had previously been shown to delay aging in rodents (Weindruchand Wal-(30% increase) and a significantly different Gompertz
slope (P⬍0.001), which hints thatPIT1may influence ford1988), we calculated the MRDT and IMR for calo-ric-restricted rats as a control (Table 2). Despite a de-the rate of aging (Figure 1D). Given that a delay in
age-related changes has been reported inPIT1knockouts crease in IMR, the MRDT in CR rats more than doubled when compared toad libitumcontrols (0.37vs.0.17 year), (Flurkey et al. 2001, 2002), it appears that the PIT1
locus may influence mammalian aging, even though we confirming that CR delays the rate of aging. These
re-Figure 1.—Natural logarithm
of mortality rates fitted using the T4253H smoothing algorithm. Lines represent estimated adult mortality trajectories based on Gompertz parameters for wild-type (straight lines) and experi-mental (dashed lines) conditions. (A) C/EBP wild type (solid dia-mond), /(open square), and /⫺Lepop/op(shaded circle). (B)
GHR wild type (solid diamond) and⫺/⫺KO (open square). (C) p66shc wild type (solid diamond)
Figure 2.—Natural logarithm of mortality rates fitted using the T4253H smoothing algorithm. Lines represent estimated adult mortality trajectories based on Gompertz pa-rameters for wild-type (straight lines) and experimental (dashed lines) con-ditions. (A) Rats fedad libitum(solid diamond) and food restricted (open square). (B) NZB/W mice fed corn oil (solid diamond) or fish oil (open square) and NZB/W control (shaded circle) from another experiment.
sults are in line with previous calculations (Finch1990, (0.016 years), but the IMR also increased dramatically (13/year or 1.1/month). Although the decrease in p. 508;Pletcheret al.2000), even though a variation
in the Gompertz parameters is expected due to differ- MRDT suggests that aging was accelerated in these ani-mals, that is not the interpretation we derive from the ences in the methodologies (seediscussion). The
nota-ble (Figure 2A) change in the slope of the Gompertz physiological observations (Mounkeset al.2003). The reported accelerated disease progression in these ani-curve in CR animals was statistically significant (P ⬍
0.001). When the logistic model was fit to controls (r2⫽ mals (Nikolova et al. 2004) and the high IMR raise doubts about whether we are dealing with accelerated 0.90), the MRDT was even lower: 0.07 year with the IMR
at 0.00016/year. aging or accelerated pathology (seediscussion).
Overexpression of transgenic growth hormone in We also calculated the Gompertz parameters for the
NZB/W strain, which has a significantly shorter life span mice reduces longevity (Bartke2003). Interestingly, it appears that mice overexpressing bovine growth hor-due to spontaneous cancer but for which accelerated
aging has not been described. The MRDT for the can- mone (bGH) have a lower MRDT: 0.19 vs. 0.34 years in controls (Figure 3A). Even though the IMR was in-cer-prone NZB/W mice was 0.16 year (Table 2), which
is slightly lower than that for other populations of NZB/ creased in transgenic mice (1.28 vs. 0.17/year), it ap-pears that growth hormone (GH) may indeed affect W mice, even though the NZB/W has a relatively low
MRDT when compared to other strains (Finch 1990, the rate of aging (P⫽ 0.015). A more careful analysis, however, warns caution. The number of animals used pp. 322–323; 508). Not surprisingly, the IMR was very
high in the NZB/W strain (1.7/year). in the experiment is small (n ⫽ 25). Moreover, if the first three points in the controls were excluded, judging One surprising finding was that fish oil could shift the
Gompertz slope in NZB/W mice. The MRDT increased that the onset of senescence occurs only afterward, then the MRDT for controls dropped to 0.25 years and the almost twofold in animals fed fish oil (Table 2) and fish
oil appeared to affect the Gompertz slope (Figure 2B). shift in MRDT was no longer statistically significant (P⫽ 0.101). Finally, the logistic model appeared to give a These results were statistically significant (P ⬍ 0.001).
On the other hand, the control value for MRDT (0.08 better fit to the control data: r2 ⫽ 0.93 with IMR ⫽ 0.066/year and MRDT⫽0.24 years, arguing that larger years) was lower than that reported for this strain, so we
cannot exclude some sort of artifact as an explanation data sets are needed to fully understand the mortality patterns of these animals.
(Figure 2B).
Genes deemed as accelerating aging: As for genes InMSRA⫺/⫺mice, we found a decrease of 60% in
the MRDT (Table 3), consistent with a shift in the slope hinted to accelerate aging, we were unable to calculate
the MRDT forATM⫹TERCandWRN⫹TERCknock- of the Gompertz curve (Figure 3B) and in the rate of aging (P⬍0.001). Although an accelerated aging pheno-outs, TOP3B ⫺/⫺, and klotho ⫺/⫺ mice because we
could not fit the Gompertz model to these experiments type has not been described in MSRA ⫺/⫺mice, our results suggest thatMSRAcould influence mammalian (see discussion). Although we calculated the MRDT
forBubR1andPRDX1mutants, the obtained values, 0.30 aging. Since there was a⬎30% discrepancy between the observedt50and thet50predicted from the Gompertz and 0.70 years, respectively, do not suggest a decrease in
MRDT even though control values are absent (Table parameters, further studies using a larger data set are needed.
3). Given the large (n⫽212) number of animals used
in theBubR1experiment, we also fit the logistic model Recently, mice with a disrupted DNA mitochondrial polymerase (PolgA) have been reported to age faster (r2 ⫽0.92) but, again, found no indication that aging
was accelerated in these animals: IMR⫽ 1.4/year and than controls (Trifunovic et al. 2004). Our results clearly support this view (Table 3). Even though survival MRDT⫽0.82 years.
Figure3.—Natural logarithm of mor-tality rates fitted using the T4253H smoothing algorithm. Lines represent estimated adult mortality trajectories based on Gompertz parameters for wild-type (straight lines) and experimental (dashed lines) conditions. (A) Bovine GH wild-type (solid diamond) and trans-genic (open square) mice; straight shaded line represents an alternative for the control cohort (shaded diamond) that excludes the first two points as outli-ers. (B) MSRA wild type (solid diamond) and⫺/⫺KO (open square). (C) PolgA mut/mut (open square), p53 wild type (solid diamond), and INSR WT (shaded diamond). (D) SAM wild type (solid dia-mond) and SAM (open square); shaded lines represent alternatives dividing each cohort in two at 0.94 years of age; the vertical dashed line represents the point in time at which the mortality curve was changed in both cohorts used in the SAM experiment (t⫽0.94 years).
with controls of the same strain—129⫹C57BL/6—taken larly since most of the described experiments have not been replicated. Yet our aim was not to study the entire from other experiments suggest an accelerated aging
phenotype (Figure 3C). mortality trajectory but rather to assert whether a num-ber of genetic interventions affected aging or not. As-The senescence-accelerated mouse (SAM) has been
claimed as a model of accelerated aging (Takedaet al. suming that each experimental cohort featured the same mouse strain and was subjected to similar environ-1981). In line with previous reports, the MRDT
de-creased by over 40% and the Gompertz slope appeared mental conditions as the control cohort, our rationale was that the genetic perturbation under study was re-to be affected (P⬍0.001). Although these results
indi-cate that the selection of SAM did indeed provide a sponsible for the change in longevity by altering the rate of aging, aging-independent mortality, or both. By model of accelerated aging, the erratic Gompertz curve
is worthy of a more careful evaluation (Figure 3D). Prior focusing on individual experiments, we were then able to compare the Gompertz parameters between the co-to age 1, the difference in the Gompertz slope between
control and SAM mice is not significant (P⫽0.99), but horts and, in most cases, determine whether the rate of aging was indeed altered. Although large amounts afterwards it becomes highly significant (P ⬍ 0.001).
Therefore, environmental conditions could play a role of animals—in the order of several hundred individu-and thus bias the results (see discussion). Another als—are needed to study the entire mortality trajectory possibility is that given the large number of animals of a given species (e.g.,Wilson1994;Pletcher2002), used in the experiment, the Gompertz model does not our results show that the Gompertz model is suitable to capture the real mortality trajectory. We also fit the evaluate the rate of aging in rodent experiments. It is logistic model to the data from the SAM experiment: possible to use our approach to derive meaningful conclu-for controls the IMR was 0.089/year (R0⫽ ⫺4.95) and sions even from experiments using a small number of the MRDT 0.18 years (r2⫽0.96) while for the SAM the
animals, provided some precautions are taken (discussed IMR was 0.42/year (R0⫽ ⫺7.04) with an MRDT of 0.08 below).
years (r2 ⫽ 0.96), arguing in favor of seeing SAM as
The analysis of mouse longevity studies faces several animals with accelerated aging. potential artifacts and great care is necessary to analyze the results. For instance, researchers often report in-complete mortality curves, excluding deaths occurring DISCUSSION
prior to the onset of senescence or accidental deaths, which may be misleading in calculating the Gompertz
The Gompertz equation as a tool for the study of
parameters. In addition, housing conditions and other
mammalian aging:Most studies based on the Gompertz
experimental variables may cause an increase in mortal-equation have been conducted in large experimental
ity that biases the results. The large variation in IMR sets, such as those involving invertebrates (Wilson1994;
among controls supports this view: a relative standard Muelleret al.1995;Pletcher2002). Thus one
In fact, 10-fold differences in IMR estimates have been A measure of the genetics of mammalian aging:We failed to find statistical evidence that IGF1R, INSR, observed for the same cohort when different
methodol-ogies are used (Finch1990, p. 507). Consequently, com- PROP1,GHRHR, orTRXretard the rate of aging. The results forPROP1, despite the possible need for larger parisons between different experimental settings must
be done with care due to differences in the genetic back- data sets, are in accordance with previous reports sug-gesting that these double-mutant mice do not age more ground of the animals used, housing conditions, and
methodology. This rationale also implies that adequate slowly (Quarrie andRiabowol 2004). Since there is little or no published information that theselociaffect controls are necessary, which is not the case in a number
of experiments (Table 1). the progression of age-related changes and/or patholo-gies, we suggest that these genes do not influence aging We employed the nested Gompertz model not taking
into account parameters such as the degree of heteroge- in mice. Changes in the expression of these genes ap-pear to decrease the IMR and so they may be useful to neity or the Makeham constant. In some cases, more
complex models may fit the data better: for example, other aspects of medicine. Alternatively, it is possible that we were unable to detect changes in rate of aging in the CR experiment the Gompertz model fits the CR
group but the logistic-Makeham model offers a better either because of errors in the experiments or because the samples were not large enough. For instance, the fit to the control group (Pletcher et al.2000). Even
though the MRDT always increases in CR animals, a IMR forTRXcontrols was much higher than that usually reported for the C57BL strain, and their longevity was significant variation in MRDT is observed among
meth-odologies. The MRDT that we obtained for the control considerably lower (Lianget al.2003). As acknowledged by the authors of the experiment, environmental condi-group was 0.17 years, compared to the 0.30 years in the
work ofFinch (1990, p. 508) and the 0.10 years using tions may be to blame for increasing mortality and thus a bias in the results. Fortunately, similar experiments the logistic-Makeham model (Pletcher et al. 2000).
Using the logistic model, we obtained an MRDT of 0.07 are being conducted at another facility to confirm the role, if any, ofTRXin aging (Mitsuiet al.2002). years. Therefore, we preferred to be consistent and use
the simpler Gompertz model, in line with other works On the other hand, we found some statistical evidence thatC/EBP,GHR,PIT1, andp66shccould influence aging
(Finch 1990, pp. 507–510; Flurkey et al. 2001). By
eliminating deaths prior to the onset of senescence and in mice. Similarly, transgenic mice overexpressing bo-vine GH appeared to age faster, which provides evidence deaths at very late ages and by creating visual displays
of the data (seematerials and methods), we obviated that the growth hormone pathway is involved in mam-malian aging. In fact, cognitive decline has been delayed common problems in analyzing mortality data, such as
the deceleration of mortality at high ages. While other inGHR⫺/⫺mice and accelerated in bGH transgenic mice (Bartke 2003; Quarrie and Riabowol 2004). models may fit the entire mortality trajectory better,
our calculations provide a simple but effective way to The way in which the GH pathway appears to impact on aging may be interpreted as a side effect of its stimula-estimate whether the aging process differs between
co-horts of the same experimental background. Overall, tory effects on development: growth, maturation, and reproduction, as argued before (Bartke2003). On the it is the combination of Gompertz parameters, visual
representations, and age-related physiological changes other hand, although a shift in the Gompertz slope was visible in GHR mutant animals (Figure 3A), removing that may help us to infer whether a given intervention
has or has not affected the aging process. outliers and adjusting the age at which mortality begins to climb affected the results, making the shift in the Although it has already been argued by others (Finch
1990, pp. 24–29;Williams1999;Hayflick2000), our Gompertz slope no longer statistically significant (P ⫽ 0.101). Therefore, further studies are necessary. work demonstrates that changes in average and/or
max-imal longevity are not reliable indicators of alterations Clearly, thep66shc
experiment deserves further atten-tion since the number of animals used was relatively in the aging process. Even thoughtmaxmay in some cases
be an indicator of shifts in the rate of aging, we advise small (n ⫽ 29). In fact, it is frustrating to analyze the experiment onp66shc, one of the splice variants of the
caution in future such studies. It is important that
re-searchers reporting interventions affecting life span also SHC1locus. Despite the intriguing increase in longevity (Migliaccioet al.1999) and the increased MRDT, sug-calculate the Gompertz parameters and describe
age-related changes in biochemical and physiological indi- gesting that theSHC1locus could indeed affect aging, little information is available on thep66shc
double-knock-cators. Finally, since some interventions may mimic
calo-ric restcalo-riction by, for instance, reducing food intake, out strain: there is barely any information on age-related changes, cancer incidence, morbidity, or developmental it is important to have body weight information and
developmental schedules for life-extending experi- schedules. In addition, it has been argued that thep66shc
controls lived a shorter time than in other experiments ments. This is exemplified by the C/EBP ⫹/⫹cohort,
which lived longer and had a higher MRDT, but also using the 129/Sv strain and so it is possible that the increased longevity of p66shc ⫺/⫺ mice is due to
in-had a much lower average body weight than controls
al.2003). Indeed, the MRDT that we obtained for the ble 3). As such, we think the Gompertz model is best used in comparing cohorts of the same experiment. In wild-type cohort (0.11 years) was the lowest among
con-trols (Tables 2 and 3). Further studies of this gene and addition, it appears that the Gompertz model is better suited to investigate extending rather than life-these double-knockout mice are necessary to address
these questions. reducing experiments due to the extreme pathologies
that can affect animals in the latter experiments. The C/EBP proteins are involved in fat metabolism
with C/EBPpreventing lipid accumulation. If indeed We also found statistical evidence that SAM are in-deed senescence accelerated, in line with what was origi-the aging process is influenced by C/EBP, as suggested
by our results, one possible mechanism is an alteration nally reported (Takedaet al.1981). Even so, at about 1 year of age there is a bizarre shift in the Gompertz in metabolism, similar to what occurs in CR. In fact, as
mentioned earlier, body weight is significantly de- slope (Figure 3D). Since the logistic model provided a good fit for the SAM experiment, it can be argued that creased throughout life in C/EBP ⫹/⫹ animals and
increased in theLepop/opcohort (Chiu
et al.2004). the deceleration of hazard rates at later ages is responsi-ble for this phenomenon. Yet t50 was very different It remains to be seen whetherklothoandTOP3Baffect
aging and whether ATM ⫹ TERC and WRN ⫹ TERC between both cohorts at the time the shift in mortality was observed, which suggests that this phenomenon may knockouts age faster. We failed to calculate the MRDT
for these cohorts, presumably because the IMR is so not be related to aging. A number of environmental conditions—such as housing conditions—could have high and the pathologies affecting these animals so
se-vere that animals die before the onset of aging. Alterna- increased the mortality prior to age 1. The fact that only after age 1 does the Gompertz slope change is an tively, the high IMR masks aging-related mortality.
Inter-estingly, we found similar problems in calculating the indication that only under optimum conditions could the shift in the Gompertz slope be detected. On the MRDT for strains with mutations at the LMNA and
PRDX1 loci and for the NZB/W strain, although to a other hand, it can be argued that since⬍50% of SAM animals were alive after age 1, comparing the mortality lower degree. Our suggestion is that disease rather than
aging is fostered in these animals, causing an increase curves after this point is not representative of the real mortality trajectory.
in aging-independent mortality and thus a shorter life
span. The surprisingly high values in the MRDT ob- Two novel findings were that the PolgA and MSRA loci may influence mammalian aging. Interestingly, tained forPRDX1mutant mice are probably a result of
the increased pathologies affecting these animals and MSRA was shown to affect not only longevity but also the rate of aging in Drosophila (Ruanet al.2002). Our masking the calculations, in line with the
Strehler-Mid-van theory in which high age-independent mortality results suggest that theMSRAgene merits further atten-tion. Finally, PolgA appears to affect mammalian aging, increases the MRDT (Strehler1999, pp. 111–113, 119–
124). Indeed, the correlation coefficient for the PRDX1 even though control cohorts were not from the same experimental setting.
mutant mice was 0.34.
Despite the low MRDT for LMNA ⫺/⫺ mice, our Concluding remarks:Unfortunately, many research-ers publishing mortality data do not make the distinc-interpretation is that these results represent a limitation
of the Gompertz model rather than a case of accelerated tion between interventions affecting aging and interven-tions affecting longevity. In this work, we addressed this aging. As pointed out by others (Finch1990, pp. 24–25;
Miller2001), specific diseases affecting a given strain problem and redefined the role of several loci in the aging process of mice with multiple implications for can alter the MRDT and thus mask the real impact of
genetic interventions on aging. The incidence and rapid future research on aging conducted in genetically modi-fied mice and for understanding the genetics of human progress of cardiomyopathy in these animals (Nikolova
et al. 2004) leads us to think they are not suffering aging. Our work also provides a refined but simple method to evaluate the influence of genetic interven-from premature senescence but rather interven-from premature
lethality, or a form of mechanical senescence. In fact, tions in murine aging that should be implemented by researchers conducting longevity studies.
although rare, there are cases of disease-prone mouse
strains having a very low MRDT. For instance, the MRDT Many thanks go to Simon Klebanov of Columbia University for for the D2SM females has been reported as 0.04 years comments on the manuscript and David Steinsaltz of the University of California, Berkeley, for his thoughtful criticisms. Further thanks with an IMR of 0.2/year (Finch1990, p. 322). Similarly,
go to Joana Costa for assistance in preparing the manuscript. J. P. one could argue that the relatively small MRDT for the
de Magalha˜es is supported by National Institutes of Health-National NZW/B strain results from increased cancer incidence. Human Genome Research Institute Centers of Excellence in Genomic Perhaps the increase in cancer incidence leads to an Science grant to George Church.
increase in IMR and a decrease in MRDT even though the aging process has not been changed (Miller2001).
That is, however, not observed in the p53 experiment, LITERATURE CITED
where despite large variations in cancer incidence, lon- Baker, D. J., K. B. Jeganathan, J. D. Cameron, M. Thompson, S.
Juneja et al., 2004 BubR1 insufficiency causes early onset of
(Ta-aging in mice, pp. 369–395 inHandbook of the Biology of Aging,
36:744–749.
Bartke, A., 2003 Can growth hormone (GH) accelerate aging? Evi- Ed. 5, edited by E. J.Masoroand S. N.Austad. Academic Press,
New York. dence from GH-transgenic mice. Neuroendocrinology78:210–
216. Mitsui, A., J. Hamuro, H. Nakamura, N. Kondo, Y. Hirabayashi
et al., 2002 Overexpression of human thioredoxin in transgenic
Bluher, M., B. B. KahnandC. R. Kahn, 2003 Extended longevity
in mice lacking the insulin receptor in adipose tissue. Science mice controls oxidative stress and life span. Antioxid. Redox Signal.4:693–696.
299:572–574.
Brown-Borg, H. M., K. E. Borg, C. J. MeliskaandA. Bartke, 1996 Moskovitz, J., S. Bar-Noy, W. M. Williams, J. Requena, B. S.
Ber-lettet al., 2001 Methionine sulfoxide reductase (MsrA) is a Dwarf mice and the ageing process. Nature384:33.
Chiu, C. H., W. D. Lin, S. Y. HuangandY. H. Lee, 2004 Effect of regulator of antioxidant defense and lifespan in mammals. Proc.
Natl. Acad. Sci. USA98:12920–12925. a C/EBP gene replacement on mitochondrial biogenesis in fat
cells. Genes Dev.18:1970–1975. Mounkes, L. C., S. Kozlov, L. Hernandez, T. SullivanandC. L.
Stewart, 2003 A progeroid syndrome in mice is caused by
Conde, C., S. Weller, S. Gilfillan, L. Marcellin, T. Martinet al.,
1998 Terminal deoxynucleotidyl transferase deficiency reduces defects in A-type lamins. Nature423:298–301.
Mueller, L. D., T. J. NusbaumandM. R. Rose, 1995 The Gompertz
the incidence of autoimmune nephritis in (New Zealand Black⫻
New Zealand White)F1 mice. J. Immunol.161:7023–7030. equation as a predictive tool in demography. Exp. Gerontol.30:
553–569.
Coschigano, K. T., D. Clemmons, L. L. BellushandJ. J. Kopchick,
2000 Assessment of growth parameters and life span of GHR/ Neumann, C. A., D. S. Krause, C. V. Carman, S. Das, D. P. Dubey
et al., 2003 Essential role for the peroxiredoxin Prdx1 in erythro-BP gene-disrupted mice. Endocrinology141:2608–2613.
Coschigano, K. T., A. N. Holland, M. E. Riders, E. O. List, A. cyte antioxidant defence and tumour suppression. Nature424:
561–565.
Flyvbjerg et al., 2003 Deletion, but not antagonism, of the
mouse growth hormone receptor results in severely decreased Nikolova, V., C. Leimena, A. C. Mcmahon, J. C. Tan, S. Chandar
et al., 2004 Defects in nuclear structure and function promote body weights, insulin, and insulin-like growth factor I levels and
increased life span. Endocrinology144:3799–3810. dilated cardiomyopathy in lamin A/C-deficient mice. J. Clin. In-vest.113:357–369.
Donehower, L. A., M. Harvey, B. L. Slagle, M. J. McArthur,
C. A. Montgomery, Jr.et al., 1992 Mice deficient for p53 are Pletcher, S. D., 2002 Mitigating the tithonus error: genetic analysis
of mortality phenotypes. Sci. Aging Knowledge Environ.2002:
developmentally normal but susceptible to spontaneous tumours.
Nature356:215–221. pe14.
Pletcher, S. D., A. A. KhazaeliandJ. W. Curtsinger, 2000 Why
Finch, C. E., 1990 Longevity, Senescence, and the Genome. The
Univer-do life spans differ? Partitioning mean longevity differences in sity of Chicago Press, Chicago/London.
terms of age-specific mortality parameters. J. Gerontol. A Biol.
Flurkey, K., J. Papaconstantinou, R. A. MillerandD. E. Harrison,
Sci. Med. Sci.55:B381–B389. 2001 Lifespan extension and delayed immune and collagen
Quarrie, J. K., andK. T. Riabowol, 2004 Murine models of life
aging in mutant mice with defects in growth hormone
produc-span extension. Sci. Aging Knowledge Environ.2004:re5. tion. Proc. Natl. Acad. Sci. USA98:6736–6741.
Ruan, H., X. D. Tang, M. L. Chen, M. L. Joiner, G. Sunet al., 2002
Flurkey, K., J. PapaconstantinouandD. E. Harrison, 2002 The
High-quality life extension by the enzyme peptide methionine Snell dwarf mutation Pit1(dw) can increase life span in mice.
sulfoxide reductase. Proc. Natl. Acad. Sci. USA99:2748–2753. Mech. Ageing Dev.123:121–130.
Strehler, B. L., 1999 Time, Cells, and Aging. Demetriades Brothers,
Guimara˜es, R. C., andJ. A. S. Cabral, 1997 Estatı´stica.
McGraw-Larnaca, Cyprus. Hill, Lisbon.
Takeda, T., M. Hosokawa, S. Takeshita, M. Irino, K. Higuchiet
Hasty, P., andJ. Vijg, 2004 Accelerating aging by mouse reverse
al., 1981 A new murine model of accelerated senescence. Mech. genetics: a rational approach to understanding longevity. Aging
Ageing Dev.17:183–194. Cell3:55–65.
Trifunovic, A., A. Wredenberg, M. Falkenberg, J. N. Spelbrink,
Hayflick, L., 2000 The future of ageing. Nature408:267–269.
A. T. Rovioet al., 2004 Premature ageing in mice expressing
Holzenberger, M., J. Dupont, B. Ducos, P. Leneuve, A. Geloenet
defective mitochondrial DNA polymerase. Nature429:417–423.
al., 2003 IGF-1 receptor regulates lifespan and resistance to
Tyner, S. D., S. Venkatachalam, J. Choi, S. Jones, N. Ghebranious
oxidative stress in mice. Nature421:182–187.
et al., 2002 p53 mutant mice that display early ageing-associated
Jolly, C. A., A. Muthukumar, C. P. Avula, D. TroyerandG.
Fer-phenotypes. Nature415:45–53.
nandes, 2001 Life span is prolonged in food-restricted
autoim-Weindruch, R., andR. L. Walford, 1988 The Retardation of Aging
mune-prone (NZB⫻NZW)F(1) mice fed a diet enriched with
and Disease by Dietary Restriction. C. C. Thomas, Springfield, IL. (n-3) fatty acids. J. Nutr.131:2753–2760.
Williams, G. C., 1999 The 1999 Crafoord Prize lectures. The
Titho-Keppel, G., 1991 Design and Analysis: A Researcher’s Handbook.
Pren-nus error in modern gerontology. Q. Rev. Biol.74:405–415. tice-Hall, Englewood Cliffs, NJ. Wilson, D. L., 1994 The analysis of survival (mortality) data: fitting
Kuro-o, M., Y.Matsumura, H.Aizawa, H.Kawaguchi, T.Sugaet Gompertz, Weibull, and logistic functions. Mech. Ageing Dev. al., 1997 Mutation of the mouse klotho gene leads to a syndrome 74:15–33.
resembling ageing. Nature390:45–51. Wong, K. K., R. S. Maser, R. M. Bachoo, J. Menon, D. R. Carrasco
Kwan, K. Y., andJ. C. Wang, 2001 Mice lacking DNA topoisomerase et al., 2003 Telomere dysfunction and Atm deficiency
compro-IIIbeta develop to maturity but show a reduced mean lifespan. mises organ homeostasis and accelerates ageing. Nature421: Proc. Natl. Acad. Sci. USA98:5717–5721. 643–648.
Liang, H., E. J. Masoro, J. F. Nelson, R. Strong, C. A. Mcmahan Yu, B. P., E. J. Masoro, I. Murata, H. A. BertrandandF. T. Lynd,
et al., 2003 Genetic mouse models of extended lifespan. Exp. 1982 Life span study of SPF Fischer 344 male rats fed ad libitum Gerontol.38:1353–1364. or restricted diets: longevity, growth, lean body mass and disease.
Migliaccio, E., M. Giorgio, S. Mele, G. Pelicci, P. Reboldi et J. Gerontol.37:130–141.
al., 1999 The p66shc adaptor protein controls oxidative stress