Evolutionary Analysis o f Protein Structural
Families to Assist Comparative M odelling of
Genome Sequences
Gabrielle Anne Reeves
Biomolecular Structure and Modelling Unit
Department of Biochemistry and Molecular Biology
University College London
A thesis subm itted to the University of London in the
Faculty of Science for the degree of Doctor of Philosophy
ProQuest Number: U642456
All rights reserved
INFORMATION TO ALL USERS
The quality of this reproduction is dependent upon the quality of the copy submitted.
In the unlikely event that the author did not send a complete manuscript and there are missing pages, these will be noted. Also, if material had to be removed,
a note will indicate the deletion.
uest.
ProQuest U642456
Published by ProQuest LLC(2015). Copyright of the Dissertation is held by the Author.
All rights reserved.
This work is protected against unauthorized copying under Title 17, United States Code. Microform Edition © ProQuest LLC.
ProQuest LLC
789 East Eisenhower Parkway P.O. Box 1346
A bstract
The CATH domain database clusters closely related structures (>35% sequence identity) into families. More distant evolutionary links between these families are identified by common se quence patterns, functional and structural motifs in order to cluster further into homologous superfamilies. Relatives in these homologous superfamilies share core structural similarity. However, in some superfamilies extensive structural embellishments are observed. This the sis presents an analysis of the structural variability of the homologous superfamilies in the CATH database, focusing on the secondary structure embellishments present in many of the more variable families. It was found that secondary structure elements are inserted into a number of places in the peptide chain but are often co-located on the three-dimensional struc ture. Using this information, a protocol is developed to correlate the structural embellishments with the functional changes observed in three particularly variable families; the ATP-dependent carboxylase-amine/ thiol ligase superfamily, the cupredoxin superfamily and the thioredoxin su perfamily. A number of conclusions are drawn from this structural analysis, the embellishments often mediate the domain interfaces, illustrated in the cupredoxin and ATP-grasp superfamilies. Additionally, modifications to the active sites occur through the additions of secondary structure elements. In the ATP-grasp superfamily, a large embellishment encloses the active site in some members.
Experimental techniques for solving the three dimensional structure of a protein, primarily NMR and X-ray crystallography, are often hampered by technical limitations making them time consuming, and so comparative modelling techniques are being explored to create theoretical three-dimensional structural models. The second part of this thesis considers ways of mod elling genome sequences, with assignments to CATH homologous superfamilies, by comparative modelling. An automatic comparative modelling pipeline has been developed where genome sequences are aligned and modelled using publicly available software in an optimised protocol (GenMod). GenMod was tested using a large dataset of 140 relatives from CATH superfamilies. Software to assess the quality of these models was selected and tested. One of the main areas reported to need improvement in current comparative modelling techniques is parent selection and here, a novel method is explored. Sets of parent structures have been created from structural sub-groups within each homologous superfamily. Regions from each of these parents were then selected by sequence similajity to create a final structural template. Results from the analysis showed that, below 30% none of the methods perfomed well, above 55% the closest relative is the best parent and between 30 and 55% the best method uses multiple parents.
A cknow ledgem ents
First and foremost, thanks to Christine Orengo for the supervision and to Andrew Martin
for making me feel so welcome at Reading and at his home for chapter chats as well as a
wealth of other subjects.
UCL has meant two things, great work and great friends. To everyone in Janet Thornton
and Christine Orengo’s groups, your banter and bioinformatics have helped me enor
mously. But to mention a few heroes...
Ian Sillitoe and James Bray, who made me feel so welcome from my very first day. James
for his good ideas and his endless pocket sized programs and Ian who has been so generous
with his time answering my coding questions, of which there were many. Thanks also for
the support you have given me throughout the write-up. Russell Marsden, a recent joiner
to the lab hasn’t had a moment’s peace since he arrived. I would be some way from Solla Sollew without your suggestions, fantastic support and not to mention your very polite
way of telling me to just do it! Annabel Todd for four years of friendship, chats, chapters
comments, the placing of commas and other such fiddly things. Dan Buchan who arrived a week earlier than me, bagged the best desk and from then seemed to be just ahead of
me at every turn. SWOT! Oliver Redfern for brightening up the long dark write-up with
his endless hilarious stories of the Redfern family and latest updates on his poor sickly
constitution. Stuart Rison for his great write up advice (more colour = less critical (I
hope it works...)) and the LaTeX tips. Adrian Shepherd for the support and gossip even after he left for the dark side. Neil Stoker for asking how I was AND listening to the
answer... Mark Dibley for perspective - I always knew who to come to when things were
beginning to get out of hand. Stephen Campbell for being a great friend, Tina Eyre and Patricia Furtardo for the female support, Brian Ferguson for the Friday night fun in the
JB and Thomas Kabir for sharing the write-up pain with me. Thanks also to Alistair
G rant, Andrew Harrison, Frances Pearl, Mike Plevin, Sarah Addon, Juan Antonio, Chris
Bennett, Ilhem Diboun, Adrian EkoUkeh, Dave Lee, Stefano Lise and Stathis Sideris who
all made the lab an enjoyable place to be.
To those behind the scenes: I would not have managed without the help of Duncan
computers in my first week and the three newest arrivals, Jahid Ahmed and Donovan
Binns and Jessie Oldershaw who cleared up after my blunders.
And of course not forgetting all those at the EBI who I still consider to be part of the
BSM unit at UCL. We don’t like to think of you as in any way inferior (even though you
are). Most im portantly to Gail B artlett for keeping a foot in both camps and to Hugh
Shanahan for the wonderful emails and his very generous help with the EBI software.
A very special thank you to Chris Taggart (and his credit card) who have been so un
believably supportive whilst suffering bravely throughout many thesis rants and trips to
Gap. You have kept me from the doors of insanity with your unique perspective on life.
Finally, to my family. To Rachel and Rob Greening for making me laugh and showing
me th a t compared to them, I am sane. Finally, to my parents, Janet and Ken, I dedicate this thesis to them for their encouragement, patience, love, hugs, the confidence to start
the PhD in the first place and the support to finish it.
I ’ve bought a big bat. I ’m all ready, you see.
C ontents
A bstract 2
Acknowledgem ents 3
Contents 5
List of Figures 12
List of Tables 17
A bbreviations 18
A m ino Acid A bbreviations 19
1 Introduction 20
1.1 The Hierarchy of Protein S tr u c tu r e ... 20
1.1.1 Prim ary Structure ... 20
1.1.2 Secondary S t r u c t u r e ... 21
1.1.3 Super-secondary S tru c tu re ... 22
1.1.4 Tertiary Structure ... 23
1.1.5 Q uaternary S tru c tu re ... 24
1.2 Protein D o m a i n s ... 24
1.3 Convergent and Divergent E v o lu tio n ... 24
1.3.1 Domain Evolution ... 25
1.4 Domains and F u n c tio n ... 26
1.4.1 Functional Classification S chem es... 26
1.4.1.1 Enzyme Commission Numbers ... 27
1.4.1.2 Gene O n to lo g y ... 27
1.4.2 Methods for Predicting Function from S tr u c tu r e ... 27
Contents
1.5.1 Substitution M atrices... 28
1.5.1.1 Amino Acid Propensities... 28
1.5.1.2 Observed M u ta tio n s ... 28
1.5.1.3 Dayhoff or Point Accepted M utation (P A M )... 29
1.5.1.4 BLOcks su b stitution M atrix (BLOSUM) ... 30
1.5.2 Insertions and D e le tio n s ... 30
1.5.2.1 Local and Global S im ila rity ... 30
1.5.3 D atabase Searching: PASTA and B L A S T ... 33
1.5.4 Profile-based Sequence C o m p ariso n ... 35
1.5.4.1 PS I-B L A S T ... 36
1.5.4.2 Hidden Markov Models ... 36
1.5.5 Structure C o m p a ris o n ... 38
1.5.5.1 The Relationship Between Sequence and Structure . . . . 38
1.5.5.2 S S A P ... 41
1.5.5.3 C R A T H ... 43
1.5.6 Structural C la ssifica tio n ... 44
1.5.6.1 C A T H ... 44
1.5.7 S C O P ... 46
1.5.8 O ther Structure Classification D a ta b a s e s ... 46
1.6 Protein Structure P re d ic tio n ... 48
1.6.1 Secondary Structure P r e d ic tio n ... 48
1.6.2 Tertiary Structure P r e d ic tio n ... 48
1.6.2.1 Comparative M o d e llin g ... 49
1.7 Aims of the T h e s i s ... 49
2DSEC: A Two-Dim ensional Representation o f Three-D im ensional Structure 51 2.1 In tro d u c tio n ... 51
2.1.1 B a c k g ro u n d ... 51
2.1.2 Aims of the C h a p t e r ... 52
2.2 M e th o d s ... 54
2.2.1 Secondary Structure Assignment ... 54
2.2.2 CORA: Multiple Structural A lig n m e n t... 54
2.2.3 2DSEC: Two-Dimensional Secondary Structure Summary of Three-Dimensional Structure... 56
2.2.3.1 The 2DSEC A lgorithm ... 58
Contents
2.3 S u m m a r y ... 63
Structural Evolution in Protein Super families 65 3.1 In tro d u c tio n ... 65
3.1.1 B a c k g ro u n d ... 65
3.1.2 Identifying Evolutionary Relationships in the CATH Database . . . 66
3.1.3 Convergent and Divergent E v o lu tio n ... 67
3.1.4 Sequence and Structural Variability in Homologous D o m a in s... 67
3.1.4.1 Previous Analysis of Sequence/ Structure Relationships in Protein F a m ilie s ... 69
3.1.5 Aims of the C h a p t e r ... 71
3.2 M e th o d s ... 72
3.2.1 Selecting Datasets ... 72
3.2.2 Structural Change versus Sequence C h an g e... 72
3.2.3 Measuring Indels Between Protein P a i r s ... 72
3.2.4 Secondary S t r u c t u r e ... 73
3.2.4.1 Identifying Superfamilies with Domain Embellishments . . 73
3.2.5 Tertiary Structure ... 74
3.2.5.1 Identifying Structural Variability using S S A P ... 74
3.2.5.2 A CATH Resource: Structural S u b -g ro u p s... 74
3.3 Results and D isc u ssio n ... 76
3.3.1 Distribution of Sequence Identities between Homologues in the CATH Database ... 76
3.3.2 Identification of Structurally Conserved and Variable Superfamilies by Analysis of Pairwise Structural (SSAP) Similarity Scores...76
3.3.3 The Evolutionary Relationship Between Sequence and Structure . . 78
3.3.4 Correlation of Structural Variation W ith Functional Variation . . . 84
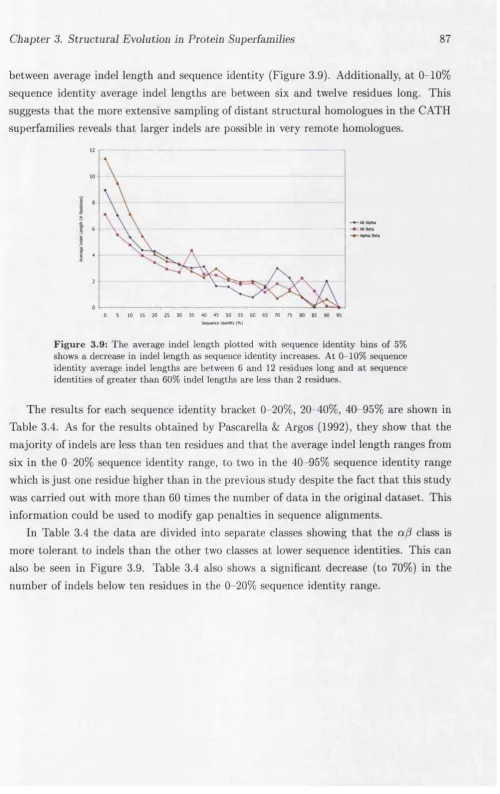
3.3.5 Extent of Insertions and Deletions Between Superfamily Members . 86 3.3.5.1 Average Indel L e n g th s ... 86
3.3.5.2 Secondary Structure Composition of In d e ls... 90
3.3.6 Secondary Structural Em bellishm ents... 92
3.3.6.1 Percentage Variability of Secondary Structures within a Superfam ily... 92
3.3.6.2 Selecting Variable and Conserved S u p e rfa m ilie s... 94
3.3.7 Particularly Conserved S u perfam ilies... 97
Contents 8
3.3.7.2 Conclusions About Conserved S u p erfam ilies... 100
3.3.8 Particularly Variable S u p erfam ilies...101
3.3.8.1 Characterisation of Embellishments in the Variable Super families ... 105
3.3.8.2 Alpha Beta 3-Layer {a^a) S a n d w ic h ... 113
3.3.8.3 General Conclusions on Secondary Structure Insertions . . 118
3.4 C o n c lu sio n s...119
4 S u p e rfa m ilie s w ith D o m a in E n la rg e m e n t 121 4.1 In tro d u c tio n ... 121
4.1.1 B a c k g ro u n d ...121
4.1.2 A im s ... 122
4.2 M e th o d s ... 122
4.2.1 Description of the Embellished D o m a in ... 123
4.2.1.1 The OC Clustering P ro g ram ... 123
4.2.2 The Biological Unit of Each Protein in the S u p erfam ily ...123
4.2.2.1 Description of the Domain P a rtn e rs ... 123
4.2.2.2 Functions of Relatives in the Superfam ilies... 124
4.2.3 Calculating the Proximity of Embellishments to O ther Domains or S u b u n its ... 124
4.3 C u p r e d o x in ...126
4.3.1 Overview ... 126
4.3.2 Structural D e s c rip tio n ...129
4.3.3 Structural Variation ... 129
4.3.4 Functional Descriptions...134
4.3.5 S tru c tu re /F u n c tio n ... 138
4.3.5.1 Group 1: The Multi Copper O xidoreductases... 140
4.3.5.2 Group 11: The Small Blue Electron Transfer Proteins . . . 140
4.3.5.3 Group 111: CuA B in u c le a r...140
4.3.5.4 Group IV: Non Cu B in d in g ...141
4.3.6 Embellishments in the Multi Copper O x id a s e s ... 141
4.3.7 Measuring the Embellishment Domain/ Subunit Interactions . . . . 145
4.3.7.1 Embellishments in the L o o p s ... 148
4.3.7.2 Cupredoxin Conclusion... 148
4.4 ATP-dependent carboxylate-amine/thiol lig a s e ... 149
4.4.1 In tro d u c tio n ...149
Contents
4.4.3 Structural Variation ...151
4.4.3.1 The Large ATP-grasp Domain ... 151
4.4.3.2 ATP-grasp Protein U n i t ...154
4.4.4 Functional D escriptions...154
4.4.4.1 The ATP Binding S i t e ... 155
4.4.4.2 The Substrate Binding S i t e ... 155
4.4.5 S tru c tu re /F u n c tio n ... 155
4.4.5.1 The Whole C h a in ... 155
4.4.5.2 Succinyl-CoA synthetase ( 2 s c u ) ... 158
4.4.6 The Role of the Embellishment in Subunit A g g reg atio n ...158
4.4.6.1 Conformational c h a n g e s ... 160
4.4.7 ATP-Grasp C o n c lu sio n s ...160
4.5 T h io re d o x in ... 161
4.5.1 In tro d u c tio n ...161
4.5.2 Structural D e s c rip tio n ...164
4.5.3 Structural Variation ... 164
4.5.4 Functional Descriptions...167
4.5.5 S tru c tu re /F u n c tio n ... 167
4.5.5.1 Group II: Peroxidase hORF6, Thioredoxin Peroxidase and Protein Disulphide Oxidoreductase. Proteins in which the edges of the ^-sheets of the two thioredoxin domains interact. 169 4.5.5.2 Group III: Glutathione Peroxidase. The hom otetram er . . 173
4.5.5.3 Group IV: Human Alpha Glutathione Transferase and Thiol-disulphide interchange protein (DbsA). Containing an a-helical dimérisation domain...174
4.5.5.4 Group V: Calsequestrin and Phosducin. Non-enzyme multi domain p r o te in s ... 176
4.5.6 Thioredoxin C onclusions...180
4.6 C o n c lu sio n s ...181
A u tom atic Com parative Modelling for Diverse CATH Superfam ilies 183 5.1 In tro d u c tio n ...183
5.1.1 B a c k g ro u n d ... 183
5.1.2 Comparative M odelling... 184
5.1.2.1 M O D E L L E R ... 184
5.1.2.2 Modelling of the L oops... 187
Contents 10
5.1.3 Measuring Model Accuracy ...188
5.1.3.1 Root Mean Square D e v ia tio n ... 189
5.1.3.2 L G S core...189
5.1.4 Predicting the Quality of a Comparative M o d e l ... 190
5.1.4.1 P r o s a l l ...190
5.1.5 Critical Assessment of Structure P rediction... 191
5.1.5.1 The Second Critical Assessment of Fully A utom ated Structure P re d ic tio n ... 192
5.1.6 Aims of the C h a p t e r ... 193
5.2 M e th o d s ... 194
5.2.1 CenMod: Modelling Pipeline ... 194
5.2.1.1 Identifying Structural Sub-Croups in CATH Superfami lies to Provide Reliable Structural Alignments of Parents and Build Hidden Markov Models (HMMs) for Homologue Recognition... 194
5.2.1.2 Using a Model Library of HMMs (SAMOSA) to Recognise Homologues for CATH Superfamilies and Provide Target - Parent Alignments...196
5.2.2 Alternative Methods for Selecting Parent S tru c tu re s ...198
5.2.2.1 Method 1: The Single Closest P a r e n t ...198
5.2.2.2 Method 2: Multiple P a r e n ts ... 198
5.2.2.3 Method 3: Single Chimeric P a r e n t ... 198
5.2.2.4 Method 4: Multiple Parents for Core Regions and Single Chimeric Parent for V a r i a b l e ... 199
5.2.3 Evaluation of Alignment Q u a l i t y ... 201
5.2.4 Evaluation of Model Q u a lity ...201
5.2.4.1 L C S co re...201
5.2.4.2 R M S D ...202
5.2.4.3 P r o s a l l ...202
5.2.5 Selection of the Test D a ta s e t... 202
5.3 R e s u lts ...204
5.3.1 Overview of R esu lts... 204
5.3.2 Selecting Target Sequences to Test the Modelling M e th o d s ... 204
5.3.3 Measuring the Chimeric Sequence I d e n t it y ... 204
Contents 11
5.3.5 The Effect of Alignment Quality on Model Q u a l i t y ...206
5.3.6 Modelling Sequences Which have Closely Related Target Structures 208 5.3.7 The Effectiveness of different Methods in Assessing Model Quality . 209 5.3.7.1 The Performance of Different Modelling Methods as As sessed by R M S D ... 209
5.3.7.2 Using L G S c o re ...212
5.3.7.3 Using P r o s a l l ...214
5.3.8 Assessment of the Four Individual Methods for M odelling... 220
5.3.8.1 Reviewing the Single Chimeric Parent M e th o d ...224
5.3.8.2 Reviewing the Use of the Single Closest Parent and Mul tiple Parent M eth o d s... 224
5.3.8.3 Assessing the Use of a Chimeric Parent in the Variable R e g io n s ... 226
5.4 C o n c lu sio n s... 228
5.4.1 Providing Models with Quality E v a lu a tio n ... 228
List o f Figures
1.1 A Venn diagram describing the chemical and physical properties of amino
acids... 29
1.2 Dynamic programming. The Needleman and Wunsch algorithm ... 32
1.3 The PASTA algorithm ... 34
1.4 Overview of the profile Hidden Markov M o d e l... 37
1.5 Overview of the SAM-T99 protocol for detecting remote homologues . . . . 38
1.6 Example of high structural conservation at low sequence id e n tity ... 39
1.7 Intra-molecular structural e n v iro n m e n t... 42
1.8 Flowchart describing the SSAP p r o t o c o l ... 43
1.9 The main architectures in CATH... 45
2.1 The CORA alg o rith m ... 55
2.2 The 2DSEC c a r t o o n ... 57
2.3 The 2DSEC algorithm ... 58
2.4 2DSEC diagram of the oligomerisation domain of the N A D ? binding oxi doreductase superfamily (3.30.360.10)... 59
2.5 The oligomerisation domain of glucose-6-phosphate dehydrogenase coloured to show the consensus SSEs... 60
2.6 The consensus secondary structures in the oligomerisation domain of the NADP oxidoreductase superfamily... 61
2.7 A 2DSEC example. The oligomerisation domain of the NADP binding oxidoreductase superfamily... 64
3.1 The number of non-identical domains in each architecture... 68
3.2 Calculating the length of insertions using IndelCalc... 73
3.3 Single and multiple linkage c lu ste rin g ... 75
3.4 Sequence identities between non-identical representatives in each homolo gous superfamily... 76
3.5 Average superfamily SSAP scores... 77
3.6 The relationship between change in sequence and stru ctu re... 79
List o f Figures 13
3.7 Structural variation in superfamilies for sequence identities above 35%. . . 82
3.8 Functionally annotated superfamilies and the correlation with change in sequence identity and structure... 85
3.9 Average indel length correlated with sequence i d e n t i t y . ... 87
3.10 Average indel length and percentage of indels less th an 10 residues...89
3.11 The secondary structure state of indel residues... 91
3.12 Percentage variability in number of secondary structure elements in mem bers of the same superfamily. ... 93
3.13 The number of S35Reps in the superfamily and percentage variability. . . . 94
3.14 The average number of secondary structures in each superfamily and per centage v a r ia b ility ... 94
3.15 Selection of the most embellished and the most conserved superfamilies in CATH... 96
3.16 The pleckstrin homology domain from dynamin (2dynA 0)... 98
3.17 C-Type mannose-binding protein (ImsbAO) ... 99
3.18 Rabbit muscle phosphorylase kinase ( Ip h k )...100
3.19 The number of embellished superfamilies for each architecture... 105
3.20 2DSEC diagram showing four areas of embellishment in the CATH super family 2.60.120.60...108
3.21 Three domains from the galectin-type carbohydrate recognition domain su p e rfa m ily ... 109
3.22 Typical domain orientation in members of the NADP oxidoreductase family. I l l 3.23 Two domains from the oligomerisation domain in the NADP oxidoreduc tase superfamily (3.30.360.10)...I l l 3.24 2DSEC diagram of the oligomerisation domain in the NADP oxidoreduc tase superfamily. ... 112
3.25 Three domains from the hydrolase superfamily (3.40.50.950)... 116
3.26 The 2DSEC diagram for selected members of the a p hydrolase superfamily. 117 4.1 A flow diagram showing the steps in the analysis of impacts of structural embellishments on protein functions in three protein superfamilies...125
4.2 The domain assembly in the cupredoxin superfamily. ... 126
4.3 Plastocyanin (Iplc). The representative structure for the cupredoxin su perfamily. ... 129
4.4 The relationship between change in sequence and structure for the cupre doxin superfam ily... 130
List o f Figures 14
4.6 Secondary structure embellishments in the cupredoxin superfamily. . . . . 133
4.7 The copper binding sites in the cupredoxin Superfamily. ...135
4.8 Cupredoxin multi copper oxidase domain arrangement and copper binding sites... 137
4.9 Domains of the cupredoxin superfamily clustered by SSAP score... 139
4.10 The arrangement of the domains and embellishments in the cupredoxin m ulti copper oxidases... 142
4.11 The biological unit of laccase (la65)... 143
4.12 Two of the six domains from ceruplasmin (Ikcw domains 1 and 2)...144
4.13 The biological unit of nitrite reductase (Inif)...144
4.14 The quaternary structure of L-ascorbate oxidase... 146
4.15 The interactions between residues in secondary structure embellishments and other domains and subunits in the cupredoxin multi copper oxidases. . 147
4.16 G lutathione synthetase and the CATH classification of the ATP-grasp large dom ain...151
4.17 Pairwise SSAP score plotted against sequence identity for the ATP-grasp s u p e rfa m ily ...152
4.18 A 2DSEC plot of the ATP-grasp large domain...152
4.19 The embellishments present in D-alanine-D-alanine ligase (liow02) and phosphoribosylaminoimidazole carboxylase (lb6rA 2)... 153
4.20 Domain and subunit interactions in members of the ATP-grasp superfamily. 154 4.21 Clustered SSAP scores for the three common domains of the ATP-grasp s u p e rfa m ily ...156
4.22 The orientation of the three domains of the ATP-grasp family... 157
4.23 The biological unit of biotin carboxylase (Ibnc)... 159
4.24 The biological unit of phosphoribosylaminoimidazole carboxylase (lb6r). . 159
4.25 C-terminal embellishment interactions in biotin carboxylase and phospho ribosylaminoimidazole carboxylase in oligomerisation... 160
4.26 The representative structure of the thioredoxin-like superfamily, thiore doxin (2trx)... 164
4.27 The relationship between change in sequence and structure in the thioredoxin-like su p erfam ily ...165
4.28 The embellishments present in the thioredoxin-like superfamily. ...165
4.29 2DSEC plot for the S35Reps of the thioredoxin-like fold superfamily. . . . 166
List o f Figures 15
4.32 The quaternary structure of peroxidase hORF6, thioredoxin peroxidase and
glutathione peroxidase...171
4.33 Thioredoxin peroxidase and gluathione peroxidase coloured according to core and structurally variable regions...172
4.34 Interactions between the embellished secondary structures and other do mains and subunits in glutathione peroxidase... 173
4.35 The domain interactions involved in human alpha glutathione transferase. . 174
4.36 The biological unit of glutathione synthetase...175
4.37 Domain orientations and positions of the embellishments in the thioredoxin superfamily... 176
4.38 The domain interactions involved in c a ls e q u e strin ...178
4.39 The biological unit of calsequestrin...179
5.1 An overview of the process of comparative m o d e llin g ... 185
5.2 Observed data approximated to a mathematically derived function. (MOD ELLER) ... 186
5.3 Root Mean Square Deviation ( R M S D ) ... 189
5.4 The RMSD of model and experimentally determined structure versus ex perimentally determined structure and closest parent in CASP4 192 5.5 The homologous superfamily, divided into sequence clusters at 35% se quence id e n tity . 195 5.6 Flowchart summarising the SAMOSA p ro to c o l... 197
5.7 An overview of Align Adjust... 199
5.8 An overview of the four modelling methods and how models are created by GenMod... 200
5.9 Selecting representatives from clusters at 60% sequence i d e n t i t y ...203
5.10 The difference between chimeric sequence identity and the sequence identity of closest parent... 205
5.11 RMSD of the experimental structures and the closest parents... 206
5.12 The relationship between percentage of correctly aligned residues with the RMSDs of the models and their experimentally determined structures. . . . 207
5.13 Sm ith-W aterm an alignment versus the SAM-T99 alignment for aligning protein sequences...208
5.14 Root Mean Square Deviation between model and experimental structure for chimeric sequence identities of 20-60%... 210
List o f Figures 16
5.16 LGScore Q-Value plotted versus chimeric sequence identity for model se
quence and parents...213
5.17 Correlation of protein size and Prosall Z-score carried out on a set of known structures... 214
5.18 Plotting Prosall with chimeric sequence iden tity ...216
5.19 The relationship between Prosall Z-Score and RMSD... 218
5.20 The relationship between LGScore Q-Value and Prosall Z-Score... 219
5.21 The number of times each of the four modelling methods produced the best model... 221
5.22 Root Mean Square Deviation between model and experimental structure for chimeric sequence identities of 20-60%... 222
5.23 RMSD between model and experimental structure for the model created by the most successful m ethod... 223
5.24 LGScore Q-Value versus the best parent sequence i d e n t i t y ...224
5.25 RMSD of the closest parent and experimental structure versus the model and experimental structure...225
List o f Tables
1.1 Summary of structure classification d a t a b a s e s ... 47
3.1 The sequence/ structure correlation... 80
3.2 The structural m utation sensitivity correlated with structural class... 83
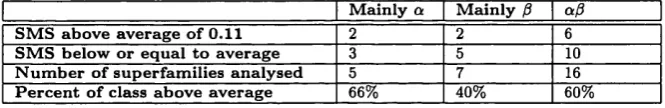
3.3 Results from Pascarella & Argos (19 9 2 )... 86
3.4 The average length of indels and percentage below 10 residues for CATH superfamilies ... 88
3.5 The sliding scale used to select the most embellished superfamilies... 95
3.6 Well populated superfamilies showing high conservation in secondary struc tures... 97
3.7 Superfamilies with extensive embellishments... 104
3.8 Description of secondary structure embellishments in the mainly P 2-layer sandwiches... 106
3.9 Description of secondary structure embellishments in the a/?2-layer sand wiches...110
3.10 Description of secondary structure embellishments in the 3-Layer {a/3a) sandw iches... 114
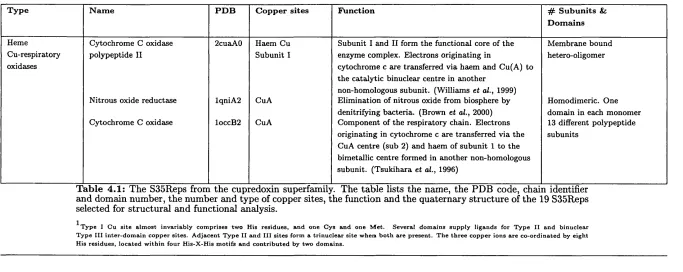
4.1 Functional information on the cupredoxin superfamily. ...128
4.2 Types of domain modification in the cupredoxin su p erfam ily ... 130
4.3 Functional information for the ATP-Grasp superfamily... 150
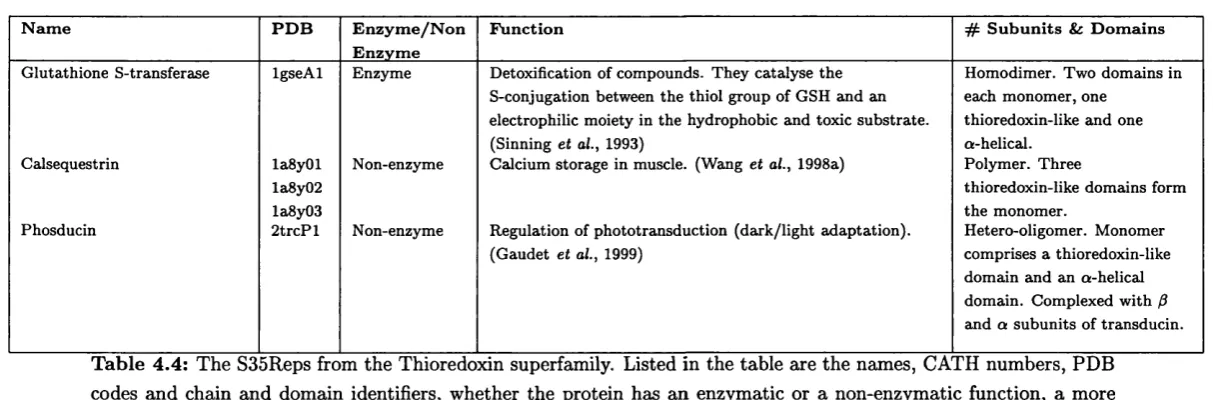
4.4 Functional information for the thioredoxin-like s u p e rfa m ily ... 163
18
List o f A b b reviation s
A b b rev iatio n D etails
2D Two-dimensional
3D Three-dimensional
 Angstrom
ATP Adenosine triphosphate
BLAST Basic Local Alignment Search Tool
BLOSUM Blocks Substitution Matrices
C-terminal Carboxy-terminal
GASP Critical Assessment of Methods of Protein Structure Prediction
CATH Class, Architecture, Topology, Homologous Superfamily
CORA Conserved Residue Attributes
DDP Double Dynamic Programming
DP Dynamic Programming
EC Enzyme Classification
EBI European Bioinformatics Institute
GO Gene Ontology
HMM Hidden Markov Model
HOMSTRAD Homologous Structure Alignment Database
HSP High Scoring Segment Pairs
N-terminal Amino-terminal
NAD Nicotinamide Adenine Dinucleotide
NCBI National Center for Biotechnology Information
NMR Nuclear Magnetic Resonance
NRDB Non-redundant Database
PAM Point Accepted Mutation
PDB Protein Data Bank
PSSM Position Specific Score Matrices
PSI-BLAST Position Specific Iterated-BLAST
RMSD Root Mean Squared Deviations
RNA Ribonucleic Acid
PDB Protein Databank
SAM Sequence Alignment and Modelling
SCOP Structural Classification Of Proteins
SSAP Sequential Structural Alignment Program
SSE Secondary Structure Element
STAMP Structural Alignment of Multiple Proteins
SSG Structural Sub-Group
TIM Triosephosphate Isomerase
VAST Vector Alignment Search Tool
19
List o f A m ino A cid A bbreviations
A Ala Alanine
C
Cys CysteineD Asp Aspartate
E Glu Glutamate
F Phe Phenylalanine
G Gly Glycine
H His Histidine
I He Isoleucine
K Lys Lysine
L Leu Leucine
M Met Methionine
N Asn Asparagine
P Pro Proline
Q Gin Glutamine
R Arg Arginine
S Ser Serine
T Thr Threonine
V Val Valine
w
Trp TryptophanC hapter 1
In trod u ction
1.1
T he Hierarchy o f Protein Structure
In 1958 the first protein structure, myoglobin, was solved by X-ray crystallography by
Kendrew et al. (1958). This provided the surprising result of a more complex, asymmetric
structural arrangement than the simple and regular structure of the DNA double helix
elucidated five years previously. Over forty years later, with many structures now solved
and functionally characterised, it is possible to see th at the structural irregularity is required in order th at proteins can fulfil their diverse functional roles as they are integral
to every biochemical process in life. They can serve as modules for building up large
assemblies such as virus particles or muscle fibres, function as ion channels in the cell walls,
as electron carriers in the respiratory chain or provide specific enzymatic activities within
the cell dominating the biochemistry of our cells. They have evolved through selective pressure to perform specific functions and this function depends on their three-dimensional
structure. In solution proteins often form globular structures. Protein structure can be
explained by an underlying hierarchy th at ranges from primary to quaternary structure.
1.1.1
P rim ary Structure
The prim ary structure describes the sequence of amino acids along the polypeptide chain.
Amino acids have a central carbon atom (Ca) which is connected to a hydrogen atom, a
carboxyl group (COOH) and an amino group (NH2). The fourth valence is occupied by
one of 20 ‘sidechains’, varying in chemical properties. These properties can be grouped into three main classes (Branden, 1999): amino acids with strictly hydrophobic sidechains
(Ala, Val, Leu, He, Pro, Phe and Met), those with charged sidechains (Asp, Glu, Arg and
Lys), and the amino acids with polar sidechains (Ser, Thr, Cys, Asn, Gin, His, Tyr and Trp). Gly is an exception in th at it contains only a hydrogen atom as its sidechain,
Chapter 1. Introduction 21
and as such is either placed in its own class or considered as a hydrophobic amino acid.
These twenty amino acids form the primary structure of a protein th a t in turn encodes
its uniquely folded three-dimensional structure (Anfinsen, 1973), thus bestowing the huge
variety of protein structures and functions in nature. The polypeptide chain is created by
a condensation reaction between the carboxyl and amino groups forming a peptide bond.
1.1.2
Secondary Structure
The force th a t drives the folding of water-soluble globular proteins is the packing of
hydrophobic sidechains into the interior of the molecule creating a hydrophobic core and
a hydrophilic surface. However, the burial of hydrophobic sidechains is also accompanied
by the burial of their main chain atoms which include polar N-H and C = 0 groups. These
polar groups are neutralised by the formation of hydrogen bonds between them. This gives rise to regular patterns of hydrogen bonding or secondary structure elements. The
route taken by the polypeptide chain in three-dimensional space to create the secondary
structure can be described by the relative positions of three atoms linked within the
backbone: the C-a (Ca), carbonyl carbon (O’) and amide nitrogen (N) atoms. The
relative positions or angles of rotation between these atoms are described as the (j) angle
(around the N-C-a bond), and the ÿ angle (around the C-û;-C’ bond). Secondary structure
is defined as two main types, the a-helix and the /3-sheet but there are also a number of
less stable secondary structures found in protein structure.
CK-helix Here the 0 = 0 group (residue i) and the N-H group (residue i+4) hydrogen
bond to form a cylindrical structure of the peptide chain, with approximately 3.6 residues
per turn, corresponding to a distance of 5.4Â. The helix forms a right handed turn, with
“0 and 4> angles of -60° and -50° respectively.
/3-sheet This secondary structure type is made up of two or more continuous regions
of chain called ^d-strands, which are found in a fully extended conformation. /3-strands line
up in such a way as to allow hydrogen bond formation between adjacent 0 = 0 and N-H
groups. /3-sheets are built up of ^-strands arranged parallel, anti-parallel, or a mixture
of both. Parallel ^-sheets have average 0, angles of -119° and 113° respectively and
anti-parallel ^-strands, an average of between -139° and 135°.
3io h e lix These helices are always short and frequently occur at the termini of regular
CK-helices. The name 3io describes the three residues along the chain th a t form a pairwise
Chapter 1. Introduction 22
by each hydrogen bond. The dipoles of the 3io-helix are not so well aligned as in the
a-helix, i.e. it is a less stable structure and sidechain packing is less favourable.
TT-helix The vr-helix is an extremely rare secondary structural element sometimes
found on the ends of a-helices. Hydrogen bonds occur between C=O i and N-H^+s. The ÿ
and ijj angles of the pure tt helix (-57.1, -69.7) lie at the very edge of an allowed minimum
energy before unfavourable steric clashes occur.
yd-turn The /3-turn describes a turn of the peptide chain upon itself which is sta
bilised by hydrogen bonding. Usually, this region contains glycine, providing almost no
steric hindrance, and proline in which the sidechain hydrogen bonds to its main chain N
atom, forcing the bend in the chain.
1.1.3
S up er-secondary Structure
Adjacent secondary structures can in turn assemble to form super-secondary structures
or ‘motifs’. Some of these motifs can be associated with a specific function and others
form the building blocks of larger structural and functional assemblies.
/3 -h airp in s yd-hairpins are the simplest motif involving /3-strands and consisting of
two adjacent anti-parallel strands joined by a loop. This motif occurs very frequently either as an isolated ribbon or present as part of a more complex y^-sheet. /3-hairpin loops
adopt specific conformations which depend on their lengths and sequences. Sibanda &
Thornton (1985) have shown th at 70% of /3-hairpins are less than 7 residues in length
with the two-residue turns forming the most noticeable component. Several consecutive
anti-parallel y^-strands form a super-secondary structure known as the /3-meander.
H e lix - tu r n - h e lix This is a functional motif also known as the EF hand. It was
discovered th a t in parvalbumin two of the three helix-turn-helix motifs present in the
structure are involved in binding calcium using the carboxyl sidechains and main chain
carbonyl groups.
H e lix -lo o p -h e lix m o tifs This motif was first observed in prokaryotic DNA binding
proteins such as the cro repressor from phage lambda. This protein forms a dimer and
each subunit consists of an anti-parallel three stranded /3-sheet with three helical segments inserted sequentially between the first and second /3-strands. The dimer forms so th a t the
Chapter 1. Introduction 23
to fit into adjacent m ajor groves in the DNA. Many other helix-turn-helix proteins with
different folds exhibit essentially the same mode of binding to DNA.
j3-a-l3 m o tifs Parallel ^-strands are connected by longer regions of chain which
cross the jS-sheet and frequently contain o-helical segments. This motif is called the (3-
a-P m otif and is found in most proteins th at have a parallel ^-sheet. The helix axis is
roughly parallel with the ^0-strands and all three elements of secondary structure interact
forming a hydrophobic core. In certain proteins the loop linking the carboxy terminal
end of the first /3-strand to the amino terminal end of the a-helix is involved in binding
of ligands or substrates.
1.1.4
Tertiary Structure
The packing together of secondary structure elements or larger super-secondary motifs results in the tertiary structure of a protein which contains an individual hydrophobic core
th a t is made up of secondary structure elements. This is known as a domain. Protein
domains are often described as the fundamental units of protein structure, forming high-
order building blocks of the protein polypeptide chain. The domain can be described as a
semi-independent folding unit (Richardson, 1981), with a well packed hydrophobic core. Residue contacts between domains are less than those within domains and secondary
structures are rarely shared between domains (Taylor, 1999). Secondary structure ele
ments are connected by exposed loop regions th at are usually much less conserved, unless
involved in the function of the protein. Domains can be placed into different classes ac cording to their secondary structure content. Four main classes were originally described
by Levitt & Chothia (1976). All-a domains comprise mostly a-helices and are often small
folds in which the a-helices are usually arranged in bundles packing against one another
to form a globular core. All-^ domains, comprise almost entirely of /3-sheets normally
in an anti-parallel arrangement within the domain core. /3-sheets can pack against one
another, with the hydrophobic sidechains located at the interface, forming ^-sandwiches.
a/3 domains are built up of a repeating ^ -a -^ motifs th at results in the outer layer of the
structure being composed of amphipathic a-helices, th at pack around the central core of
/3-sheets, a - f ^ domains, like a/3 domains, contain a-helices and /3-sheets, however the
arrangement of these elements is mixed. The classification of these domains can be com
plicated by the fact th a t there are overlaps between this class and the class and so
Chapter 1. Introduction 24
1.1.5
Q uaternary Structure
Many proteins have a quaternary structure th at is based on the association and interaction
of two or more polypeptide chains that form an oligomeric complex. The formation of
multi subunit complexes for the activity of the protein provides evolutionary advantages
as the interactions of the chains can be more transient or reversible than the interactions
between domains. This provides mechanisms such as allosteric control, higher active site
concentrations, new active sites at subunit interfaces, and an economic way to produce
protein interaction networks and molecular machines (Liu & Eisenberg, 2002).
1.2
P rotein D om ains
Domains are considered to be evolutionary units and sequence-based analyses have demon
strated th a t some domains have ancient origins because they are widespread in all three
forms of cellular life, archaea, bacteria and eukarya whose common ancestor is thought to have existed over three billion years ago. This suggests th a t these domains are either
susceptible to adaptation enabling them to fill many functional niches or th a t they fulfil es
sential functional processes. Many enzymatic domains of central metabolism (l3/a)s TIM
barrels, fiavoproteins and Rossman-like fold proteins appear to owe their heritage to an
cestors th a t precede the last common ancestor of archaea, bacteria and eukarya (Doolittle & Brown, 1994). Very little is known about what the precursors to these structural units
might have been. Lupas et a l (2001) examined the evolution of protein folds by locating
structure/sequence similar motifs within proteins with different folds suggesting th a t the
I diversity of domain folds in existence today might have evolved from the conglomerates of
I peptide segments th a t are seen today as internal repeats and structure-integrated motifs.
1.3
C onvergent and D ivergent E volution
!
I
; It appears th a t during evolution many domains have diverged from a common ances-
I tor to such an extent th a t they now show little sequence similarity and their structural
similarity may be limited to the core structure only. By contrast, there are many cases ; of convergent evolution, where common structures have reinvented themselves. One of
i the most interesting examples of convergence is thermolysin and mitochondrial process-
: ing peptidase (Makarova & Grishin, 1999). These proteins show striking similarities in
I their active site residues and also in the arrangement and packing of the core secondary
I structure elements and therefore have the same architecture. However, the connectivity
Chapter 1. Introduction 25
from a common ancestor unlikely. By contrast, structures such as the a^-TIM -barrels
which have the same connectivity between their secondary structures often share little
or no significant sequence similarity. These structures were previously thought to be ex
amples of convergent evolution but are now increasingly being revealed as homologues
(Copley & Bork, 2000).
It is difficult to distinguish between those structures which have converged and those
which have diverged. Domains with a similar structure, sequence and function are clear
homologues, however in the case of proteins with a similar structure but very little se
quence and functional similarity it not so easy to give a definitive answer.
In many cases, proteins have diverged beyond significant sequence similarity but retain
close structural similarity. The most widely known family exhibiting high structural sim
ilarity with negligible sequence similarity are the globins (Aronson et a i, 1994). Cases of
distantly related enzymes with very different functions are gradually being found. Murzin
(1998) describes two enzymatic examples with very probable distant relationships includ
ing caseinolytic ClpP protease, an ATP-dependent protease responsible for protein degra
dation in E. coli which shares the barrel-shaped architecture of other ATP-dependent
proteases. W ithin the active site, it shares the catalytic triad of chymotrypsin and three
other structural superfamilies of serine proteases. However, the folding subunit shows no
relationship with any protease of known structure. Instead it has a clear structural and
very probable relationship with members of the crotonase family responsible for fatty acid
metabolism: enoyl-CoA hydratase and 4-chlorobenzoyl-CoA dehalogenase.
Those proteins th a t recur in nature but have neither sequence nor functional similarity
I have been termed superfolds. Superfolds offer an interesting perspective on evolution as
I they appear to represent folds th at have been reinvented many times, as such it is thought
I th a t such folds may offer favourable properties for folding stability (Orengo et al., 1994).
i
1.3.1
D om ain E volution
I Basic mechanisms of protein evolution include residue substitutions, deletions and inser
tions. Grishin (2001) has identified structural mechanisms which can change the fold of
a protein. He described a number of mechanisms whereby homologous structures have
been modified through evolution so th at the fold has changed. Examples of the addi
tion/subtraction or substitution of secondary structures have been revealed. The most
dram atic of these is the evolutionary event which transformed bacterial luciferase, a com
plete (o:^)8-barrel into non fiourescent flavoprotein (NFP). N FP is a homologous relative I with 30% sequence identity to bacterial luciferase, as identified by PSI-BLAST. NFP
Chapter 1. Introduction 26
remaining parts of the barrel are connected with a single antiparallel ^-strand. Grishin
describes how it is possible for a shorter deletion in an a-helix to force an extension of
the peptide to form a ^-strand. The addition of extra ^0-strands is also considered, whilst
extra /5-strands inserted at the edge of a sheet would have little effect on the topology of
a structural family, the addition of a /5-strand into a ^-barrel may warrant placement of
structures into different fold groups. Grishin (2001) cites an example in which a /5-hairpin
addition into the 8 stranded ^-barrel of retinoic acid binding protein results in the forma
tion of 10 stranded /5-barrel of retinol binding protein. Structural similarity between these
proteins is pronounced, including conserved length and tilt of the /5-strands. Function is
also similar with both binding lipids inside the barrel.
; Another example illustrates the invasion of a ^-strand and an CK-helix. The two folds
I of the K homology (KH) domain, a widespread RNA-binding motif with similarity to a
I number of other RNA binding proteins and a particularly strong similarity with ribosomal protein S3, part of the ribosome which translates mRNA. These two structures differ in
the placement of an CK/5-unit insertion changing the topology but nevertheless leaving the structures to converge on the same architecture. The two distinct topologies may have
arisen from an ancestral KH-motif protein by N- and C-terminal extensions or one of
the existing topologies may have evolved from the other by extension, displacement and
deletion.
Grishin also describes the mechanism of /5-hairpin flip/swap. The lipocalins are used again as an example, this time the similarity between retinol-binding protein and triabin,
the throm bin inhibitor, is described. Triabin shares significant sequence similarity with
retinol-binding protein and is structurally very similar. However, the N-terminal regions
of the structures are topologically distinct due to a flip of a /5-hairpin through 180° an as
a result triabin and retinol binding protein are sometimes classified as different folds.
1.4
D om ains and Function
1.4.1 Functional Classification Schem es
Genome sequencing projects have driven the development of functional classification
schemes. Functional classification of proteins is essential for database annotations allow
ing the functional comparison of different proteins and organisms. However, functional
classification is not trivial. Firstly, it is difficult to describe proteins as having a particular function on the basis of their domain composition. Domains can exhibit one function,
such as ATP binding whereas the function of the whole protein may be controlled by a
Chapter 1. Introduction 27
regulation’ or at the molecular level, for example, ‘ion channel’. Two of the most widely
used classification schemes are the Enzyme Commission (EC; NC-IUBMB, 1992) and the
Gene Ontology or (GO) (Ashburner et a i, 2000) classification schemes.
1.4.1.1 Enzym e Com m ission Num bers
The hierarchical Enzyme Commission scheme categorises enzyme reactions. It is the best
developed and the most widely used scheme, however, it is limited to enzymes and their
biochemical functions. A reaction is assigned a four-digit EC number where the first digit
describes the class of reaction the enzyme catalyses, (1, oxidoreductases; 2, transferases;
3, hydrolases; 4, lyases; 5, isomerases; 6, ligases). Further levels in the hierarchy depend
upon the primary EC number. For example, for oxidoreductase reactions, the second level
describes the substrate upon which the enzyme acts, but for the isomerases, it describes
the type of reorganisation in isomerase reactions. Enzymes with more than one reaction
can have more than one EC number assigned to them.
1.4.1.2 Gene Ontology
This classification scheme separates gene function into three independent ontologies: bi ological process, molecular function and cellular component. One particular protein may
be described by many different categories within the classification scheme. For example, a
particular protein may function in several different biological processes, contain domains
with diverse molecular functions and participate in multiple interactions. Each ontology
is therefore a network of nodes, able to handle data at different stages of completeness.
1.4.2
M eth ods for P red ictin g Function from Structure
W ith the explosion of sequence and structural data now available there is a need to define
or predict functional mechanisms from a knowledge of the protein structure. In partic
ular, a complete understanding of the complex relationships between protein sequence,
structure and function is critical. Genome sequencing projects have driven the develop ment of functional classification schemes. Among these is the Fuzzy Functional Form
(FEE) (Di Gennaro et a l, 2001) which is derived by the superposition of functionally
significant residues in a few selected protein structures th a t have related functions. A
descriptor of the active site is formed from the distance and angles between the Cq atoms
and the sidechain centres of mass. This, in turn, is used to screen the structure for the
presence of this functional site in other experimentally determined structures in the Pro
tein D ata Bank (PDB;(Bernstein et ai, 1977). TE m plate Search Superposition, (Wallace
Chapter 1. Introduction 28
a tem plate from the constellation of atoms im portant for the function of the protein.
This constellation is then used to search for other PDBs with similar constellations. The
S P atial Arrangements of Sidechains and M ainchain (Jones et al., 1991) program works
in a similar way to TESS but identifies residues instead of atoms.
1.5
Pairw ise Sequence Alignm ent
Aligning the sequences of proteins of known and unknown structures is integral to the
process of inferring structural homology. Generally, as sequence identity decreases, the
quality of the alignment also decreases (Martin et al, 1997). In order to align protein
sequences, it is necessary to have a method for scoring the similarity of the residues in
protein sequences. Secondly, an optimisation method is needed for determining the best
alignment of one sequence against the other. One method of scoring an alignment is by counting the number of identical residues. However, a more sensitive method is to account
I for the similarities between amino acids when comparing sequences.
i
i
I 1.5.1
S u b stitu tio n M atrices
I Substitution matrices are 20 by 20 matrices which score the similarity of pairs of amino
I acid residues. Scores can reflect similarity in the physiochemical properties, such as similar
I size or charge. Alternatively scores can reflect the frequency with which residues are found
I to exchange for one another in protein families.
I 1.5.1.1 A m ino Acid P ropensities
The 20 amino acid sidechains have distinct chemical and physical properties (Figure 1.1).
This difference in amino acid physiochemical properties means th a t the substitution of
like amino acids is more favourable than an unlike pair. For instance, the substitution of
a negatively charged glutamic acid residue to a positively charged lysine residue is much
' less likely than to the similarly charged aspartic acid.
1.5.1.2 Observed M utations
When comparing two proteins, residue substitution probabilities can be used as a more
; sensitive assessment of similarity than simply using amino acid identities. The likelihood
of a given residue substitution can be quantified in a mutation d ata m atrix (MDM). The
Chapter 1. Introduction 29
Small
Proline Tiny
Aliphatic s-s
S-H
" r Charged
' Negative
Polar
Aromatic
Positive
Hydrophobic
F ig u r e 1.1: A Venn diagram describing the chemical and physical properties of
am ino acids (Taylor, 1986a). The residues are alanine (A), cysteine (C), asp artic acid (D), glutam ic acid (E), phenylalanine (F), glycine (G), histidine (H), isoleucine (I), lysine (K), leucine (L), m ethionine (M), asparagine (N), proline (P ), glutam ine (Q), arginine (R ), serine (S), threonine (T ), valine (V), try p to p h a n (W ) and tyrosine (Y).
any of the others. These probabilities are derived by examining closely related sequences and counting the occurrence of each amino acid at each position.
1.5.1.3 D ay h o ff or P o in t A ccep ted M u ta tio n (P A M )
The PAM (Point Accepted Mutation) matrices (Dayhoff, 1978) are derived by analysis of residues exchanging in close relatives. It is based on the concept of the PAM which
describes the probability of each residue substitution occurring in an evolutionary period of 1 residue mutation every 100 residues. However considering substitution values, based on sequences where only 1 in 100 residues has mutated, will not provide much useful
information on distant evolutionary relationships since the sequences would be almost identical. The PAM250 matrix gives similarity scores equivalent to 20% matches remain ing between two sequences (the twilight zone) and is obtained by repeatedly multiplying
Chapter 1. Introduction 30
sequences at about 85% sequence identity.
1.5.1.4 BLOcks su b s titu tio n M atrix (BLOSUM)
Henikoff & Henikoff (1992) derived a substitution m atrix from blocks of aligned sequences
from the BLOCKS database. Sequences in the multiple alignment were clustered by
sequence identity and the average contribution at each residue position is calculated.
To represent the relationship between sequences at different sequence identities the se
quences are clustered at different clustering percentages. Thus, sequences clustered at
80% sequence identity are used to generate the BLOSUM 80 m atrix (BLOcks S u b stitu
tion M atrix). The BLOSUM 62 m atrix best represents the relationship at 20% sequence
identity as the m utation rates in clusters at 62% provide the most satisfactory balance
between information and amount of data. Clustering at lower sequence identities would
cause the m utation rates to be averaged out within the clusters and the m atrix would
become less sensitive.
1.5.2
Insertions and D eletions
Evolutionary relationships can be identified most simply by aligning sequences in a pair
wise manner then scoring the resulting alignments. As proteins become more distant, alignment programs must allow for insertions and deletions (indels) in addition to single
site m utations (substitutions). In order to allow for these indels, gaps are introduced into
the alignment. The positioning of these gaps is complex to compute accurately. Simply
maximising the number of identical residue matches and providing no restrictions on the
number and size of the gaps would achieve an optimum score but the alignment may
be biologically meaningless. Instead, scoring penalties are introduced which minimise the
number of gaps th a t appear. Affine gap penalties can also be applied. Rather than a fixed
I gap penalty, affine gap penalties encourage the extension of existing gaps rather than the I opening of new gaps. This is achieved by applying a larger penalty for opening a gap in
I the alignment and a lower penalty for a gap extension.
I
I 1.5.2.1 Local and Global Similarity
I
There are two general models for alignments: the global alignment which attem pts to align
two proteins along their entire lengths and the local alignment, which considers regions of similarity between specific parts of sequences. Local alignment algorithms allow the
identification of localised regions of similarity which often convey functional information
Chapter 1. Introduction 31
An example of an algorithm which is good at accommodating indels is the dynamic
programming algorithm. This is a general m athem atical procedure th a t provides an op
tim al alignment between two sets of data. This algorithm was first applied to sequence comparison by Needleman & Wunsch (1970). A 2D m atrix is constructed from the se
quences and the m atrix is populated using a simple scoring scheme. In the example
outlined in Figure 1.2, identical residues in the m atrix score 5 and mismatches score 0.
Working from bottom right of the m atrix, to the top left, paths are drawn through the
m atrix summing the individual scores as shown in Figure 1.2. The scores are summed by
using Equation 1.1 where the scoring function is added to the maximum score from
the previous row or column in the 2D matrix.
-f- m ax <
+ 1,7 + 1)
S (i -|-1,7 4" 2..J) -f- G ( I 'l)
S (i 2..7, 7 4" 1) 4"
The score cell S(iJ) is added to the maximum score from the row and column below
and to the right. If the value diagonally below S(i4-1 ,74-1) is selected the value is added to the accumulating score. However, a higher value may be found in the row S(z-|-2...I,
7-1-1) where I is the length of the row sequence, or the column S(z4-1, 7 + 2 ... J) where J is
the length of the column sequence. Selecting from these values incurs a gap penalty (G) (shown on the example as a value of -2). A value in the row or column not diagonally
below is only selected if it is still higher than the value in S(z+1, 7+ I ) with the gap
penalty. The alignment is generated by tracing back through the m atrix, starting at the
Chapter 1. Introduction 32
I
CO L
I S
i:
i+2
j+3
Sequence A S L V I L R
Co m p ariso n scores b a s e d on the residue identities:
I d e n t i c a l r e s i d u e s + 5
starting in the bottom right com er, fill the colum n (le ft) an d row (a b o ve ) with th e
com parison scores.
ACCUMULATION
' l 3 3 5 8 0
3 8 3 5 0
0 0 0 0 S
Each cell (I, j) is sco re d using the function S(i, j).
S ( i , j) = S(i, j) + m a x
S ( i + 1 , j + 1) S ( i + 1 , j +2 . . J) + G S ( i + 2. . 1 , j + 1) + G
1 11 6 6 15 3 0
L 11 6 8 6 8 0
S \ 6 6 8 3 0
L 6 3 5 8 0
V 3 3 _ 3 5 0
R 0 0 0
1 ” o ]I ®
G a p p e n a l t y ( G ) -2 L e n g t h of S e q u e n c e A i L e n g t h o f S e q u e n c e B J
Starting with the h ig h est scoring cell, trace a path b ack th rough the m atrix by selecting the highest score from th e n e x t row or column:
S e q u e n c e A - - S L V I L R
S e q u e n c e B I L S L V - - R
F ig u r e 1.2: T h e Needlem an and Wunsch dynamic program m ing algorithm . T he sequences form a 2D m atrix which is scored. Exact residue m atches score 5 and m ism atches score 0. S tartin g from the bottom right corner of th e m a trix th e scores are sum m ed. T he m axim um score from the previous row or colum n s ta rtin g from th e cell (* 4- 1, i + 1) can be inherited and added to th e com parison score of th e
cell. A penalty is incurred from inheriting the score from any cell o th er th a n {i +
1, j + 1) as this corresponds to a gap in the alignment.
A modification of this algorithm was introduced by Smith & Waterman (1981) which focused on providing local, rather than global, alignments. This algorithm introduces
Chapter 1. Introduction 33
1.5.3
D atabase Searching: FASTA and B L A ST
Searching a database with a sequence can be conceived as an extension of the pairwise
sequence alignment. Using a conventional dynamic programming m ethod is time consum
ing and computationally expensive and so a great deal of effort has been put into making
these searches as efficient as possible as the databases grow. The FASTA (Pearson &
Lipman, 1988) and BLAST (Basic Local Alignment Search Tool, Altschul et al (1990))
algorithms are both essentially local similarity searches which concentrate on finding short
identical matches which may contribute to a total match.
FASTA
The FASTA algorithm searches for segments of one and two identical residues in pairs
of sequences in the database. These possible matches are stored in a hash table along
with all matched segments in the database (Figure 1.3). This data source is then used
to screen database queries for likely matches. These possible matches are entered into a
2D m atrix and the more rigorous dynamic programming algorithm strings the segments together for a global alignment. An E-Value, the expected number of times the observed
value will occur by chance is calculated from the P-Value, which allows the user to assess
the likelihood of the match being true. The P-Value is calculated from the raw score
by summing m atrix similarities of aligned residues and deducting gap penalties over the
length. The P-Value {p) measures the probability of the query sequence matching a
particular database sequence with a score of at least S; the corresponding E-Value (E) is
the expected number of times th a t happened in a database of size N (Equation 1.2).
Chapter 1. Introduction 34
A lig n m e n t Pos 0 1 2 3 4 5
Database A T C G A R
Query T C R A L I
Hash Table
D atabase Query
Amino acids Position(s) in Amino acids Position(s) in in sequence sequence in sequence sequence
A 0 , 4 T 0, 5
T 1 C .1
C 2 R 2
G 3 A 3
R 5 I L 4
I
A -3, 1 T 1 ,- 4 C 1 G R
I
Database A T C G A R
-Query - T C R A L T
F ig u r e 1.3: T he FASTA algorithm builds a hash table of n identical le tte rs, shown