The design and operation of
hydrocoolers
A Smart Water Funded Project
Graham Thorpe
Institute of Sustainability and Innovation
School of Architectural, Civil and Mechanical Engineering
PO Box 14428, Victoria University
Melbourne 8001
CONTENTS
Contents i
Summary iii
1. Introduction 1
1.1 Scope of the horticultural industry 1 1.2 Benefits of cooling horticultural produce 1 2. The need to cool with potable water 2 2.1 The need to disinfect recirculated water 2 2.2 The regulatory framework 3
2.3 Monitoring the potability of water 3 2.3.1 National Guidelines for Water Recycling (NGWR) 6
2.4 Conflicting regulations 7
2.5 Enforcement 7
3. The Smart Water hydrocooler 7
3.1 General specifications 7
3.2 The realisation of a practical hydrocooler 8 3.3 Chilled water supply, storage and removal system 9
3.4 Distribution of chilled water used to irrigate the produce 9 3.5 Chemical treatment system 9
3.6 Filtration system 19
3.7 Backwash circuit 19
3.8 Mixing circuits 19
3.9 Mains supply of water 20
3.10 Components of the hydrocooler 20
4. The water quality control system 20
5. Results 28
5.1 The cooling capacity of the water chilling unit 28
5.2 Flow rate through the chiller 30
5.3 Cooling rate of broccoli 31
5.4 Efficacy of the disinfectant bromo-chloro- Dimethylhydantoin 36
5.5 Water and electricity consumption 37
5.6 By-products of BCDMH 38
5.6.1 The estimated rate of accumulation of DMH in the Smart Water hydrocooler 38
6. Modifications to the hydrocooler 40
6.1 Some lessons learned 41
6.1.1 Need to simplify the design 41
6.1.2 Materials of construction 41
6.1.3 Improved inter-connectivity between the water tanks 43
7. The production of intellectual capital 43
8. Next steps 44
9. Conclusions 45
10. Acknowledgements 46
11. References 46
Appendix I Elements of the performance of an on-farm hydrocooler located at Goondiwindi that uses the same water chilling unit as the Smart Water hydrocooler 48
A1 Order of magnitude estimate of heat ingress into the system 48 A1.1 Water flow rate through the spray chamber 48
A1.2 Heat transfer to the water tank 48
A1.3 Heat transfer to the water lines 49
Appendix II Limitations of disinfectants 50
Appendix III Toxicological risks associated with disinfectants 52
A3.1 Background 52
A3.2 Toxicology of BCDMH and its residues and Maximum Recommended Limits 53
Appendix IV Concentration of DMH in hydrocoolers MATLAB® script 54
SUMMARY
Horticultural produce begins to deteriorate as soon as it is harvested. It begins to lose its flavour and texture, and it is susceptible to infection by pathogens. An effective method of slowing the loss in quality is to cool the produce as soon as possible after harvest. Many crops, such as pome fruits, asparagus, broccoli, peas and beans can be cooled within half an hour or so by drenching them with chilled water in a device known as a hydrocooler.
The project described in this report was initiated by Mr Nick Christou of Christou Logistical Services. He was using a water chilling unit to cool water which he sprayed onto vegetables after which the water was discharged. This procedure was a waste of water and energy. He required a hydrocooler capable of cooling up to 6 tonnes per hour of produce, and that is transportable from growing region to growing region, and which is water-efficient.
The Smart Water Fund grant enabled a hydrocooler that incorporated water recirculation to be developed and built jointly by Victoria University and Wobelea Pty Ltd. The strategy of recirculating water has reduced the water consumption from a required 60,000 litres per tonne of broccoli cooled to about 75 litres per tonne. When round fruit such as apples are cooled the water consumption is estimated to be about 35 litres per tonne.
Measurements show that broccoli cools by 80% of its possible cooling range, i.e. from 30ºC to 6ºC when sprayed with water at 0ºC, in about 35 minutes. The total electricity consumption is 20 kWh and 16 kWh when the throughputs are 4 tonnes per hour and 6 tonnes per hours respectively. If the water were not recirculated the electricity consumption would be about 300kWh per tonne.
The water used to cool vegetables that are then packed and consumed raw must be potable. It is therefore essential that owners and operators of hydrocoolers implement a quality control system that ensures the water remains potable. For this reason a system that automatically filters and doses the water with a disinfectant is included in the hydrocooler. This does not absolve operators of their responsibility to ensure that the water is potable, but it facilitates their choices.
Construction details of the hydrocooler are described and presented pictorially.
Successful outcomes of the project include:
The design and operation of a recirculating hydrocooling system. A demonstration that the new system cools horticultural produce to temperatures that will maintain the shelf life and quality of the produce.
A demonstration that the hydrocooler is capabale of eliminating contaminants from the recirculated water over brief periods of time. The identification of improvements that can be made to the design of the system.
Before the new hydrocooler can be used commercially it must be demonstrated that it can work successfully for prolonged periods of time. To this end a risk management framework must be developed that is based on the Australian Drinking Water Guidelines. The operation should also comply with good agricultural practice. The risk management framework must be validated by carrying out a series of measurements of the performance of the system over a period of at least four week’s continuous operation. These measurements will include the concentration of disinfectant at strategic locations within the hydrocooler, the concentration of disinfectant by-products in the recirculated water and on the surface of the cooled produce, and the presence of E. coli. The risk management plan would be modified as information on the performance of the system became available.
A spin-off from the research has been the enhancement of manufacturing capability in Victoria, and new insights and expertise in the area of hydrocooling have been developed.
The hydrocooler is now being successfully operated in Wesley Vale near Devonport Tasmania in conjunction with Riverside Australia, Werribee. The unit is cooling about 500 bins per week of broccoli, and each bin contains about 400 kg of produce. It is planned that the hydrocooler will cool 6000 bins of broccoli over the present three-month growing period. The effectiveness of the hydrocooler is such that it has sparked commercial interest by other growers.
1. INTRODUCTION
1.1 Scope of the horticultural industry
At first sight the nexus between the scarcity of water and the increasing production of horticultural production in Victoria seems paradoxical. As water is becoming scarcer the value of horticultural production is increasing. This is because the use of water is being transferred from activities that yield low financial returns to those that yield higher returns. In 2001 the farmgate value of fruit and vegetable production in Victoria was $1 billion, and processing resulted in a further $417 million of value adding (DPI, 2005). Food exports from Victoria grew three-fold between 1992 and 2002. The annual value of Australian produce is $4 billion. and the industry uses 2 GL of water per year on the total area planted of 2500 square kilometres (DAFF, 2007). The value of a range of commodities per ML of water used to produce them is shown in Table I. These data highlight the fact that horticultural produce produces much higher financial returns for every ML of water used than broad acre crops and pasture.
Table I. The value of production of a range of agricultural products as a function of the amount of water consumed (ABS, 2000)
Commodity Value ($) per ML
Fruit Vegetables Grapevine Cotton Pasture Rice 1460 1760 945 613 289 189
The data in Table II provide a signal portrayal of the areas devoted to horticultural produce in Australia.
Table II. The areas devoted to growing a range of annual horticultural produce in Australia
Commodity Size of area planted
Beans and peas Brassicas
Peppers
Potatoes
Sweet corn
Tomatoes
13km × 13km 12km × 12km 4km × 4km 21km × 21km 7.3km×7.3km 9km×9km
1.2 The benefits of cooling horticultural produce
The consumption of fresh fruits and vegetables is good for people’s health. As a result, health professionals and governments are exhorting the populace to consume more fresh produce. Nevertheless, the produce must be high quality. One way of ensuring quality is to cool the produce as soon as possible after harvest as this slows its respiration and preserves
desirable flavours and textures. It also slows the development of pathogens and prolongs shelf life. For example, one of the most rapid ways of cooling produce such as broccoli, asparagus and summer fruits such as peaches and cherries is to hydrocool them. This process consists of drenching the produce with chilled water to remove the ‘harvest heat’. The effects of cooling on the shelf life of broccoli can be summarised as follows:
Temperature (°C): 0 5 10 15 20
Shelf-life (days): 42 25 11 5 3
Shelf-life at 35 °C is less than 12 hours.
The highlighted figures indicate that if broccoli is cooled to 5°C, which is readily attainable in hydrocoolers, the shelf life is about 25 days which contrasts starkly with a shelf-life of only three days if it were not cooled. (Data estimated from data published by UC Davis, 2007)
2. THE NEED TO COOL WITH POTABLE WATER
The hydrocooler project was prompted by a grower who was cooling his produce with chilled water that was immediately disposed of. This resulted in a high usage of water and a waste of energy. These environmentally damaging impacts can be mitigated by recirculating the water within the hydrocooler. However, the recirculated water must be potable and owners and operators of hydrocoolers need to know what exactly constitutes potable water. They also need to know how they can ensure it is used in their hydrocooler. To help people who use hydrocoolers we shall briefly survey some of the regulations that define potability, and importantly indicate how the regulations might be satisfied in practice. However, it must be stated that the condition of the feed water, the produce treated and local conditions ultimately dictate the operation of hydrocoolers, and individual owners retain responsibility for their own operations.
2.1 The need to disinfect recirculated water
When freshly harvested produce is placed in a hydrocooler it is likely to be contaminated with soil, organic debris and a range of plant and animal pathogens. Root crops such as carrots and parsnips may be clarted with mud. Some of the pathogens may be on the surface of the produce, whilst others may be within the tissue. Hence when cooling-water has flowed through a bed of produce it is likely to become infected with pathogens that may cross-contaminate otherwise uninfected produce. The principal aim of disinfecting the cooling-water is to rapidly kill water-borne pathogens so that healthy produce is not contaminated. Disinfectants are introduced into the recirculated water continually because they are reduced by organic matter and they decay into compounds that are not biocidal.
The recycled water also has to be filtered to remove organic and other debris that may not only contaminate the produce but which is also likely to unnecessarily reduce the disinfectant. This would increase the rate of consumption of disinfectant.
2.2 The regulatory framework
It is mandated that fresh food be sold in a condition that is microbially safe and that it contains levels of chemical and physical contaminants that do not exceed prescribed limits. However, the regulatory framework does not
dictate how these mandates should be met, but it allows operators of
hydrocoolers considerable discretion. It is argued that this discretion results in risks for consumers of horticultural produce.
One of the requirements imposed by state and federal governments is that water used in food processing operations be potable unless it is used for non-processing activities such as washing floors or flushing toilets. The Australian Drinking Water Guidelines (ADWG, 2004) define quite precisely upper limits on the concentrations of contaminants such as pesticides, heavy metals and the radionuclides that give rise to radioactivity in water deemed to be potable. However, the regulatory framework does not prescribe how potability should be achieved and monitored. As a result, growers must exercise judgement and this requires expertise. This gives rise to considerable risk to consumers because potentially important risk factors may be inadvertently overlooked. Furthermore, the Australian Drinking Water Guidelines (ADWG, 2004) do not demand that water be completely free from E. coli, a species of bacteria associated with faecal contamination, but that a pre-determined proportion of water samples be free of the organism.
A further risk is associated with the fact that there is not a unified approach to Hazard Analysis and Critical Control Point (HACCP) techniques applied to the production of fresh produce (AFFA, 2001). As a result, there is confusion among growers who may possibly adopt unnecessarily expensive compliance methods, or they may simply not comply.
The Department of Agriculture, Food and Fisheries - Australia (2001) (AFFA) recognises the impracticality and expense of extensive monitoring of horticultural produce for contamination. It suggests, therefore, that growers adopt good agricultural practice to minimise the risk of their produce becoming contaminated.
The labyrinthine complexities of a multi-tiered federal governmental structure occasionally result in there being conflicts between food regulations promulgated by diverse Australian government agencies and jurisdictions.
2.3 Monitoring the potability of water
The Department of Agriculture, Fisheries and Forestry – Australia (AFFA, 2001) states that the water used for the final wash steps, as may occur during hydrocooling, must be potable. This is echoed by the Victorian Government Department of Human Services (2005) that points out that food laws require food processors to use potable water. A definition of potability is not given but it is clear that when owners of food businesses harvest water, as operators of hydrocoolers often do, they incur several risks. The Victorian Government Department of Human Services (2005) provides a list of possible contaminants of tank water that includes
contaminated airborne dusts, lead-based paints and roof flashing, tar-based coatings that may bind other harmful chemicals such as pesticides. The Victorian Department of Human Services (2005) also points out that smoky residues from wood-fired heaters can condense and leach from the surfaces of roofs into rainwater tanks, and that crop dusting can result in harmful chemicals landing on roofs.
Considerable knowledge and expertise are required to assess the risks associated with food safety. The Victorian Government Department of Human Services (2005) states that “Whatever the water source it is the responsibility of the food business to check what possible contaminants can get into the food supply.” In recognising the difficulty it goes on to state, “For a monitoring program to be effective, it needs to be designed by a specialist, using specialist equipment and sampling techniques. It is recommended that food businesses focus on risk management or Hazard Analysis and Critical Control Point (HACCP) activities on the premises.” It is recommended that owners and operators engage professional experts in the area of food safety when establishing a risk management system for their particular hydrocoolers. Owners and operators of hydrocoolers also need to implement training systems for their operatives.
Perhaps the most definitive set of rules for ensuring the potability of water in Australia is provided by the Australian Drinking Water Guidelines (ADWG, 2004). The Guidelines have been designed specifically for water distribution systems that vary in size from less than 1000 consumers to over 100,000 consumers. Managers of these networks are likely to have access to reasonably significant funding and expertise. These resources and expertise are unlikely to be available to individual operators of hydrocoolers and this represents a risk.
In this work it is suggested that the ADWG can be applied to hydrocooling by conceptualising a hydrocooler as a water distribution system as illustrated in Figure 2.1.
Figure 2.1. A schematic diagram of a hydrocooler that represents the components as elements of a water supply system
This is far from a perfect analogue but one can equate the various components of a hydrocooler as elements of a water supply as follows:
Supply of raw water - The supply of raw water to a hydrocooler may be likened to that of water obtained from a catchment or a river in a supply system to a small township. In the case of a hydrocooler the raw water supply may be potable water from the mains, bore water, river water and so on.
Reservoir - The storage tank in the hydrocooler represents the local reservoir in a small community water supply.
Chemical treatment plant – the filtration and chemical treatment system in a hydrocooler plays the role of a chemical treatment plant in a water supply system
Consumer - The produce being cooled represents the ‘consumer’ that must be supplied with potable water.
Recycling facility – The water recirculated within a hydrocooler may be likened to a water re-cycling facility that may not yet have many analogues in town water supplies, although they are likely to be introduced some time in the future.
The ADWG (2004) suggest that the philosophy of monitoring the potability of water supplies to small townships, and by extension to hydrocoolers, is driven by the idea that it is more effective to test frequently for a small number of narrowly defined indicators rather than a broad spectrum of contaminants that are unlikely to be problematical. The ADGW (2004) suggest that the following be monitored frequently:
• Indicator micro-organisms • Disinfectant residuals • pH
• Turbidity
The ADWG recommend that users develop their own cost-effective monitoring programs which, again because growers may lack the required expertise, may pose a risk to consumers. This is highlighted by the fact that, like the Victorian Government, the ADWG (2004) recommend an assessment of the water supply be carried out. This is particularly relevant to owners and operators of hydrocoolers who may be located on rural properties that are reasonably close to populated areas, but who do not have a reticulated water supply. They are likely to draw their water from bore holes and rivers and the ADWG (2004) suggest that they understand the characteristics of their water supply, including the following features:
• Existing and planned development
• Any potential continuous or seasonal patterns of pollution
• Chemicals used in or near the water supply, such as herbicides and pesticides.
As the ADWG (2004) point out, the need to understand the water supply system cannot be overemphasised, and and owners or operators of hydrocoolers may choose to engage food safety professionals when establishing a risk management strategy for a hydrocooling operation.
Goldsmith (Pers. Comm.) of the Victorian Department of Human Services has indicated that the ADWG provide a sound basis for determining the potability of water.
2.3.1 The National Guidelines for Water Recycling
The Australian Drinking Water Guidelines provide both practical and intellectual frameworks in which to establish criteria for the potability of water recirculated in a hydrocooler. More recently they have been complemented by the National Guidelines for Water Recycling (2006) which incorporate many of the ideas of the ADWG. The NGWR reflect the hazard analysis and critical control point (HACCP) approach used in the food industry, which is quite apposite to designing water recirculation systems in hydrocoolers. The NGWR are directed specifically at recycling sewage and grey water, however they are generic in nature and the authors suggest that they can be applied to water from most sources.
The NGWR consist of twelve interrelated elements that are grouped into four general areas. They may be articulated as:
Commitment
1. Commitment to the responsible use and management of recycled water
System analysis and management
2. Assessment of the recycled water system
3. Preventive measures for recycled water management 4. Operational procedures and process control
5. Verification of recycled water quality and environmental performance
6. Incident and emergency management Supporting requirements
7. Employee awareness and training 8. Community involvement
9. Research and development 10. Documentation and reporting Review
11. Evaluation and audit
12. Review and continual improvement
The application of the twelve elements is situation-specific. In the case of hydrocoolers it would include factors such as an evaluation of the quality of the water entering the hydrocooler, the end-use of the cooled horticultural produce, the use of the water discharged from the hydrocooler, the alerting of customers and other stakeholders in case the cooled produce were likely to have become dangerously contaminated and so on. The NGWR provide
owners and operators of hydrocoolers with an excellent tool for developing risk management plans.
2.5 Conflicting regulations
A multitude of state and federal bodies is responsible for setting food safety standards and it is not surprising that they occasionally conflict. A conflict that affects hydrocooling has arisen between Food Standards Australia and New Zealand (FSANZ) the Australian Pesticides and Veterinary Medicines Authority (APVMA) concerning the Maximum Residue Limit (MRL) of imidacloprid that may be applied to lettuce. FSANZ has not set an MRL, making its use illegal. The APVMA has, however, set a temporary limit of 5 mg per kg of produce and this appears to have caused confusion amongst growers. It is possible that the inadvertent use of imidacloprid could cross-contaminate produce cooled in hydrocoolers thus rendering the produce worthless.
2.6 Enforcement
If a regulatory system is to be effective it must be enforced. We have seen from the above discussion that the levels of microbial contamination of water supplies are not rigorously set – a predetermined fraction of samples must be free from contamination. It has also been noted that it is very difficult and expensive to monitor the bacteriological infection of fresh produce. Growers are also provided with a large degree of discretion in devising and operating produce monitoring systems. Furthermore, contamination can occur at any point in the food handling chain. The US Food and Drug Administration (2004) has drawn up an action plan to minimise food borne illness associated with the consumption of fresh produce. Whilst the plan includes elements of enforcement of the regulations, there is a heavy emphasis on the inspection of food handling facilities and by increasing surveillance of practices that occur in the fresh produce supply chain. The importance of education and research and development are also emphasised in the plan.
3. THE SMART WATER HYDROCOOLER
3.1 General specifications
The specifications of the Smart Water hydrocooler were developed in close collaboration with Mr Nick Christou of Christou Logistical Services. The principal specifications are that the hydrocooler should:
• Cool 6 tonnes per hour of horticultural produce from 29ºC to
12ºC, or 4 tonnes per hour from 29ºC to 6ºC.
• Be designed so that boxes of produce are to be loaded into and out of the hydrocooler by means of a fork lift truck.
• Be transportable from one horticultural growing region to
another. In this way it may be used in Queensland to cool broccoli in early summer, say, and then be transported to Victoria later in the year.
• Have a very low water and energy consumption.
3.2 The realisation of a practical commercial hydrocooler
The detailed design of a hydrocooler that satisfies the above general specifications was carried out in close collaboration with Messrs William and Alistair Bliss of Wobelea Pty, Pakenham, Victoria. To ensure that the system is transportable, and that it can accommodate ten boxes of produce simultaneously it was decided that the hydrocooler should be based on a refrigerated shipping container. The dimensions of the shipping container are given in Table III.
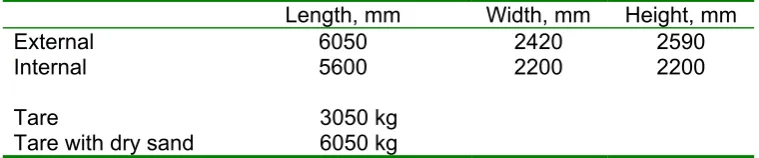
Table III. Principal dimensions of the Smart Water hydrocooler
Length, mm Width, mm Height, mm
External 6050 2420 2590
Internal 5600 2200 2200
Tare 3050 kg
Tare with dry sand 6050 kg
The key regions of the hydrocooler are shown in figure 3.1a. The container is fitted with three bays in which the produce to be cooled is loaded. The bays were formed by excising three holes in one side of the container. Seven tanks that act as reservoirs for the chilled water are located at the rear of the container, along with a smaller tank that holds water used to backwash a sand filter when it becomes blocked. An area which contains the water treatment system is located on the left hand side of the hydrocooler as viewed in Figure 3.1a. A pump room is located between cooling bays 2 and 3, and space is left on the right-hand side of the hydrocooler in which a water chilling unit may be placed. Figures 3.2 and 3.3 provide an indication of the physical realisation of the transportable hydrocooler.
There are essentially seven separate sub-systems that operate in concert, namely:
• The supply of chilled water to the system and its return to the water-chilling unit.
• The distribution of chilled water used to irrigate the produce being chilled.
• A chemical treatment system that doses the recirculated water with disinfectant to maintain it biocidal.
• A filtration system to remove both large pieces of debris and fine debris to ensure that the water has low turbidity.
• A backwashing process to remove debris from the sand filter.
• Circuits that aim to ensure that the disinfectant and chilled water are distributed uniformly around the system.
• A supply of fresh water to the system to compensate for water
removed on the produce.
The process flow diagram is shown in Figure 3.1b, but for clarity each of the sub-systems will be described individually.
3.3 Chilled water supply, storage and removal system
The chilled water is supplied to the hydrocooler from a water-chilling unit which consists of a vapour-compression refrigerator. In the study reported here the mobile chilling unit shown in Figure 3.4 is transported separately from the remainder of the hydrocooler. However, it should be pointed out that the Smart Water hydrocooler has been designed to accommodate a water-chiller that is built into the shipping container and located in the space removed at the opposite end of the container to the filter room.
The chilled water from the water refrigeration unit is stored in seven tanks located at the rear of the container. The tanks are constructed from 12 mm thick plywood lined with food grade high-density polypropylene. Each tank is 2.14 m high, 0.56 m wide and 1.15 m long and they each have a volume of 1380 litres. It can be observed from Figure 3.1c that the chilled water returning from the refrigeration unit enters tanks 2 and 5; it is withdrawn from tank 6.
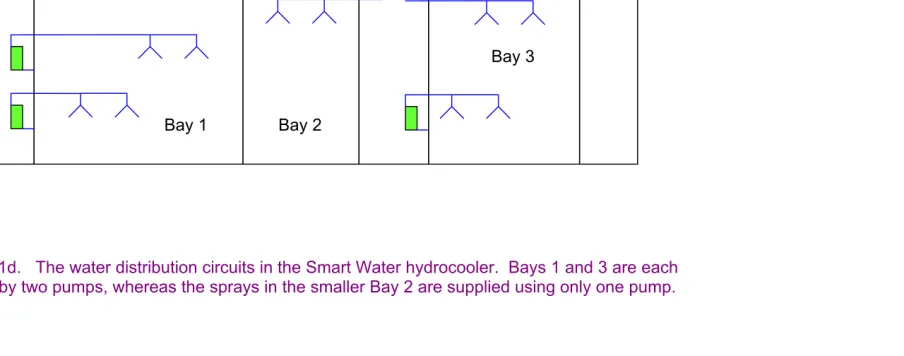
3.4 Distribution of chilled water used to irrigate the produce
The horticultural produce to be cooled is placed in the three cooling bays. Water is contained in the bases of each of the bays and it is pumped from these sumps into the water distribution systems shown schematically in Figure 3.1d. The internal distance between the front and rear of each cooling bay is 1.6 m and the depth of the water is 0.3 m. Bays 1 and 3 are 2.95 m long, and bay 2 is 1.95 m long. The total volume of water that accumulates in the cooling bases is 3770 litres, and the volume of water in the seven chilled water tanks totals 9660 litres. It can be seen that bays 1 and 3 are each served by two Ebara DWO 400 pumps that recirculate water from the reservoirs that form in the bottom of the bays up to the water distribution system. The smaller bay 2 is furnished with only one Ebara DWO 400 pump. The pumps consume about 3kW of power when they are pumping 18 litres per second of water (their maximum flow rate) through a head of about 6.5 m.
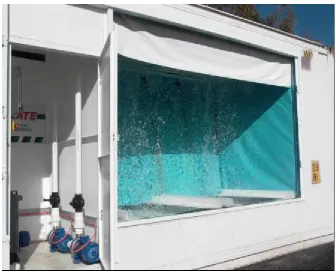
Figures 3.5 and 3.6 show the water distribution system that consists of a grid of PVC pipes; tee pieces are located in the grid as shown in Figure 3.5, and water puthers from the upwards facing openings. The water falls in the form of large droplets as indicated in Figures 3.7 and 3.8.
Each cooling bay is fitted with a roll down flexible blind to reduce the quantity of water lost as a result of splashing as it interacts with the produce being cooled. Each bay is fitted with fitted with removable doors that can be securely fastened for transport as shown in Figure 3.3.
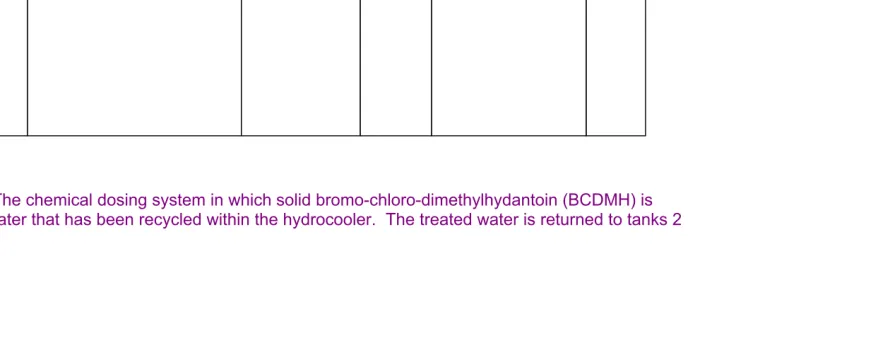
3.5 Chemical treatment system
Water in the Smart Water hydrocooler is disinfected with bromo-chloro-dimethylhydantoin (BCDMH) which is sold under the trade name Nylate®. BCDMH is a sparingly soluble white solid, and in the hydrocooler it is retained in two column feeders. The process diagram of the chemical treatment system is shown in Figure 3.1e. The rate of water in the supply line to the chemical feeders is controlled by means of a solenoid valve shown in Figure 3.9. The valve opens when the ORP falls below its set
Tank 1 Tank 2 Tank 3 Tank 4 Tank 5 Tank 6 Tank 7 Backwash tank
Chemical treatment room
Cooling bay 1 Cooling bay 2 Pump
room Cooling bay 3
Provision for refrigeration plant
Figure 3.1a. The general layout of the hydrocooler
Bay 1
Bay 2
Bay 3
Legend to process flow diagrams:
Filter
system
Sand filter
Ebara
pumps
Backwash system
Chemical
system
Mixing systems
Chemical feeders
Onga
pumps
Spray systems
Chilled water system
11
Mains system
Pre-strainers
Overflows
Figure 3.1c. Cold water from the chilling unit into tanks 3 and 6 from which it flows into adjacent
tanks that supply the cooling bays. Water returns to the chiller from tank 6.
Bay 1
Bay 2
Bay 3
Figure 3.1d. The water distribution circuits in the Smart Water hydrocooler. Bays 1 and 3 are each
supplied by two pumps, whereas the sprays in the smaller Bay 2 are supplied using only one pump.
14
Cond, T ORP pH
Figure 3.1f. Water is removed from tank 7 on the right of the hydrocooler before passing through a stainless steel
strainer. It is then pumped through a sand filter before being returned to tanks 1, 2, 4 and 7. The ORP, temperature
and electrical conductivity, and pH of the recirculated water are measured in the line that leaves the sand filter and
leads to the water tanks.
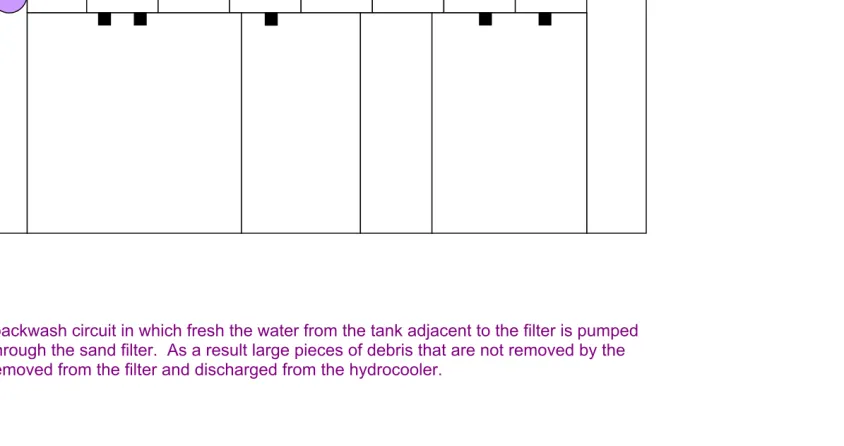
Figure 3.1g. The backwash circuit in which fresh the water from the tank adjacent to the filter is pumped
vertically upward through the sand filter. As a result large pieces of debris that are not removed by the
pre-strainers are removed from the filter and discharged from the hydrocooler.
17
Figure 3.1i. Fresh water is supplied on demand to the backwash tank and tank 1 by means of two
independent ballcocks.
point, typically 450 mV. pH and Oxidation-Reduction Potential sensors are located in a small diameter pipe in parallel with the line that returns water from the sand filter to tanks 1, 2, 4 and 7 as shown in Figure 3.1f. Provision is also made to measure the electrical conductivity of the water as this provides an indirect measurement of the total dissolved solids. A temperature sensor is integrated with the electrical conductivity sensor and it is used in the calibration of the the ORP and pH sensors. The physical disposition of the sensors is shown in Figure 3.10 and the general layout of the chemical treatment and filter room is shown in Figure 3.11 in which the red chemical dosing units are clearly visible. Figure 3.12 shows a somewhat enlarged view of the chemical dispensing system, including the water supply that is controlled by the solenoid valve.
When the hydrocooler is operating it is important that the alkalinity of the recirculated water is about 120 ppm as this prevents its pH from changing rapidly. It is therefore recommended that the operators of hydrocoolers use indicator sticks to measure the alkalinity of the recirculated water every hour. If the alkalinity is less than 120 ppm the water must be dosed with Clobr® which contains sodium bicarbonate that acts as a buffering agent to maintain the pH of the water at a value of 8.2. A low pH reading also indicates that that the alkalinity is low and that Clobr® should be added to the system, but to ensure stability of operation it is recommended that alkalinity be maintained constant by manually measuring its value.
3.6 Filtration system
Figure 3.1f shows the filtration circuit. Water is drawn by means of an Onga pump from tank 7 through a stainless steel strainer shown exposed in Figure 3.11. After it has been strained is pumped through a sand filter before being returned to tanks 2, 3, 5 and 7. After the water has been filtered its pH and ORP are sensed by sensors placed in the water line leading to the tanks as indicated in Figure 3.1f.
3.7 Backwash circuit
When the pressure drop across the sand filter exceeds 120 kPa the downwards flow of the water is terminated. Water then flows up through the sand – fluidising it, and it entrains large or low density detritus which is then discharged from the cooler. It can be seen from Figure 3.1g that the water used to backwash the sand filter is contained in a smaller water tank located towards the left hand side and at the rear of the hydrocooler. This tank has a volume of 1000 litres and it contains fresh water. The backwash piping circuit is quite straightforward. Fresh water enters the backwash tank from which it is pumped by a Onga 932 pump that has a nominal flow rate of 7 litres per second against a head of 3 m through the sand. The water from the filter is subsequently discharged from the hydrocooler.
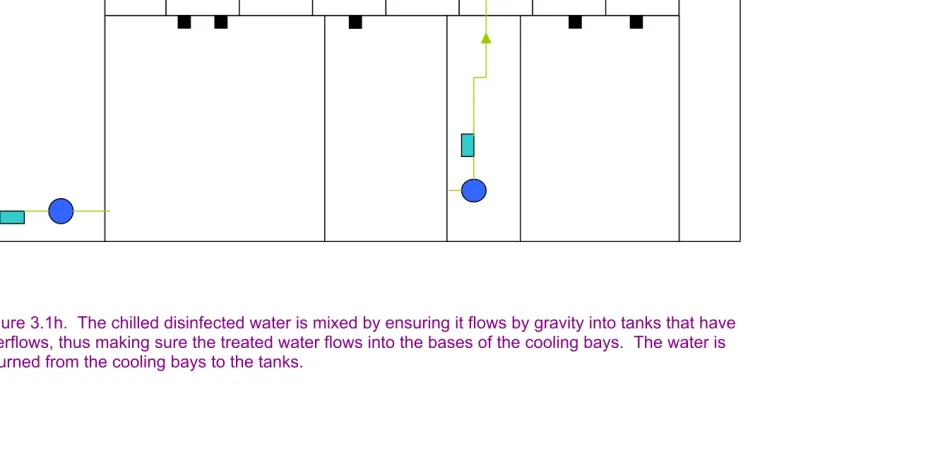
3.8 Mixing circuits
It is important that the disinfectant is distributed uniformly throughout the hydrocooler. It is important that the levels of the water in the tanks and cooling bays are also maintained constant – if they did not the water would
accumulate in one location and overflow. The mixing circuits are shown in Figure 3.1h. Adopting the following strategy has enabled the procedures for mixing and maintaining the water levels to be combined. The seven tanks that contain chilled water are interconnected by means of two 50mm diameter holes drilled near their bases. Hence, when the hydrocooler is filled via tank 1 the water levels in all of the seven tanks at the rear of the hydrocooler remain more or less equal. Eventually the water levels rise in the tanks until they begin to overflow into bays 1, 2 and 3 through 50 mm holes located near the top of the tanks. Two overflows are located in tank 1 which services bay 1. Bay 2 is serviced by an overflow in tank 3 and water flows into bay 3 from tanks 6 and 7. The cooling bays are also interconnected and the overall effect of the interconnections between the water tanks and the cooling bays is to ensure that the water levels are more or less constant throughout the hydrocooler. If the water level in one tank rises above that of one of its neighbours, water flows from the higher level to the lower level. This feature is exploited in mixing the disinfectant-containing water within the hydrocooler. For example, a portion of the water from the chemical treatment towers is delivered to tank 4 that does not incorporate an overflow. Tank 3 does, however, have an overflow and it is supposed that disinfectant-treated water will flow by gravity into this tank and subsequently into Bay 3. The pump room located between bays 2 and 3 is shown in Figure 3.13, and the pipes distributing the chemically treated and filtered water and a mixing stream are shown in Figure 3.14.
3.9 Mains supply of water
Water is lost from the hydrocooler with the cooled produce and as a result of backwashing the sand filter. Make-up water is supplied to the hydrocooler through one external water connection as indicated in Figure 3.1i. Two ball cocks independently control the water levels in the backwash tanks and the cooling water tanks.
3.10 Components of the hydrocooler
An annotated pictorial record of the components of the hydrocooler is presented below. Figures 3.4 to 3.7 illustrate the cooling water distribution system that is fabricated from polypropylene pipe and water is allowed to puther from tee junctions that face vertically upwards. It can be observed that a shower of water consisting of large droplets leaves the water distribution system.
4. THE WATER QUALITY CONTROL SYSTEM
The principles that underpin the maintenance of acceptably potable water within the hydrocooler are implemented by means of a purpose-built proprietary controller. The Wobelea AQ2000 Post Harvest Control System has the capacity to sense the following properties of the water within the hydrocooler:
• Oxidation-Reduction potential, ORP • pH
• Electrical conductivity
• Temperature.
Figure 3.2. Cooling bay 3 and a small plant room of the Smart Water hydrocooler is fabricated from a refrigerated shipping container. The two blue coloured Ebara DWO 400 pumps each extract water from the holding
tank of bay 3 and pump it to the water distribution system located in the roof of the shipping container. The water subsequently flows through the produce being cooled. It can be seen that the pipelines leading from the pumps to the water tanks are each fitted with manually operated valves.
Figure 3.3. Each cooling bay is fitted with detachable doors that can be secured when the hydrocooler is being transported.
Figure 3.4. The water chilling unit associated with the Smart Water hydrocooler.
Figure 3.5. A view of the water distribution system in the roof of the shipping container. Water puthers out of the upwards-facing tee-pieces. The inwards facing bends at the rear of the photograph help to ensure that the water is directed towards the produce.
Figure 3.6. A view of the water distribution system from below. It is supported by a light metal frame.
Figure 3.7. Water leaving the distribution system at a rate of about 18 litres per second.
Figure 3.8. Wash water landing in the base of cooling bay 3.
Solenoid-operated
control valve
Figure 3.9. A solenoid valve controls the flow of water to the
disinfectant dispensers.
3.10. Three sensors – Oxidation-Reduction Potential, pH and electrical conductivity – are inserted into the line that returns chemically treated water to the system. Only the ORP sensor is shown here, although all three were fitted to the completed hydrocooler.
Figure 3.11. The general layout of the filter room showing the blue Ebara
DW 400 pump that is used to pump water from bay 1 to one of the water distribution arrays. The green Onga pump draws water from bay 1 whence
it is strained and distributes it to tank 2 thus promoting mixing. The photograph shows the stainless steel strainer in the filtration and chemical dosing system removed from its housing. Water leaving this strainer is pumped by an Onga pump to the sand filter – the grey, almost spherical
component on the left of the figure. The cylinders that contain the disinfectant, bromo-chloro-dimethylhydantoin, are red.
Figure 3.12. The chemical dispensing units (left) and a stainless steel strainer (right). The sand filter is seen in the background of each photograph.
Figure 3.13. The pump room located between bays 2 and 3. Water from bay 2 is strained before being pumped by the green Onga pump to tanks 5
and 6. The blue Ebara pump near the centre of the figure pumps water
from the reservoir of Bay 2 to the water distribution system that is located above Bay 2.
Figure 3.14. Pipes carrying chemically dosed, filtered and water from Bay 1 to the water tanks located at the rear of the hydrocooler. The pipes are laid over the water tanks located at the rear of the hydrocooler.
In addition, the controller actuates the backwashing operation either according to a time schedule or when the pressure drop across the filter exceeds 120 kPa. The system also detects the flow of water leaving the sand filter, and should the flow fail an alarm is actuated and the pump is turned off.
A feature of the Post Harvest Control System is that it is able to control both the ORP and the pH of the water recirculated within the hydrocooler. Programmed into the controller is a proportional-integral-differential (PID) algorithm that is able to maintain good control of the disinfectant and acid or base administered to the system. The proportional part of the algorithm increases the amount of disinfectant added to the system according to the difference between the ORP set point (typically 450mV) and the actual reading. The integral component measures the average deviation from the set point and actuates the addition of disinfectant to try to maintain the average deviation zero. The differential component measures the rate of change of the deviation from the set point. The Post Harvest Control System has default control parameters that can be adjusted to suit the individual hydrocoolers.
The total dissolved solids (TDS) in the water are calculated from the electrical conductivity of the water. It is recommended that fresh water be introduced into the hydrocooler when the total dissolved solids are double that of the inlet water. For example, if the TDS of the inlet water are 600 ppm, it is recommended that fresh water be introduced when the water in the hydrocooler has a a TDS of 1200 ppm. This is unlikely in the case of broccoli which a generally a clean crop.
The Post Harvest Control System is capable of recording operating data with sampling intervals between one minute and 4 hours. When the sampling rate is 30 minutes it is possible to retrieve up to 40 days of data. It is possible that a sampling interval of 30 minutes is too long from a risk management perspective. Further data on the residence time of non-dissociated, i.e. chemically active, disinfectant are required before a definitive statement on this issue can be made. It is therefore recommended that the chemical kinetics of the dissociation of BCDMH be incorporated into an analysis of the performance of the hydrocooler.
The Smart Water hydrocooler is not equipped with a system that automatically adjusts the pH of the recirculated water. An advantage of BCDMH compared with other halogenated disinfectants is that it is relatively insensitive to the pH of the water, but it is desirable to maintain it at about 8. This is achieved by manually adding a buffering agent to the water in the hydrocooler when its alkalinity falls to less than 120 ppm. The recommended buffer is sold under the trade name Clobr® and it contains sodium persulphate and isocyanuric acid which further enhance the disinfecting potency of BCDMH, as well as sodium bicarbonate.
Figure 3.10 shows that provision is made for the sensors to be located in a small diameter by-pass line that runs in parallel with the main line that carries freshly filtered water to the chilled water tanks.
5. RESULTS
Experiments were carried out over a period of about two years to measure the performance of the various components of the system. Measurements were conducted on:
The cooling capacity of the water chilling unit The cooling rate of broccoli
The disinfection efficacy of BCDMH in the hydrocooler 5.1 The cooling capacity of the water chilling unit
The amount of energy, Q, required to cool one tonne of broccoli, and most
other fruits and vegetables, from 30ºC to 5ºC can be calculated from the equation
(
)
1000 p 30 5
Q= × ×c −
in which cp is the specific heat of the produce at constant pressure, and its
value is about 4 kJ/(kg. ºC). The amount energy required is therefore about 100 MJ per tonne of produce; this is equivalent to 28 kWh. If it is required to cool 6 tonnes per hour of produce the cooling capacity should be 208 kW.
Experiments were carried out on the water chilling unit when it was located at Goondiwindi in southern Queensland. The cooling capacity of the chilling unit was determined by measuring the rate at which the 16,900 litres of water that was cooled in a holding tank. In this exercise it was assumed that the rate of heat gain from the environment was small
compared with the cooling capacity of the chilling unit. This assumption was validated experimentally. The water in the tank was stirred and a fine thermocouple with a time constant on the order of one second was used to probe the water at different levels; the results indicated that the water in the tank was not thermally stratified. This thermocouple was used to measure the rate of cooling of water in the tank, along with a hand-held digital thermometer that provided duplicate readings. Absolute accuracies were not required as the emphasis was on temperature differences at different times.
The temperature data are recorded in Table IV and graphed in Figure 5.1. The cooling unit was turned off for two hours to investigate the rate of heat ingress into the water. It was found that the temperature rise was 0.5ºC when measured by the hand-held thermometer and 1.5ºC when measured by the thermocouple. The discrepancy may be due to the fact that the hand-held thermometer could measure the temperature of only the upper 5 cm or so of water. Hence some stratification may have occurred whilst the chilling unit was turned off. Calculations indicate that a temperature rise of 0.25ºC might be expected if natural convection on the exterior of the water tank were the rate limiting step of heat ingress. However, it is possible that solar radiation contributed by a small amount (0.1ºC) to the increase in temperature although the exterior of the tank was painted white.
Table IV Rate of cooling and heating of the recycled water
Temperature of water measured by fine thermocouple, °C
Temperature of water in tank measured by hand-held
thermometer, °C Time
10:40 18
10:50 18.6
11:10 16
11:20 16.8
11:40 13.2
11:50 15.1
12:10 11.75
12:20 13.5
12:40 9.7
12:50 9.8 12.0
Chilling unit turned off to investigate rate of re-heating
14:50 10.3 13.5
15:30 13.7
16:05 9.25 12.0
16:20 8.6 11.2
16:50 7.75 10.0
Before one can estimate the cooling capacity of the chilling unit one must know the mass of water being cooled. This was estimated to be 16930 kg, hence during the first hour of operation of the chiller when the water
temperature fell from 18.6ºC to 15.1ºC the cooling capacity,
Q
, iscalculated to be
&
(
)
68.8
3600
4.18
15.1
-18.6
16930
×
×
=
=
Q
&
kWAs the cooling progresses we observe that the cooling capacity reduces. Using the hand-held thermometer we find that when the temperature of the water is on average 11ºC the cooling capacity is
(
)
54.5
4800
4.18
10
-13.7
16930
=
×
×
=
Q
&
kWUsing the thermocouple the cooling capacity when the water temperature is 9ºC is estimated to be
(
)
16930
10.3 7.75
4.18
25.06
7200
Q
&
=
×
−
×
=
kWDuring the initial and final cooling periods the ambient temperature was measured to be 27ºC and 34ºC respectively. The voltage and current, namely 425V and 37A, define the power output of the generator used to drive the chilling unit.
Figure 5.1 The rate of cooling of the water in the storage tank enables the cooling capacity of the chilling unit to be estimated. The rise in temperature enables the heat gains to be calculated.
5.2 Flow rate through the chiller
The flow rate of water through the chilling unit was inferred from the cooling capacity of the chilling unit and the decrease in the temperature of the
water as it flowed through the chilling unit. It is found that the flow rate, , of the water re-circulated through the chilling unit is
c
V
&
(
)
12
.
7
9
.
11
2
.
13
18
.
4
8
.
68
=
−
×
=
cV
&
l/sAs a check we can re-calculate this at the end of the cooling cycle when
(
)
25.06
=2.35 4.18× 10.3-7.75
c
V& = l/s
There is clearly a discrepancy between the two estimates and the volume flow rate needs to be measured directly.
5.3 Cooling rate of broccoli
Horticultural produce with the dimensions of broccoli would be expected to approach the temperature of the cooling water within about 30 minutes of being cooled. Confirmatory experiments have been carried out on the Smart Water hydrocooler; complementary experiments have also been carried out by Harrup and Holmes (2001) of the Institute of Horticultural Development, Knoxfield, Victoria, under more controlled laboratory conditions.
Experiments were carried out to investigate the cooling of broccoli in February 2007. A partially filled bin containing about 40 kg of broccoli was placed in cooling Bay 2 of the hydrocooler. Thermocouples were inserted into the stalks of pieces of broccoli and carefully placed in the bin. Two pieces of thermocouple-containing produce were located in each of six locations of the bin, namely the
Bottom left, centre and right of the bin Top left, centre and right of the bin
Placing two pieces of produce in the same location helped to make the results more reliable. Two thermocouples were also placed in the water in Bay 2 and this water was recirculated around the system. Negligible errors would be introduced by sampling this water as opposed to the water striking the broccoli. The thermocouples leaving the box of produce are shown in Figure 5.8 and the instrumented broccoli are shown in figure 5.9.
Figure 5.2. The transportable water chilling unit that is used in conjuction with the Smart Water hydrocooler. It is located on a trailer and the pipe leading towards the left of the photograph carries cooled water to the storage tank(s).
Figure 5.3. The compressor used in the water chilling unit.
Figure 5.4 The finned coils on the left hand side of the photograph constitute the condenser of the water chilling unit.
Figure 5.5. The tank used to store chilled water when the cooling unit was located at a property in Goondiwindi, Queensland. The pipe leading from the chilling unit can be seen replenishing the tank. The blue hose on the ground leads to the hydrocooler.
Figure 5.6. An alternative form of lightweight hydrocooler located on a property in southern Queensland. It consists essentially of a water collection tray in which pallets are placed on which the produce to be cooled in loaded. Water from the tray is recycled through the water chiller. Very little thermal insulation is provided.
Figure 5.7. The water sprays in the Goondiwindi hydrocooler produce relatively find droplets of water.
Figure 5.8. The box in which the instrumented pieces of broccoli were placed to measure their rate of cooling.
Figure 5.9. The instrumented broccoli in the Smart Water hydrocooler.
The results are shown in Figure 5.10. Although there is considerable scatter and noise in the data it appears that the broccoli undergoes 80% of its cooling in about 35 minutes.
Rate o f change of the bro coo li temperature in five po sitions
0.00 5.00 10.00 15.00 20.00 25.00
10:21:11 10:29:11 10:37:11 10:45:11 10:53:11 11:01:11 11:09:11 11:17:11 T i me ( hh:mm:ss)
AVERAGE BOTTOM CENTER
Average BOTTOM LEFT
Average BOTTOM RIGHT
Average TOP CENTER
Average TOP LEFT
Figure 5.10. The rate at which broccoli cools in the Smart Water hydrocooler.
Figure 5.11. The smoothed measured results of Harrup and Holmes (2001) of the average temperature in a bed of hydrocooled broccoli.
Experiments on the rate of cooling of broccoli were also carried out by Haruup and Holmes (2001). They cooled broccoli with water that had a temperature 0ºC. It can be seen from their results, shown in Figure 5.11, that the average temperature of the broccoli falls through 80% of its cooling range in about 35 minutes which is in excellent agreement with the data obtained on the Smart Water hydrocooler.
5.4 Efficacy of the disinfectant bromo-chloro-dimethylhydantoin
The disinfectant used in the Smart Water hydrocooler is bromo-chloro-dimethylhydantoin, BCDMH. BCDMH has been approved by the Australia New Zealand Food Authority (ANZFA, 2000) for use as a food processing aid, that it is can be used in the processing of foods but it must play no part in modifying the food or form part of the final product. ANZFA (2001) has recommended that BCDMH can be used to wash and disinfect fresh fruits and vegetables provided that the dimethylhydantoin (DMH), the main residue arising from the hydrolysis of BCDMH, is present on the produce at a concentration of less than 2 mg per kg of produce. A summary of the risks and benefits associated with using BCDMH and other disinfectants are given in Appendix II.
The efficacy of the disinfecting system in the Smart Water hydrocooler was investigated by two independent laboratories. In the first test, conducted by EML Consulting Pty Ltd the system was dosed with 4.5 ×10¹¹ cfu of E. coli by pouring 600 ml of culture into tank 7 of the unit which is the tank most remote from the chemical dosing unit. Samples of water were taken at 30 minute intervals thereafter. After 30 minutes the water in two of the three bays of the hydrocooler had no detectable levels of E. coli and Bay 2 contained 35 cfu. One hour after dosing the water contained no detectable levels of E. coli. The results are presented in Table V.
Table V. The concentrations of E. coli at three locations and two times after spiking the system with 600 mL of a culture containing 760,000,000 E. coli per gram.
Location and time of sampling E. coli per 100 mL
Bay 1, 30 minutes None detectable
Bay 1, 60 minutes None detectable
Bay 2, 30 minutes 35
Bay 2, 60 minutes None detectable
Bay 3, 30 minutes None detectable
Bay 3, 60 minutes None detectable
The second test also showed that no E. coli were present in the water sampled from the hydrocooler when broccoli was being cooled. However, this test remains inconclusive because no pathogens were detected on the broccoli at the start of the experiment.
The efficacy of BCDMH against a range of bacterial and mycofloral pathogens can be gleaned from the literature survey presented in Appendix II. Unpublished data prepared by Harrup and Holmes (2001) of the Institute of Horticultural Development at Knoxfield show that as far as can be detected BCDMH is completely efficacious in removing non-pathogenic E. coli from wash water used for up to one hour in a hydrocooler. The experiments were terminated at this time. The bed of produce studied by Harrup and Holmes (2001) consisted of mixed vegetables that included broccoli, celery, parsnips and drum head cabbage, It was observed that the number coliform units in the wash water increased with time Harrup and Holmes (2001) comment that this is not surprising given that there were heavily soiled parsnips in the load being cooled.
Harrup and Holmes (2001) also carried out an experiment on broccoli that had been intentionally inoculated with a non-pathogenic strain of E. coli and found that the washing process caused a 1-5 log10 reduction in the number of colony forming units
The conclusions that can be drawn from the experiments carried out on the Smart Water hydrocooler, complementary experiments carried out by Harrup and Holmes (2001) and the literature surveyed in Appendix II indicate that BCDMH is efficacious against pathogenic organisms likely to be encountered in hydrocoolers. BCDMH has been approved by ANZFA. However, a wide range of alternative disinfectants is available.
The total operating time of the hydrocooler has been insufficient to implement a testing program for dimethylhydantoin, a product of hydrolysing BCDMH. However, it is strongly recommended that such a testing regime be implemented as this recommendation is included in the ANZFA guidelines.
5.5 Water and electricity consumption
The consumption of water and electricity were not measured directly but their values can be calculated with reasonable confidence.
When horticultural produce such as broccoli is cooled in a hydrocooler it retains about 45 litres of water per tonne of produce after it has been drained for about one minute. The amount of water that is retained by round fruit, such as apples is about 2 litres per tonne. In addition, the sand filter is likely to be cleaned on a daily basis with 1,500 litres of water. If the hydrocooler cools 6 tonnes per hour of broccoli for eight hours per day the amount of water consumed is about 75 litres per tonne. The water consumption in the case of apples is about 35 litres per tonne.
The energy required to cool one tonne of horticultural produce from 30ºC to 6ºC is 100,000 kJ which is equivalent to 28 kWh. Given a coefficient of performance of two the electrical energy required is 14 kWh per tonne. It follows that for a cooling rate of four tonnes per hour the power consumption of the chilling unit would be 56 kW. If broccoli were to be cooled to 12ºC at a rate of 6 tonnes per hour the power consumption would be 80 kW. Note that his is not 1.5 times the power consumption when the cooling rate is 4 tonnes per hour because a lower degree of cooling can be achieved at the higher throughput of produce.
The power consumption of the electrical pumps is determined from the manufacturers’ literature to be 3.75 and 2.5 kWh per tonne when the cooling rates are 4 and 6 tonnes per hour respectively. The total power consumption is therefore about 20 kWh per tonne and 16kWh per tonne when the cooling rates are respectively four and six tonnes per hour. If the water were not recirculated the electricity consumption would be about 300kWh per tonne.
When the researchers were approached by Mr Nick Christou he was cooling broccoli by spraying it with chilled water which was immediately discharged to waste. The strategy of recirculating water has reduced the water consumption from a required 60,000 litres per tonne of broccoli to about 75 litres per tonne.
5.6 By-products of BCDMH
When bromo-chloro-dimethylhydantoin (BCDMH) is hydrolysed dimethylhydantoin (DMH) is formed as a by-product as outlined in Appendix III. The Australia and New Zealand Food Authority (ANZFA) recommends that the allowable daily intake (ADI) of DMH is 0.025 mg/kg of body weight per day. This is deemed to be equivalent to concentrations of DMH of 0.2 mg/kg of fruit and 2 mg/kg of vegetables. The issue is this: DMH (as a component of BCDMH) enters the hydrocooler at a rate of about 30 g per tonne of produce, yet it leaves only on the produce. In the case of round fruit this is typically 2 g/kg of produce and in the case of broccoli it is 45 g/kg of produce. The concentration of DMH in a hydrocooler will therefore reach a steady-state when the rate of DMH entering a hydrocooler equals that leaving. One must ask the question what this concentration will be, and does it exceed the maximum limit. These questions have been addressed by carrying out mathematical analyses but they must be tested against experiment.
5.6.1 The estimated rate of accumulation of DMH in the Smart Water hydrocooler
Assumptions
Rate at which BCDMH is added to the system: 60g per tonne of
produce
Throughput of the hydrocooler: 6 tonnes per hour
Hours of operation per day: 8 hours per day
Quantity of water on 1 tonne of produce: 45 kg
Volume of the system: 13,430 litres
Rate of production of DMH: 31.9g per tonne of
produce
Analysis Steady state
In the steady state the rate at which DMH enters the system is the same as the rate at which it leaves. It can leave only on the produce. Given that the molecular weights of DMH and BCDMH are 128 and 241 respectively we calculate the mass of the constituents of DMH entering the hydrocooler to be 60 × 128/241 = 31.9g, i.e.
31.9g per tonne of produce enters : 31.9g per tonne leaves.
Hence the concentration of DMH on the produce is 31.9 mg per kilogram Transient solution
There are two ways to approach this problem – one of which is to treat the accumulation of DMH as a combination of compound interest and
withdrawals from a bank account which is a discrete problem, and in some ways this is a reasonable approximation of reality. Alternatively one can assume the problem is continuous so one can represent the problem in terms of a continuous differential equation that has a simple solution. For compactness we will present the analytical solution, although for
completeness we have also solved the discrete problem although both methods give almost identical results.
Rate of DMH entering hydrocooler = rate of DMH leaving + rate of accumulation
Let n tonnes per hour of produce be processed and let the concentration of DMH at time t hours be C grams per litre. Hence, re-writing the above equation in mathematical symbols becomes:
31.9
n
45
Cn Volume
dC
dt
=
+
If the throughput, n, of the hydrocooler is 6 tonnes per hour
(
31.9 45 1 exp)
(
(
45 6 13430)
)
C= − − × ×t
is given in Figure 5.12 and the computer script is also attached.
The rate of hydrolysis of DMH is on the order of several years (FDA, 2001) and it has not been included in this analysis, although its effects are easily incorporated into the analysis.
Figure 5.12. The concentration of DMH on produce leaving a hydrocooler
Inferences
One can conclude from the above analysis that:
• The steady-state value of the concentration on DMH on the produce is 31.9 mg/kg.
• The steady sate is approached after about 40 days.
It should be noted that this concentration is an order of magnitude greater that that recommended and this warrants further experimental investigation.
6. MODIFICATIONS TO THE HYDROCOOLER
The production of the hydrocooler was very much a research and development project. Several lessons have been learned regarding the materials of construction, process design, modifications to the shipping container and the design of the pipe layout in large scale hydrocoolers. As a result of carrying out the project horticultural growers within Victoria now have access to much improved technology. Furthermore the
technology is commercially available directly from Wobelea Pty Ltd, and indirectly through the expertise that resides within Victoria University. This latter expertise is reflected in the dissemination of completely new design techniques in the scientific literature, and presented at industry and engineering conferences. As a result of carrying out the work it is possible to help growers specify and optimise hydrocoolers to suit their needs.
6.1 Some lessons learned
6.1.1 Need to simplify the design
At first sight, the design of the prototype hydrocooler seems over complicated, but it is quite rational. Furthermore, there is a limit to the simplifications that can be made to the system. For example, there have to be circuits to feed the water sprays, there needs to be systems for filtering the recirculated water and dosing it with disinfectant and so on.
However, as a result of our gaining experience there appear to be areas in which the design could be simplified. One straightforward simplification is to replace the seven water storage tanks located toward the rear of the container with one large tank, or at least conceive of the tanks as being one large tank. In this case, the chilled, filtered and chemically treated water would enter the tank at one end of the hydrocooler as shown in Figure 5.13. Water would exit the tank at the opposite end. This arrangement would reduce the mixing circuits to one because water would be pumped from between cooling bays two and three to the region near the exit of the one large tank.
Installing a system of valves on the tank overflows may reduce heat ingress into the system. As a result, it would be possible to shut off water flowing into the cooling bays not being used to cool produce. For example, if Bay 1 were not being used the water in the base of the bay would be almost stagnant and it would take little part in the process.
The modifications suggested above are aimed at reducing the complexity of the pipe work and to reduce heat ingress into the system. However, the modifications are somewhat speculative and it is recommended that they be thoroughly investigated by mathematically modelling a range of alternatives.
6.1.2 Materials of construction
The water storage tanks are made from plywood that is waterproofed by means of food grade high density polyethylene sheet. The problems with this are that the polyethylene sheet may be torn, and during the manufacture of the hydrocooler it is difficult to seal the sheet when holes have to be made in it. This latter situation occurs when pipes joining the cooling bays must be fitted.
A solution to the problem emerged after the hydrocooler had been built – namely rectangular plastic tanks are now available. It would appear that the use of these would mitigate the problems with plywood.
Figure 6.1. A simplified flow diagram that illustrates that there is only one storage tank for chilled water, a mixing circuit has been eliminated and the amount of piping has been reduced.