Expression of the locally produced IGF-I
splice variants in damaged-regenerating and
stretched and stimulated skeletal muscle
M aria Hill BSc
A Dissertation submitted to the Board o f Studies o f the University o f London for the Degree o f Doctor o f Philosophy
ProQuest Number: U644333
All rights reserved
INFORMATION TO ALL USERS
The quality of this reproduction is dependent upon the quality of the copy submitted.
In the unlikely event that the author did not send a complete manuscript and there are missing pages, these will be noted. Also, if material had to be removed,
a note will indicate the deletion.
uest.
ProQuest U644333
Published by ProQuest LLC(2016). Copyright of the Dissertation is held by the Author.
All rights reserved.
This work is protected against unauthorized copying under Title 17, United States Code. Microform Edition © ProQuest LLC.
ProQuest LLC
789 East Eisenhower Parkway P.O. Box 1346
ABSTRACT
Muscle is a mechanical tissue in which new nuclei are obtained by the fusion o f satellite cells with damaged muscle fibres following local damage. Up regulation of the
expression of growth factors is essential to nurture the proliferation o f these muscle precursor cells. Increased expression o f IGF-I was found to be associated with regeneration of muscle fibres that is produced by muscle. Two alternatively spliced
isoforms of IGF-I are produced locally in active muscle and appear to be positive regulators of muscle hypertrophy; IGF-IEa with a similar structure to the major endocrine form produced by liver and IGF-IEb or MGF that has an extra 52bp insert in exon 5 in rodents and was found to be up regulated in exercised muscle. Muscle cells are known to produce and secrete IGFBPs that are important in modifying the availability and biological effects o f IGFs. In order to study the mechanism o f local muscle repair, two systems o f inducing local damage were applied; muscle stretch combined with an initial bout of electrical stimulation and injection of a myotoxic agent, bupivacaine.
Using Real-Time PCR with primers that distinguish these spliced forms o f IGF-I, their expression and the expression o f MyoD, M-cadherin, IGFBP-4 and IGFBP-5 were measured in the damaged tibialis anterior muscle, its contralateral muscle as well as sham and normal muscles from age matched controls. The appearance and localisation of their
proteins was investigated by immunohistochemistry.
ACKNOWLEDGEMENTS
First and foremost I would like to dedicate this work to my parents and my aunt who even though they live far away, they were there for me through all my bad times and
showed immense patience. I would like to thank them for their support and I love them greatly.
I would also like to thank my supervisor Professor Goldspink for giving me the opportunity to do this PhD and work amongst some great people. I had the opportunity to meet a few people who not only provided a good role model for hard work, stamina,
patience and self-belief, but also encouraged me and helped me with a lot of aspects of this PhD project. So I take this opportunity to give special thanks to my good friends and show my admiration to Dr Arpna Kiri, Dr Jean-Marie Delalande and Dr Chris Thrasivoulou for being there for me.
During the final year of my PhD I had the privilege to come across a very special person whom I would like to leave as anonymous. This person showed the greatest kindness and gave me the personal and professional support and help that I needed to keep on going with this PhD work. I am greatly obliged for all he has done for me and I wish some day to be able to return this to him. Thank you.
I would like to thank my very good friends and flatmates Loukia and Pepi and Eleni too, for giving me a note o f happiness and real friendship, support and love during this PhD.
Finally, I would also like to thank Professor A. Wernig from the Institute of Neurophysiology of University o f Bonn in Germany for kindly supplying me with the M-
cadherin antibody and A.F.M Moorman from the Anatomy and Embryology Department in Amsterdam for the embryonic MyHC antibody.
TABLE OF CONTENTS
TITLE P A G E ... 1
ABSTRACT... 2
ACKNOW LEDGEMENTS...3
TABLE OF CONTENTS...4
LIST OF TABLES AND FIGURES... 12
ABBREVIATIONS... 18
CHAPTER 1... 22
GENERAL INTRODUCTION... 22
1. Introduction... 23
1.1. Skeletal muscle regeneration...23
1.1.1. Types o f regeneration... 23
1.1.2. Response o f skeletal muscle to injury...23
1.1.2.1. Degeneration... 23
1.1.2.2. Factors affecting muscle regeneration...24
1.1.3. Experimental models o f muscle regeneration... 25
1.1.3.1. Morphological studies of bupivacaine...26
1.1.3.2. Mechanisms o f local anaesthetics in causing damage...27
1.1.4. Snake Venom s... 28
1.1.5. Satellite C ells... 29
1.1.5.1. Developmental Origin o f Satellite cells...29
1.1.5.2. Activation o f satellite cells during muscle regeneration...29
1.1.5.3. Satellite cell self-renewal... 33
1.15.4. Satellite cells as pluripotential stem cells... 33
1.1.6.1. Expression pattern of M-cadherin during prenatal & postnatal.... 34
skeletal muscle development 1.1.6.2. The M-cadherin catenin complex with the cytoskeleton during ....36
muscle differentiation 1.2. Skeletal myogenesis... 37
1.2.1. The Myogenic Regulatory Factors (M R F)... 37
1.2.2. Temporal and Spatial Patterns o f MRFs’ expression d u rin g... 37
embryogenesis 1.2.3. Gene targeting experiments in m ice...39
1.2.4. Regulation o f myogenesis during development... 41
1.3. Skeletal muscle fibre types... 42
1.3.1. Cellular mechanisms involved in muscle grow th... 43
1.3.2. Factors causing changes in muscle mass and phenotype o f skeletal 43 muscle 1.4. Insulin-like growth factor system ...46
1.4.1. Source of production... 46
1.4.2. IGF-I gene and mRNA structure... 46
1.4.3. Regulation of IGF-I gene transcription... 47
1.4.4. IGF-I mRNA heterogeneity...47
1.4.5. IGF-I mRNAs encoding alternate E peptides... 48
1.4.6. Role o f E peptides... 50
1.4.7. Different 5’ sequences in IGF-I cDNAs and mRNAs... 51
1.4.8. Different IGF-I mRNA 5 ’ sequences may specify different leader... 51
peptides 1.4.9. Translatability o f different IGF-I mRNAs is affected by the ...53
different 5 -UTRs 1.4.10. IGF-I mRNAs with alternate leader sequences are differentially ...53
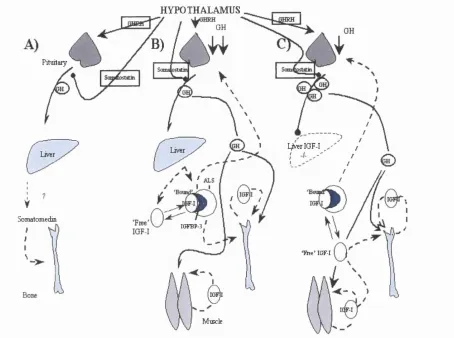
1.4.13. The Somatomedin hypothesis 2000...54
1.4.14. IGF receptors... 57
1.4.14.1. Characterization of IGF receptors in skeletal m uscle...57
1.4.14.2. Cytoplasmic signal transduction pathways... 58
1.4.15. Insulin-like growth factor binding proteins (IGFBPs)... 58
1.4.15.1. Biological actions o f the IGFBPs...59
1.4.15.2. IGFBP related proteins...60
1.4.16. Effect o f IGF-I in skeletal muscle development...61
1.4.17. Autocrine / Paracrine IGF-I function in muscle regeneration 61 1.4.18. Muscle IGF-I and Hypertrophy ... 62
1.4.18.1. Molecular mechanisms o f IGF-I induced-muscle hypertrophy 63 1.4.19. Expression of an autocrine growth factor (MGF) in muscle in 64 response to stretch and overload 1.4.20. IGF-I and satellite cells...65
1.4.21. IGF-I and muscle atrophy... 66
1.4.22. Expression o f IGFBPs during regeneration o f skeletal muscle 66 1.4.23. Expression o f MRFs during muscle regeneration... 67
1.4.24. Expression o f myostatin in regenerating m uscle...68
1.5. A im s...68
CHAPTER II... 69
GENERAL MATERIALS AND METHODS...69
Introduction and Description o f mRNA Quantification by Light Cycler.... 70
Cycler Technology 2.1. PCR and other methods o f quantifying low abundant genes... 70
2.2. Real-Time PCR compared to Conventional PCR...71
2.3. Real-Time PCR...72
2.3.1. Monitoring Real-Time PCR using SYBR Green I fluorescence.... 73
method 2.3.2. Experimental set-up and accurate quantification...74
2.4. Total RNA isolation...79
2.5. Measurement of total RNA concentration...80
2.6. Electrophoresis o f RNA... 80
2.7. Primers for cDNA synthesis and P C R ...81
2.8. First strand cDNA synthesis... 82
2.9.R T-PC R... 83
2.10. Cloning o f PCR products... 84
2.11. Real-Time RT-PCR using DNA Master SYBR Green 1 ... 85
2.12. Computer-based analyses... 86
CHAPTER i n ... 87
CHANGES IN GENE EXPRESSION OF THE IGF-I SPLICE VARIANTS IN MYOTOXIN DAMAGED AND REGENERATING RAT SKELETAL MUSCLE87 3.1. Introduction... 88
3.2. Materials and M ethods... 90
3.2.1. Experimental design... 90
3.2.2. Project L icense... 90
3.2.3. Animals and Bupivacaine protocol...90
3.2.4. Tissue preparation... 91
3.2.5. Total RNA isolation... 91
3.2.6. Measurement of total RNA concentration... 91
3.2.7. Electrophoresis o f R N A ... 91
3.2.8. Primers for cDNA synthesis and PCR...92
3.2.9. First strand cDNA synthesis...92
3.2.10. RT-PCR...92
3.2.11. Cloning o f PCR products... 92
3.2.12. Real-Time RT-PCR using DNA Master SYBR Green 1...92
3.3. R esults...93
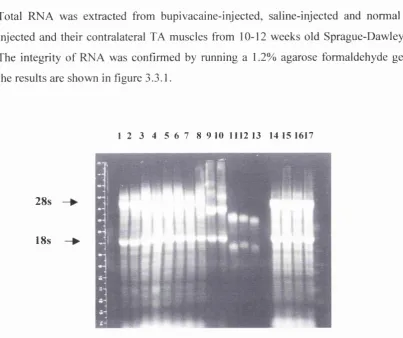
3.3.1. RNA extraction of experimental and control muscle... 93
3.3.1.x. PCR am plification... 93
3.3.2. Sequence analyses of IGF-IEa and MGF amplified products...95
3.3.3. Optimisation o f IGF-IEa and MGF amplification by R eal-T im e 102 PCR 3.3.3.1. Quantification o f IGF-I isoforms in damaged, regenerating and. 104 normal muscle 3.3.3.2. Expression o f MRF regulators during satellite cell activation 106 3.3.3.3. Involvement o f IGFBP-4 and IGFBP-5 in muscle damage and.... 108
regeneration 3.4. D iscussion... 110
CHAPTER IV... 117
LOCALIZATION OF GENERAL IGF-I AND IGF BINDING PROTEINS IN RAT TA MUSCLE FOLLOWING DAMAGE AND REGENERATION... 117
4.1. Introduction... 118
4.2. Materials and M ethods...120
4.2.1. Tissue preparation... 120
4.2.2. Morphological staining and Immunohistochemistry...120
4.2.3. Image Processing and Analysis o f immuno-histochemical-...124
fluorescent preparations 4.3. R esults...125
4.3.1. Animals and TA muscle w eights...125
4.3.2. Time course of morphological changes...127
4.3.4. Embryonic MyHC as a marker for regeneration in relation to .... 135
time 4.3.5. Immunohistochemical localization o f IGF-I, IGFBP-4 a n d ...136
IGFBP-5 proteins on bupivacaine-injected TA 4.3.5.1. Image Processing... 145
4.3.5.2. Centrally located myonuclei... 146
4.3.6. Expression pattern of M-cadherin in normal and regenerating .. 148
rat TA muscle 4.3.6.1. Image Processing... ... 154
4.4. D iscussion...155
CHAPTER V ... 161
EXPRESSION OF IGF-IEA AND MGF SPLICE VARIANTS IN RAT SKELETAL MUSCLE INDUCED BY STRETCH AND STIMULATION... 161
5.1 Introduction... 162
5.2. Materials and M ethods... 164
5.2.1. Experimental design... 164
5.2.2. Project License... 164
5.2.3. Animals and Surgical Procedure...164
5.2.4. Tissue preparation... 165
5.2.5. Total RNA isolation... 165
5.2.6. Measurement of total RNA concentration...165
5.2.7. Electrophoresis of R N A ... 166
5.2.8. Primers for cDNA synthesis and PCR...166
5.2.9. First-strand cDNA synthesis... 166
5.2.11. Cloning of PCR products... 166
5.2.12. Real-Time RT-PCR using DNA SYBR Green I detection method 166 5.2.13. Computer-based analyses... 167
5.2.14. In-situ Hybridisation probes and protocol... 167
5.3. R esults...172
5.3.1. RNA extraction of muscle samples and first strand cDNA...172
synthesis 5.3.2. Sequence analyses...173
5.3.3. Real-Time RT-PCR analysis ...173
5.3.3.1. Quantification o f IGF-I isoforms in s/s TA m uscle... 175
5.3.3.2. Expression o f MyoD in response to mechanical activity...177
5.3.3.3. Expression o f M-cadherin in s/s TA m uscle... 178
5.3.3.4. IGFBP-5 transcript levels in response to mechanical stimulus 179 5.3.3.5. Detection of IGFBP-4 transcript on s/s muscle by conventional.. 180
PCR 5.3.4. Localization o f MGF mRNA in s/s m uscle... 182
5.4. D iscussion... 184
CHAPTER VI...191
LOCALIZATION OF GENERAL IGF-I PROTEIN AND IGF BINDING PROTEINS IN STRETCHED AND STIMULATED RAT SKELETAL...191
MUSCLE 6.1. Introduction... 192
6.2. Materials and M ethods... 193
6.2.1. Tissue preparation...193
6.2.2. Morphological staining and Immunohistochemistry... 193
6.2.3. Image Processing and Analysis of Immuno-histochemical / ... 193
fluorescent preparations 6.3. R esults... 194
6.3.1. Muscle wet weight post stretch and stimulation... 194
6.3.2. Time course of morphological changes... 195
6.3.3. Variation o f damage following stretch and stim ulation... 198
6.3.4. Embryonic MyHC as a marker of regeneration in response to s/s 199 6.3.5. Localization of lGF-1, lGFBP-4 and lGFBP-5 on s/s TA muscle ..200
6.3.5.1 Image analysis o f total IGF 1, lGFBP-4 and lGFBP-5 in t h e ... 207
tendon and mid-belly regions of stretched and stimulated TA muscle 6.3.6. Expression o f M-cadherin in s/s TA m uscle... 208
6 .3.61. Image analysis o f M-cadherin staining in the tendon and ... 213
mid-belly regions 6.4. D iscussion...214
CHAPTER V l l ...220
GENERAL DISCUSSIO N... 220
REFERENCES...229
LIST OF TABLES AND FIGURES
CHAPTER I Figure 1. Figure 2. Figure 3. Figure 4. Table 1. Figure 5. Figure 6. Figure 7. Figure 8. Table 2. 27 32 35 39 40 Schematic diagram showing the myogenic differentiation pathway.A summary of molecular events implicated in satellite cell activation during skeletal muscle regeneration.
Localization of M-cadherin, laminin and N-CAM on muscle fibre. Schematic representation of myotome formation by delamination of some of the cells of the dermamyotome and further migration to the developing limbs.
Summary of targeted mutations of the MRFs in mice by homologous recombination.
Schematic representations of the rat IGF-I gene and different classes of 48 mRNA.
Human exon 4-5 (Eb) and exon 4-5-6 (Ec) cDNA sequences aligned with rat exon 4-5-6 (Eb).
Schematic representations of alternative transcription units and the predicted protein precursors of IGF-I mRNA.
The Somatomedin hypothesis.
Properties and affinities of each IGF binding protein with IGF-I and IGF-II. 50 52 56 60 CHAPTER H
Table 2.2. Comparison of Real-Time PCR using SYBR Green I with Conventional 71 PCR
Figure 2.3. Real-Time PCR apparatus by Roche Diagnostics. 72
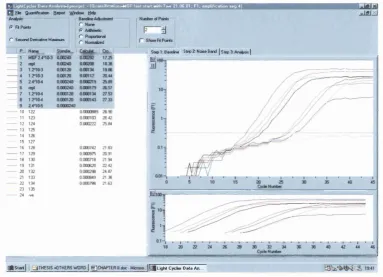
Figure 2.3.1. SYBR Green I binding to DNA during Light Cycler amplification. 73 Figure 2.3.2. Programming screen for setting up the LightCycler experimental 75
protocol.
Figure 2.3 J . Noise band screen of the Light Cycler program. 76
Figure 2.3.4. Analysis screen using the Fit Point method in a Light Cycler protocol. 77 Figure 2.3.5. The Melting Peaks Screen of a typical Light Cycler protocol. 78
Table 3. Primers used for RT-PCR and Real Time PCR with their annealing temperature.
82
93
94 96 97 98 99 CHAPTER i n
Figure 3.3.1. Electrophoresis of total RNA extracted from rat TA muscle in order to check the integrity of the RNA samples.
Figure 3.3.2. PCR amplification of IGF-IEa transcript.
Figure 3.3 J . Alignment of the cloned MGF PCR product to rat MGF cDNA. Figure 3.3.4. Alignment of the cloned MGF PCR product to rabbit MGF cDNA. Figure 3.3.5. Alignment of the cloned MGF PCR product to human MGF cDNA. Figure 3.3.6. Alignment of the cloned IGF-IEa PCR product from muscle sample to
rat IGF-IEa cDNA.
Figure 3.3.7. Alignment of the cloned IGF-IEa PCR product from muscle sample to 100 rabbit IGF-IEa cDNA.
Figure 3.3.8. Alignment of the cloned IGF-IEa PCR product from muscle samples to 101 human IGF-IEa.
Figure 3.3.9. Confirmation of MGF specific Light Cycler PCR products. 102 Table 4. Different melting temperatures of PCR products for each different 103
transcript.
Figure 3.3.10. Melting Curves of MGF Light Cycler PCR products. 103 Figure 3.3.11. Quantification of MGF levels in damaged and control muscle groups 105
normalised against GAPDH.
Figure 3.3.12. Quantification of IGF-IEa levels in damaged muscle and control 105 groups normalised against GAPDH.
Figure 3.3.13. Quantification of MyoD levels in damaged TA and control groups 107 normalised against GAPDH.
Figure 3.3.14. Quantification of M-cadherin levels in damaged and control groups 108 normalised against GAPDH.
Figure 3.3.15. Quantification of IGFBP-4 levels in damaged and control groups 109 normalised against GAPDH.
Figure 3.3.16. Quantification of IGFBP-5 levels in damaged and control groups 109 normalised against GAPDH.
CHAPTER IV
Figure 4.3. Wet weight of Bupivacaine-injected TA and Non-Injected tibialis 125 anterior muscles.
Figure 4.3b Muscle weight to body weight ratio of bupivacaine-injected and non- 126 injected control rat TA muscle.
Figure 4.3.1. Transverse sections of rat TA muscle 4 days after injection: bupivacaine 129 injection (BI), saline injection (SI) and no injection (NI).
Figure 4.3.1b. Transverse sections of rat TA muscle 4 days after bupivacaine injection. 130 Figure 4.3.2. Transverse sections of bupivacaine-injected rat TA muscle after 7d 131
recovery, 11,14 and 24 days.
Figure 4.33. Reaction of transverse sections of bupivacaine-injected rat TA muscle 132 stained with embryonic MyHC antibody after 4, 7 and 11 days recovery. Figure 4.3.4. Reaction of transverse sections of bupivacaine-injected rat TA muscle 133
stained with embryonic MyHC antibody after 14 days recovery and 24 days recovery.
Figure 4.33.1. Mean percentage of damaged-regenerating muscle fibre area in relation 134 to the whole muscle section.
Figure 4.3.4.I. Mean percentage of regenerating muscle fibre area stained with 135 embryonic MyHC antibody.
Figure 4.33.1. Section from rat TA muscle 4 days after bupivacaine injection, showing 136 moderate IGF-I immunoreactivity in small regenerating fibres.
Figure 4.33.2. Serial sections from bupivacaine-injected rat TA muscle after 4 days, 138 stained for IGF-I, IGFBP-5 and IGFBP-4.
Figure 4.333. Serial sections from bupivacaine-injected rat TA muscle after 4 days, 139 stained for IGFBP-4, IGFBP-5 and omission of IGFBP-5 antibody.
Figure 4.33.4. Serial sections from bupivacaine-injected rat TA muscle after 7 days, 140 stained for IGF-I, IGFBP-5 and IGFBP-4.
Figure 4.333. Serial sections from bupivacaine-injected rat TA muscle after 11 days, 141 stained for IGF-I, IGFBP-5 and IGFBP-4.
Figure 4.33.6. Serial sections from bupivacaine-injected rat TA muscle after 14 days, 142 stained for IGF-I, IGFBP-5 and IGFBP-4.
Figure 4.33.7. Serial sections from bupivacaine-injected rat TA muscle after 24 days, 143 stained for IGF-I, IGFBP-5 and IGFBP-4.
Figure 4.3^.8. Serial sections of bupivacaine-injected muscle that had been pre- 144 adsorbed overnight at room temperature with blocking peptides.
Figure 4.3.5.9. Mean percentage of muscle fibre area stained with IGF-I, IGFBP-4 and 145 IGFBP-5.
Figure 4.3.5.10a. Average number of muscle fibres containing central nuclei in relation 147 to those stained for IGF-I.
Figure 4.3.5.10b. Percentage of muscle fibres containing central nuclei stained for IGF-I 147 and those stained for eMyHc.
Figure 4 3.6.1. Triple fluorescent staining visualizing laminin, M-cadherin and nuclei 149 on a cross-section from a regenerating area 7 days after bupivacaine injection.
Figure 4.3.62. M-cadherin staining in cross-sections of bupivacaine-injected TA 150 muscle 4 days and 7 days after recovery.
Figure 4.3.63. M-cadherin staining in cross-sections of bupivacaine-injected TA 151 muscle 11 days and 14 days after recovery.
Figure 4.3.6.4. M-cadherin staining in cross-sections of bupivacaine-injected TA 152 muscle 24 days after recovery and its contralateral non-injected muscle. Figure 4.3.63. M-cadherin staining in the contralateral to the bupivacaine-injected TA 153
at 11 days and omission of M-cadherin antibody on the same section.
Figure 4.3.6.6. Mean percentage of regenerating muscle fibre area stained for M- 154 cadherin compared to the normal muscle fibre area.
CHAPTER V
Figure 5.1. Electrophoresis on a 13% agarose gel of MGF purified plasmid flanked by T7 and SP6 promoter sequences, following PCR amplification.
Figure 5.3.1. Electrophoresis of total RNA extracted from rat TA muscle to check the jy2 integrity of the RNA samples.
Figure 5.3.2. Quantification of GAPDH mRNA levels during 1, 5 and 7 days post s/s of TA muscle, the sham-operated control group and normal muscle. Figure 5.33. Electrophoresis of first strand cDNA samples on 1.2% agarose gel. Figure 5.3.4. Quantification of IGF-IEa levels in picograms (pg).
Figure 5.33. Quantification of MGF levels in pg Figure 5.3.6. Quantification of MyoD levels in pg.
Figure 5.3.7. Quantification of M-cad levels in pg. 178
Figure 5.3.8. Quantification of IGFBP-5 levels in pg. 179
Figure 5.3.9. PCR amplification of IGFBP-4 transcript in non- and stretched and 180 stimulated muscle.
Figure 5.3.10. Melting Curves of specific and non-specific IGFBP-4 PCR products. 181 Figure 5.3.11. Confirmation of IGFBP-4 Light Cycler PCR products. 182 Figure 5.3.12. Localisation of MGF mRNA in the mid-belly region of s/s TA muscle 183
after Iday and 5 day.
CHAPTER VI
Figure 6.3.1. Wet weight of both experimental and contralateral TA muscles 194 following 1, 5 and 7 days after stretch and stimulation, sham and normal control groups.
Figure 6.3.2.1. Transverse sections of rat TA muscle at the tendon and mid-belly 196 regions following 1,5 day and 7-days post stretch and stimulation.
Figure 6.322. Reaction of transverse sections of stretched and stimulated rat TA 197 muscle with embryonic MyHC antibody after 1,5 day and 7 days.
Figure 6.33.1. Mean percentage of damaged-muscle fibre area in relation to the whole 198 muscle section.
Figure 6.3.4.I. Mean percentage of regenerating muscle fibre area stained for 199 embryonic MyHc in relation to the whole muscle section.
Figure 6.33.1. Serial sections from the mid-belly part of stretched and stimulated rat 202 TA muscle at 1 day stained for IGF-I, IGFBP-5 and IGFBP-4.
Figure 6.33.2. Serial sections from the tendon region of stretched and stimulated rat 203 TA muscle at 5 days stained for IGF-I, IGFBP-5 and IGFBP-4.
Figure 6.333. Serial sections from the mid-belly region of stretched and stimulated rat 204 TA muscle at 5 days stained for IGF-I, IGFBP-5 and IGFBP-4.
Figure 6.33.4. Serial sections from the tendon region of stretched and stimulated rat 205 TA muscle at 7 days stained for IGF-I, IGFBP-5 and IGFBP-4.
Figure 6.333. Serial sections from the mid-belly region of stretched and stimulated rat 206 TA muscle at 7 days stained for IGF-I, IGFBP-5 and IGFBP-4.
Figure 6.33.6. Mean percentage of muscle area stained for IGF-I, IGFBP-4 and 207 IGFBP-5 in the tendon site at 1,5 and 7 days following s/s.
Figure 6.3^.7. Mean percentage of muscle area stained for IGF-I, IGFBP-4 and 208 IGFBP-5 in the mid-belly site at 1,5 and 7 days following s/s.
Figure 6.3.6.I. M-cadherin staining in 6pm cross-sections of stretched and stimulated 210 muscle after 5 days in the tendon region and the mid-belly region.
Figure 6.3.6.2. M-cadherin staining in 6pm cross-sections of stretched and stimulated 211 muscle after 7 days in the tendon region and the mid-belly region.
Figure 6.3.63. M-cadherin staining in 6pm cross-sections of 1 day stretched and stimulated muscle, sham-operated experimental muscle and normal TA. Figure 6.3.6.4. Mean percentage of damaged-regenerating and normal muscle area
stained for M-cadherin following 1,5, and 7 day of s/s.
ABBREVIATIONS
A adenine
ALS acid labile subunit
ATP adenosine 5’ triphosphate
ATPase adenosine triphosphatase
bHLH basic Helix-loops-Helix
BI bupivacaine-injected
BJVTDM bone marrow-derived macrophages
BMPs bone morphogenic proteins
bp base pairs
BSA bovine serum albumin
C cytosine
calcium ions
cAMP cyclic Adenosine 3% 5 ’-Monophosphate
cdMAF cadherin-dependent microtubule-associated factor
cDNA complementary DNA
DEPC diethyl pyrocarbonate
DIG digoxigenin
DNA deoxyribonucleic acid
dNTP deoxynucleotide triphosphate
dsDNA double stranded DNA
DTT dithiothreitol
E E-domain
EDL extensor digitorum longus muscle
EDTA ethylened iaminetetraacetic acid
FGF fibroblast growth factor
G guanine
GAPDH glyceraldehyde-3-phosphate dehydrogenase
GH growth hormone
GHR GHRH H&E HEPES HGF/SF hr IGF IgG IGFBP IGFBP rP
IGFR IL-6 IPTG
ms
kb kDA LIF M M-cad mM mRNA MAP-kinase Met MEF2 ml min MOPS mpesgrowth hormone receptor
growth hormone releasing hormone haematoxylin and eosin counterstain
2-hydroxyethyl-piperazine-N-2’-ethanelfonic acid hepatocyte growth factor/scatter factor
hour
insulin-like growth factor immunoglobulin G
insulin-like growth factor-binding protein
insulin-like growth factor-binding protein-related protein
insulin-like growth factor receptor interleukin-6
isopropyl-p-D-thiogalactosidase insulin receptor substrate kilobases
kiloDalton
leukaemia inhibitory factor molar m-cadherin microlitres micromolar millimolar messenger RNA
mitogen activated protein kinase methionine
myocyte-specifîc enhancer binding factor 2 millilitres
minutes
3-N-(morpholino) propanesulfonic acid myogenic precursor cells
MRF myogenic regulatory factor
MSCs muscle stem cells
MyHC myosin heavy chain
Na^ sodium ions
ng nanograms
nM nanomolar
N-CAM neural cell adhesion molecule
NF-AT nuclear factor of activated T cell
NGF nerve growth factor
NGS normal goat serum
NI non-injected
NLS nuclear localisation signal
OD optical density
PBS phosphate-buffered saline
PCR polymerase chain reaction
PDGF platelet-derived growth factor
PFA paraformaldehyde
PI3-kinase phosphatidyl-inositol-3-kinase
pg picograms
PMNL polymorphonuclear lymphocytes
poly A polyadenylic acid
RNase ribonuclease
RT-PCR reverse transcription-polymerase chain reaction
SI saline injected
Shh sonic hedgehog
SOL soleus muscle
SSC standard saline triphosphate
ssDNA single stranded DNA
T thymine
TA tibialis anterior muscle
Taq thermus aquaticus
TBS tris-buffered saline
TGF-beta transforming growth factor-beta
TE tris-HCl, EDTA
Tm melting temperature
Tris tris(hydroxymethyl)aminoethane
Tris-HCI tris(hydroxymethyl)aminoethane hydrochloride
UTP uridine 5’ triphoshate
UTR untranslated region
UV ultra violet
VCAM-1 vascular cell adhesion molecule
X-gal 5-bromo-4-chloro-3-indolyl-p-D-galactoside
Chapter 1
CHAPTER I
Chapter 1
1. Introduction
Skeletal muscle is a remarkably plastic tissue. It is able to retain and adapt its structure, function and metabolism during normal growth and following a variety of
mechanical stimuli and traumas to which it is subjected to throughout its lifetime. Regeneration of skeletal muscles after different levels of damage is testimony to their great potential for repair. Following direct mechanical (Carlson, 1986) or chemical trauma (Foster & Carlson, 1980; Couteaux et al., 1988), after severe exercise (Irintchev & Wernig, 1987) or during the course of myopathic or neuromuscular disease (Banker & Engel, 1986), skeletal muscle fibres degenerate partially or completely and regenerate in a stereotyped manner which restores some of their normal structure and function (Carlson and Faulkner, 1983).
1.1. Skeletal muscle regeneration 1.1.1. Types of regeneration
a) Epimorphic regeneration
This type of regeneration occurs in animals capable o f re-growing a lost appendage. Amongst vertebrates only reptiles and amphibians have the capacity for this kind of regeneration.
b) Tissue regeneration
The repair o f the damaged muscle fibres uses the viable remnants o f the original fibre and occurs independently of other tissues. Fibre repair occurs from viable segments of partially damaged fibres {continuous tissue regeneration) or from a population of proliferating myoblasts when the original fibres are severely damaged {discontinuous
tissue regeneration).
1.1.2. Response o f skeletal muscle to injury 1.1.2.1. Degeneration
Muscle degeneration occurs in two distinct phases;
Chapter 1
b) This is followed by the second phase o f degeneration in which the damaged fibre is infiltrated by circulating macrophages, which remove the necrotic debris, and this is also known as extrinsic degeneration.
1.1.2.2. Factors affecting muscle regeneration
Regeneration following injury of adult muscles is a process of generating new muscle
tissue and which to a large extent recapitulates embryonic myogenesis. Four significant components at least, of skeletal muscles contribute to the extent to which
damaged muscle fibres regenerate. These are the nerve supply, blood supply, the basal membranes and the satellite cells (Maréchal, 1986).
• Vasculature
The preservation of a functional muscle microvasculature or the ingrowth of
capillaries when the original vascular bed has degenerated is vital if the macrophage- mediated removal o f the necrotic debris is to take place and in addition, it helps regeneration process to be completed more rapidly. In contrast, in the absence o f vascular reintegration, phagocytosis will not take place, and regeneration will be suspended (Bischoff, 1975) and necrotic tissue will be replaced by connective tissue (Carlson, 1983).
• Basal Lamina
An intact basal lamina is believed to enhance fibre regeneration by its ability to act as a selective barrier, to “safeguard the memory” of the topographic relationship between the original muscle fibres. Furthermore, to assist with cellular orientation and
organized regeneration of the myotube (Vracko and Benditt, 1972) and to guide sprouting nerve fibres towards their previous synaptic sites (Marshall et al., 1977).
• Nerve supply
Absence o f innervation prevents final muscle differentiation and maturation from occurring (Carlson, 1986).
• Satellite cells
Adult skeletal muscle tissue consists of multinucleated, contractile myofibres covered
Chapter 1
(Schultz, 1989, 1996). The descendants of activated satellite cells, called myogenic
precursor cells (mpcs) undergo multiple rounds of division prior to fusing with existing or new myofibres. Satellite cells appear to form a population of stem cells that are distinct from their daughter mpcs (Grounds and Yablonka-Reuveni, 1993).
Satellite cells in adult skeletal muscle are normally mitotically quiescent but are activated (i.e. commence multiple rounds o f proliferation) in response to different
stimuli like injury, denervation, exercise or stretching (Grounds, 1998).
1.1.3. Experimental models of muscle regeneration
A number of experimental models have been developed to study aspects o f skeletal muscle degeneration and regeneration. Some o f these were designed to mimic trauma or disease and some to elucidate the mechanisms of degeneration and regeneration. These methods are grouped according to the site o f damage;
a) Damage to the sarcolemma (a collagenous envelope closely adherent to the cell membrane which is constituted by the basal lamina and the endomysial collagen / reticulin fibrils together) by mincing with auto-grafting (Studitsky, 1964; Carlson, 1972) and transecting (Gay and Hunt, 1954) a muscle will induce fibre degeneration. This method denervates and devascularizes the muscle and regeneration occurs in a disorderly manner with variable and limited recovery.
b) Damage to the plasmalemma (or known as cell membrane) by thermal injuries induced by freezing (Sartore et al., 1982) or heating (Shafiq, 1970); mechanical injuries by mild compression or crush (Jarvinen and Sorvari, 1975); by exposure to myotoxic agents including intramuscular and subcutaneous injections o f local anaesthetics (Benoit and Belt, 1970), subcutaneous injections o f cardiotoxic snake venoms (d’Albis et a l, 1989) and by hot Ringer’s solution (Schmalbruch, 1976). Thermal and mechanical
injuries cause local damage to the muscle. Subcutaneous injections o f cardiotoxins and hot Ringer’s solution produce widespread damage and intramuscular injections of local anaesthetics cause massive muscle damage.
The myotoxic agents don’t seem to involve satellite cells and have little effect on the vascular supply o f the muscle, which leads to a rapid regeneration. c) Ischaemia: free and nerve-intact grafting (Carlson et al., 1981) cause muscle
Chapter 1
along a centripetal gradient, parallel with the degeneration and re-growth of
capillaries.
1.1.3.1. Morphological studies of bupivacaine
The local anaesthetic bupivacaine is a potent and specific myotoxic agent that produces an immediate and massive myonecrosis followed by phagocytosis of
necrotic debris and a rapid and apparently complete regeneration of muscle fibres after 3-4 weeks after injection (Hall-Craggs, 1974). Electron microscopic observations on rat and mouse muscle injected with bupivacaine have given morphological details; Intrinsic degeneration begins within 15 minutes after injection of bupivacaine into fast or slow muscle. There is disruption o f plasmalemma, hypercontraction o f myofibrills,
dilatation o f the sarcoplasmic reticulum, and pyknosis of myonuclei (Bradley, 1979). During the next 12 hours there is a loss of the myofilament-banding pattern, lysis of the Z-band, rupturing o f the myofibrills, fragmentation of the cytoplasm, and dissolution o f the plasmalemma (Hall-Craggs, 1974; Yoshimura and Schotland, 1987). Macrophages engulf the necrotic fibres at 12hr, infiltrate them by 24hr and phagocytose the debris during the next 3 days (Nonaka et al., 1983; Wakayama and Shibuya, 1986). Myoblasts are observed at the end of the first day, and by the second day the population o f these mononucleated cells has increased substantially. By the third day the myoblasts ftise to form multinucleate myotubes. After 4 days, myoblasts are no longer present, and the developing myotubes now contain chains o f centrally positioned myonuclei. Growth and differentiation of the fibres occur during the next 7 to 14 days during which time the fibres appear polygonal in cross-section. By about 3 weeks, fibre maturation is complete and the size of the fibres is normal (Hall-Craggs,
1974; Sadeh, 1988), as shown in figure 1. The persistence o f centrally located myonuclei in many o f the fibres appears to be the only residue of the injury. The exposure o f muscles to local anaesthetics has been used extensively since it is
(
3
)Ce)
Mesodermic precursor cellsChapter 1
Proliferation Differentiation
Myoblasts
Myotubes
Mature muscle fibres
F ig u re 1. Schem atic diagram show ing the m yogenic differentiation pathway that involves: ( I ) determ ination o f mesoderm al precursors as m yoblasts, (2) differentiation o f m yoblasts into
m ultinucleate m yotubes and (3) maturation o f m yotubes into skeletal m yofibres.
1.1.3.2. Mechanisms of local anaesthetics in causing damage
The mechanisms by which tertiary amine local anaesthetics damage muscle fibres is uncertain, however it appears that the disruption in the regulation of sarcoplasmic Ca^^ concentrations by the sarcoplasmic reticulum and sarcolemma partly mediates their mode of action (Bianchi and Bolton, 1967). Tertiary amine local anaesthetics are membrane-permeant giving them access to the interior of muscle fibres (Bianchi and Bolton, 1967). At low concentrations, they decrease Ca^^ diffusion across sarcoplasmic reticulum membranes, whereas at higher concentrations they increase the release of calcium from, and inhibit calcium uptake by, the sarcoplasmic reticulum (Johnson and Inesi, 1969). Moreover, they competitively bind to and displace calcium from membrane binding sites that increase the ionic flux across the sarcolemma (Madieri and Carvalho, 1972).
Chapter 1
1.1.4. Snake Venoms
Snake venoms are a complex mixture of active proteins with many cytotoxic effects. Muscle damage is one of the most common symptoms produced by venoms from
species in the Viperidae family. When venom components have a specific direct action on skeletal muscle affecting muscle fibres only and leaving other tissue structures such as connective tissue and nerves unharmed, they are called myotoxins. However, some observations have shown that intra-muscular injections o f crude venoms or isolated toxins in mice selectively affect some muscle cells while leaving
others undamaged (Ownby et a l, 1976, 1982). Sensitivity to myotoxic components of snake venoms is relative to the muscle type i.e. fast or slow. Several groups observed initially, that fast muscle like EDL was more sensitive than the slow Soleus muscle to the in vivo administration of snake venoms, based on light microscopic observation of the presence of damaged muscle cells (Harris et al., 1975; Harris and Johnson, 1978; Brook et al., 1987). However, more recent investigations based on the rate of creatine kinase release from the affected muscle, showed that murine EDL muscle was more sensitive to snake venoms or isolated toxins than the Soleus muscle (Melo and Ownby, 1996). A possible explanation to this sensitivity of EDL muscle comes from observations by Nagaoka et al. (1994) that EDL has a higher mobilization o f Na^ to the intracellular medium than Soleus muscle when stimulated at low frequencies or during contractile activity. The increase in intracellular Na+ results in an interruption o f the exchange between extracellular Na^ and intracellular Ca^\ which can over activate intracellular proteases or other enzymes that can facilitate muscle cell damage (Jackson, 1993; McArdle and Jackson, 1994).
Chapter 1
1.1.5. Satellite Cells
1.1.5.1. Developmental Origin o f Satellite cells
Skeletal muscles o f vertebrates derive from the dorsa-lateral domain of somites. These
are epithelial structures that are formed in a craniocaudal sequence from the paraxial mesoderm and are flanking the axial neural tube on both sides (Christ and Ordahl,
1995). This evidence comes from quail-chick chimera experiments that showed the presence of satellite cell nuclei derived from implanted quail somite associated with host chick myofibres (Armand et al., 1983) and verified by in vitro explant culture in birds and mammals (Cossu et al., 1996). However, more recent analyses suggested that the somitic origin of satellite cells is not exclusive. It was shown that this cell population might at least in part, arise from progenitors in the dorsal aorta of embryonic mice (DeAngelis etal., 1999). Co-expression of endothelial (VE-cadherin, P-selectin, smooth a-actin, aM-integrin, p3 integrin) and myogenic markers (MyoD,
Myf5, desmin, c-Met, and M-cadherin) in cells derived from the dorsal aorta support the above hypothesis suggesting that these myogenic cells may be derived from true endothelial cells or from a common precursor. In addition, these cells are able to contribute to regenerating muscle (DeAngelis et al, 1999).
1.1.5.2. Activation o f satellite cells during muscle regeneration
The molecular mechanisms that regulate the activation of satellite cells in response to diverse stimuli, leading to their entry into the cell cycle remains under investigation. Amongst several mechanisms, the inflammatory response and the release o f growth factors have been implicated. Molecular events that have been implicated in satellite cell activation are as follows:
A. Cell-cell interactions mediated by VCAM-1 (a cell surface integrin molecule)
and VLA-4 (integrin a 4 p l) ligation may initiate genetic responses within
satellite cells and immune cells to promote regeneration (Jesse et a l, 1998).
B. Another candidate is the hepatocyte growth factor/scatter factor or HGF/SF, a large disulfide-linked heterodimer originally discovered in regenerating liver as a factor that could stimulate hepatocyte proliferation. Its receptor, the c-met
Chapter 1
intracellular tyrosine kinase domain. HGF/SF mRNA was first reported to be present in regenerating muscle (Jennische et al., 1993) therefore, it could be responsible for the activation of satellite cells and /or expansion of the
myogenic precursor cells before the new myofibres start to form. Immunolocalization studies with adult rat skeletal muscle (Tatsumi et al.,
1998) showed the presence of HGF/SF in the extracellular matrix surrounding the muscle fibres and c-met localized in putative cells. Therefore, the
activation of satellite cells by exogenous HGF/SF released from the matrix may stimulate endogenous production o f HGF/SF responsible for the stimulation of satellite cell proliferation. In addition, continuous regeneration of mdx mouse muscle, in the same study, showed both HGF/SF and c-met to be present. However, an equal expression of c-met and HGF in growing
myoblasts and myotubes has been demonstrated (Gal-Levi et a l, 1998) where myoblasts expressed c-met alone and newly formed myotubes HGF alone. The secretion of HGF by intact myotubes could promote mpc proliferation in regenerating muscle. Although a mechanism for secretion o f HGF in damaged muscle is not yet confirmed, there is strong evidence to suggest that HGF / c- met signal transduction plays a fundamental role in muscle regeneration.
C. Macrophages (activated monocytes) and polymorphonuclear lymphocytes migrate to the site o f injury a few hours after damage. Macrophages are the main immune cells present in the damaged area 48hrs post-injury (Tidball,
1995). They phagocytose necrotic cell debris and secrete a soluble growth
factor, not yet characterized, but shown to exert a mitogenic effect on myoblasts (Cantini and Carraro, 1995; Merly et al., 1999). Their essential role in muscle regeneration was drawn from results showing impaired myogenesis in their absence (Lescaudron etal., 1999).
D. Cytokines like interleukin-6 (IL-6) and leukaemia inhibitory factor (LIF) have been shown to stimulate the proliferation o f mpcs in culture (Kurek et al.,
Chapter 1
and surrounding non-muscle cells (Kurek et al., 1996). In contrast, IL-6 was shown to be produced by infiltrating immune cells at 12 to 24hrs after injury (Kurek e/a/., 1996).
E. A role for IGF-I has also been implicated in the activation of satellite cells. In vitro studies suggested that IGF-I stimulates proliferation, differentiation and fusion o f satellite cells into growing myotubes (Florini et al., 1991; Delany et al., 1994; Goldspink et al., 1995). Moreover, when IGF-I was directly introduced into the tibialis anterior muscles of adult rats, total muscle protein and DNA content were increased. This was regarded as indicative o f skeletal muscle hypertrophy relating to satellite cell activation (Rosenblatt et al., 1994; Adams and Haddad, 1996; Adams and McCue, 1998). Recent findings from Chakravarthy et al. (2000), reported that IGF-I extended the in vitro
replicative life span of skeletal muscle satellite cells by enhancing G l/S cell cycle progression via the activation of phosphatidylinositol 3 ’-kinase /Akt signalling pathway. With these observations a mode of IGF-I action stimulating satellite cell activation and prolonging their cell division capacity has been revealed.
F. Fibroblast growth factor 2 (FGF2) is also implicated in promoting recruitment of skeletal muscle satellite cells in young and old rats (Yablonka-Reuveni et al., 1999). In agreement to this finding. Floss et al., (1997) showed that FGF6 is critical in vivo for muscle regeneration. This was demonstrated by a muscle regeneration deficit when using FGF 6(-/-) knockout mice. He also proposed that FGF6 could play a role in stimulating or activating satellite cells. Both FGF2 and FGF6 might be involved in the specific recruitment o f satellite cells because they are both present in the adult muscle and promote activation / proliferation of satellite cells in isolated fibres in similar fashion (Yablonka-
Chapter 1
VLA-4/VCAM-1
ügation W
(A) r \ - b M
Immune cell
lnfiltration(PMNL)
Quiescent satellite
cell
Myogenm
MRF4
IGF-< 5 3 IGF-< 5 3
c-met
mpc expansion
Macn^hage
Rele ased factor /LIF?
D ifferentiated
m yotubes
Infilt rat mg/resident
macrophages
Figure 2. A summary o f m olecular events implicated in satellite cell activation, during
skeletal m uscle regeneration. (A ) Satellite cell activation may result from the ligation o f
V L A 4 integrin m olecule on infiltrating polym orphonuclear leukocytes (PM N L ) and V C A M
-1 on resident satellite cells. (B ) & (C ) HGF is postulated to activate satellite cells through its
receptor c-M et, expressed in quiescent satellite cells. (B ) HGF may be produced by
undamaged m yofibres in response to physiological stim uli. (C ) Basal lamina dam age and
extracellular matrix o f m yofibres may release HGF that is normally sequestered here.
A ctivation o f quiescent satellite cells results in expression o f M yoD and /or M yf5 and the
generation o f daughter m pcs. Several growth factors have been implicated in expansion o f the
mpc compartment, including HGF, PDGF, LIF, IL-6, FGF and IGF-I. In addition, a growth
factor (possibly LIF) secreted from the infiltrating m acrophages is crucial for mpc
proliferation. F ollow in g proliferation, m pcs undergo terminal differentiation in the formation
o f m yocytes that requires m yogenin and M RF4 expression before fusing with existin g or new
fibres. IGF-I has also been suggested to induce m uscle hypertrophy in fibres, independent o f
its role in mpc proliferation (adapted from Seale and Rudnicki, 2000).
Chapter 1
1.1.5.3. Satellite cell self-renewal
The number o f quiescent satellite cells in adult muscles remains relatively constant over multiple cycles of degeneration and regeneration, demonstrating an inherent
capacity for self-renewal (Gibson and Schultz, 1983). However, the mechanism by
which satellite cells undergo self-renewal remains elusive. Three possible models mentioned underneath could co-exist together to maintain a steady number of satellite cells:
1) Muscle stem cells may undergo asymmetric cell division to generate two daughter cells: a committed myogenic precursor cell and a pluripotent “self’. 2) Self-renewal o f the satellite cell compartment may be Myf-5 (the earliest
marker of myogenic commitment) dependent. RT-PCR analysis reveals that
activated satellite cells express Myf-5 first alone or MyoD alone before expressing both at the same time (Comelison and Wold, 1997). MyoD-/- myogenic cells represent an intermediate stage between a quiescent satellite cell and a myogenic precursor cell (Yablonka-Reuveni et al., 1999) and activation of Myf-5 without MyoD expression defines a capacity for satellite cells to undergo self-renewal.
3) De-differentiation of committed myogenic precursor cells, expressing myoblast markers like MyoD, Myf-5 and desmin could lead to quiescent
satellite cells.
1.15.4. Satellite cells as pluripotential stem cells
The study o f muscle satellite cells as stem cells, has been investigated thoroughly however, several intriguing questions are still raised. Experiments by Gussoni et a l,
(1999), using muscle stem cells (MSCs), showed that by intravenous injection into
mice, MSCs gave rise to satellite cells in recently regenerated host fibres. In addition, MSCs reconstituted the whole of the haematopoietic system when they were injected into lethally irradiated recipients. This was also supported by studies done by Jackson
et al. (1999) that revealed the contribution of MSCs to all major blood lineages 3 months after the injection. Whether these MSCs are the satellite cell themselves or the
direct progenitors o f satellite cells or even an independent stem cell population still remains unresolved and molecular and biochemical analysis will need to answer these
Chapter 1
regenerating muscle of a normal mouse, however not indicating whether they contribute to the satellite cell population.
The ability o f tissue-specific cells to activate various genetic programmes in response to» environmental cues is very exciting. This finding could raise the possibility of stem cell therapy for a variety of degenerative diseases, including muscular dystrophy by
the pluripotent nature of adult stem cells isolated from diverse tissues and being delivered through the circulation.
1.1.6. Cadherins involved in development of striated muscle
Cadherins are calcium-dependent, transmembrane intercellular adhesion proteins with morphoregulatory functions in the development and maintenance of tissues. The most studied cadherins are N- (neural), E- (epithelial) and P- (placental), B- (brain) and M- (muscle). Although each one of the cadherins show a distinct pattern o f tissue distribution and developmental regulation, the expression pattern o f some of these can show an overlap and can coexist in the same tissue or even in the same cell (Moore and Walsh, 1993). Cadherins are involved in processes like cell recognition and sorting, cell polarization, formation of junctional complexes and tumour metastasis (Takeichi, 1990, 1991). It has been shown that some o f the cadherins can perform only if connected to the catenins in their cytoplasmic tails. Another class of cell adhesion molecules, N-CAM (neural cell adhesion molecule) has been found on activated satellite cells (myoblast stage) and later on in myotubes during the regeneration process or on the entire sarcolemma of muscle fibres after denervation (Covault and Sanes, 1985). In normal adult muscle, N-CAM is expressed at the
neuromuscular junction (Covault and Sanes, 1986).
1.16.1. Expression pattern o f M-cadherin during prenatal and postnatal skeletal muscle development
In mouse development, M-cadherin mRNA can be first detected in somites at day 8.5 o f gestation with a delay of M-cadherin protein visible at day 10.3 in myotomal cells (Moore and Walsh, 1993). At day 16 of gestation when primary and secondary myotubes are formed, M-cadherin clusters appear on the cell surface o f all myotubes
Chapter 1
Irintchev et al., 1994; Reimann et al, 2000) and immunoelectron microscopy demonstrated its location on myofibres underneath the satellite cells (Bomemann and Schmalbruch. 1994) as shown in figure 3.
Longitudinal section m yonuclei
M -cad
:ellite cell External
lamina
Sarcolem m a
lyonucleus Transverse section of muscle
fibre
N -CA M
Lam inin
Figure 3. Localization o f M-cadherin (M -cad), laminin and N -C A M on m uscle fibre. 1 he
proportions o f the depicted struetures do not necessarily correspond to their actual size. N
-CAM w as observed rarely in intact m uscles (adapted from M cG eachie and Grounds, 1999).
Therefore, M-cadherin might serve as a molecular link between the satellite cell and the muscle fibres and any disruption of this link could result in the satellite cells being activated and entering into the muscle fibre.
In regenerating skeletal muscle fibres, M-cadherin is rapidly up regulated (Irintchev et a i, 1994) with an initial expression in myoblasts exclusively. Down-regulation of M- cadherin expression occurs when myoblasts fuse into myotubes and its expression is barely detectable in mature myotubes surrounded by basal lamina sheaths (Irintchev et a i, 1994). These results signify the role of M-cadherin in myogenic morphogenesis both in the embryo and in the adult organism during regeneration. The expression pattern of N-CAM and desmin, both muscle-specific marker proteins, differed significantly from that of M-cadherin and from each other. Desmin was found in both
mpcs (satellite cells and myoblasts) and in the differentiated multinucleated cells
Chapter 1
(myotubes and muscle fibres), which appears to agree with previous work by Bomemann and Schmalbruch (1992) therefore, presenting desmin as a marker of post-embryonic striated muscle cells in all stages of regeneration.
Double immunostaining carried out in denervated mouse muscle, for M-cadherin and laminin (a major component of the basal lamina of blood vessels and muscle fibres) showed that M-cadherin positive cells were muscle satellite cells enclosed within the basal lamina of parent muscle fibres (Irintchev et al., 1994). M-cadherin expression was also compared with the expression of N-CAM found to be up regulated in activated rodent satellite cells (Grounds, 1991). It was shown that both o f them were
more intense at the side of satellite cells facing the muscle fibre suggesting that M- cadherin and N-CAM are localized on both muscle fibre and satellite cell membranes as shown in figure 3.
1.16.2. The M-cadherin-catenin complex with the cytoskeleton during muscle diflerentiation
In skeletal muscle cells, M-cadherin interacts with p-catenin or plakoglobin and via
these proteins with a-catenin. Kaufmann et al., (1999) proposed a model of interaction of M-cadherin with the microtubules implicating that they are both essential to keep myoblasts aligned during fusion. Initially in myoblasts, microtubules spread out from the centrosomal region to the cell membrane and start orientating in parallel to the longitudinal axis o f aligned myoblasts when myogenic differentiation is underway. It is speculated that a muscle-specific and cadherin-dependent
microtubule-associated factor (cdMAF) mediates the connection of the M-cadherin catenin complex to the microtubular system. However, whether cdMAF directly interacts with the microtubules or not is still unclear. The mechanism by which the cdMAF mediates the interaction of M-cadherin/catenin and the microtubules is still elusive. One possibility could be that cdMAF binds directly to the cytoplasmic domain o f M-cadherin. Another likelihood could be that one o f the catenins,
mentioned above, generates the molecular link between the M-cadherin-catenin complex and the microtubules by interacting with the cdMAF. Based on this model, it
Chapter 1
1.2. Skeletal m yogenesis
Skeletal myogenesis begins in the embryo as a result of signalling molecules from
surrounding tissues that denote the myogenic cell fate. The existence of distinct molecular markers such as the myogenic regulatory factors (MRF) allows detailed analyses of myogenic determination, myoblast proliferation and terminal differentiation.
Gene targeting and transgenic mice have revealed the temporal and spatial expression
patterns of these muscle regulatory factors during early somitogenesis providing an insight in muscle cell determination, differentiation and gene expression.
1.2.1. The M yogenic Regulatory Factors (MRFs)
The MRFs belong to the basic helix-loop-helix (bHLH) superfamily o f transcription factors. The MRFs contain an evolutionary conserved core consisting o f a basic region, involved in DNA binding, and the HLH domain that aids their dimerization. A large number of bHLH proteins bind to the consensus E-box (CANNTG) DNA sequence found in the promoters of many o f muscle specific genes (Lassar et al.,
1989). Four MRFs have been cloned, MyoD, Myf-5, myogenin and MRF4.
Overexpression of these factors converts a wide range o f cultured cells to a muscle phenotype, demonstrating their role in myogenic lineage determination and differentiation. The MRFs functions in vivo have been investigated by the establishment o f their pattern of expression and by gene targeting.
1.2.2.Temporal and Spatial Patterns o f M RFs’ expression during embryogenesis
During development, the order of expression of MRF genes varies according to muscle origin and among species (Yun and Wold, 1996). Experiments using knockout mice progressively clarified the hierarchical relationships between the MRFs. In situ
hybridisation shows that MRF expression occurs sequentially during somitogenesis
Chapter 1
appearance o f myogenin transcripts, which remains detectable in the myotomal cells as they differentiate (Sassoon et a l, 1989). MRF4 mRNA is detected transiently in the somite between days 10 and 11 and then re-expressed at day 16 throughout the
muscle-forming regions of the embryo to become the predominant amongst the MRFs expressed afterbirth (H in te rb e r g e r ûr/., 1991). MyoD mRNA is first detected around day 10.5 in the hyp axial somite and is present throughout embryonic development (Sassoon et a l, 1989). The expression pattern of the MRFs recurs as each somite differentiates.
In the limb bud, the temporal appearance of the MRFs is different from that in the somite. Although Myf5 mRNA is detected first, co-expression o f myogenin and
MyoD mRNAs follow very quickly from day E10.5 onward. MRF4 mRNA is not expressed in the limb until late in development, first appearing at day E l 6 and becomes the principal MRF expressed in the adult (Bober et a l, 1991). The migratory myoblasts leaving the ventro-lateral domain of the somite to colonize the limb and body wall do not show MRF being expressed until they reach their final destination (Sassoon et a l, 1989). Therefore, this indicates that the signals responsible in activating the MRFs in the medial somite are distinct from those that activate the MRF expression in the migratory myoblasts arising from the lateral somite. In vivo,
Chapter 1
A. B.
N eural
\ D erm o m y o to m e
Lyotome
N o to c h o rd
Sclerotom e
D
t
V
U n seg m en ted P arax ial m esoderm
Som ite
^ TJ^^^omyotome
Sclerotom e (ventral)
F igu re 4. Schem atic representation o f m yotom e formation by delam ination o f som e o f the
cells o f the derm am yotom e and further migration to the developing limbs. Som ites form in a rostral to caudal direction. A s developm ent proceeds, som ites becom e subdivided into the
ventral sclerotom e and dorsal derm om yotom al dom ains (B ). The tw o red arrows in (A ) figure
represent the migratory m uscle precursor cells (m pcs). Derm om yotom al expansion (top red
arrow) leads to the extension o f cells to a position beneath the derm om yotom e. This marks the
formation o f the epaxial m yotom e, which can be identified by M yf5 expression. A sim ilar
extension occurs form ing the hypaxial m esoderm (not show n here) where cells predominantly
express M yoD . N t= neural tube, n= notochord, D=dorsal, V=ventral. (Adapted from Perry
and Rudnicki, 2000).
1.2.3. Gene targeting experiments in mice
In order to gain insight into the nature of lineage determination and maintenance and clarify the functions of the MRFs during myogenesis in vivo, homologous recombination was used to disrupt each MRF in mice. The following summary of events depicts the results of the experiments and shown in table 1 :
Mice homozygous null for MyoD showed no obvious muscle defect (Rudnicki, et al.,
1992). Targeted inactivation of the Myf-5 gene results in morphologically normal muscle and survival to birth, but in contrast to MyoD-null mice, they die perinatal I y
________________________________________________________________ Chapter 1
due to defective rib development and inability for normal respiration (Braun et al.,
1992). In addition, myotome formation is delayed and this causes the abnormal differentiation of the sclerotome from which the axial skeleton and ribs derive from
(Braun et al., 1992).
Since Myf-5 is the first MRF to be expressed in the mouse embryo (Ott et al., 1991) and MyoD is not expressed until later (Sassoon et al., 1989), Myf-5 must be required for the normal formation and interactive events of the early myotome. Moreover, since Myf-5 is expressed in the epithelial somite before it compartmentalizes, it may also play a role in the sclerotomal lineage formation. This suggests a possible explanation for the rib-deficient phenotype of Myf-5-null mice. Mice lacking both MyoD and Myf-5 genes show a complete absence o f myoblasts and muscle fibres.
Phototype G ^ otyp e Refn'ences
M o o d c r m a l M y o lila rts i f precTiiMTcdb
MyoD (-/-) Myf-5 (-/-)
MRF4 (-/-) ^
Myf-5 (-/-) MRF4 (-/-)
R udnicki et al., 1992
B raun et al., 1992 Z hang et aL, 1995
Patapoutian et a t, 1995 B raun & Âm<dd, 1995
Myogenin (-/-)
Myogenin(-/-) MRF4(-/-) MyoD(-/-)MRF4(-/-)
H asty et aL, 1993
N abeshim a et al., 1993 Raw ls et aL, 1998
Raw ls et aL, 1998
MyoD(-/-) Myf-5(-/-) R udnicki et a t, 1993
Table 1. Summary o f targeted m utations o f the M RFs in m ice by h om ologous recom bination. X denotes the stage o f m yogenic differentiation achieved.