© 2015, IRJET.NET- All Rights Reserved Page 1015
A SURVEY ON PERFORMANCE EVALUATION MEASURES FOR
INFORMATION RETRIEVAL SYSTEM
S.Sathya Bama
1, M.S.Irfan Ahmed
2, A.Saravanan
31
Assistant Professor, Sri Krishna College of Technology, Coimbatore, India, [email protected]
2
Professor, Sri Krishna College of Engineering and Technology, Coimbatore, India
3
Assistant Professor, Sri Krishna College of Technology, Coimbatore, India
---***---Abstract -
The World Wide Web gives plenty of information to the users. To make the search effective, a tool called search engine has been introduced. These engines crawl the web for the given users query and display the results to the user based on the relevance score (ranking). Different search engine employs different ranking algorithm. Many ranking algorithm is being introduced frequently by several researchers. Several metrics are available to assess the quality of the ranked web pages. This paper presents a survey on different evaluation measures that are available for information retrieval systems and search engines. Several illustrations are provided for all these metrics.Key Words:
Evaluation Measures, Search Engines,
Relevance Score, Information Retrieval Systems.
1. INTRODUCTION
Information retrieval (IR) is finding material like documents of an unstructured nature including text that satisfies an information need from within large collections usually stored on computers. Hundreds of millions of people connect themselves with web for information retrieval every day when they use a search engine. Information retrieval is becoming the dominant form of information access [1]. Several IR systems are used on an everyday basis by a wide variety of users. Thus, main application of IR is web search which includes finding the relevant documents for a given text query. However, the main issue in this area is relevance. Several retrieval models [2] have been proposed for search engines and most search engine uses ranking algorithm that depends on the retrieval models. Several evaluation metrics has been proposed for comparing system output with user expectations [3]. But, Information retrieval on the web is very different from retrieval in traditional indexed databases due the huge and dynamic nature of the web. Since, web retrieval is substantially different from information retrieval; various evaluative measures are required to assess relevancy [4].
Queries themselves as a list of keywords, are not always good descriptors of the information needs of the user, since users typically submit the very short queries [5, 6]. Optimization of search engine performance is clearly of dominant importance, since typical search engine receives an enormous number of queries every second, and users expect very low response times [7]. Thus several research has been carried out so for, to make the performance of the search engine effective. Several researchers had proposed many algorithms and techniques for search engines to present the relevant data to the users. Also the ranking will be made before presenting the information to the user for all web pages that are extracted by the search engines from the web. However, the quality of the results, the outcome of any search using any retrieval system depends on many factors like algorithm, search strategy, query etc. These components can be evaluated and modified to study the quality of the results [8].
Even though several methods are employed by search engines for effective search, they are not considered as effective, since the resultant set contains several irrelevant documents. Thus many new algorithms are emerging frequently [9], where the performance measure is of primary focus to prove that any proposed method is efficient. Any algorithm or method can be considered as a standard only if it is proved that its performance is better than the existing or classical method. For evaluating the ranking algorithm several metrics are already available [10]. Basically for information retrieval two categories of measures are available where one focuses on unranked sets of documents and other focuses on ranked sets [1]. Several authors have presented the correlations between the different metrics [11].A comparison of statistical significance tests for information retrieval evaluation has been made in [12]. Thus this paper presents the summary on different evaluation metrics available to assess the quality of information retrieved from the web.
Outline of Paper
© 2015, IRJET.NET- All Rights Reserved Page 1016 the recommended sets. Section 5 presents the comparison
among the measures. Section 6 gives the conclusion of this research paper.
2. EVALUATION OF UNRANKED RETRIEVAL
SYSTEM
Precision and Recall are the two main evaluation metrics used in this type of retrieval system. These are basic measure and these are extended to serve the ranked retrieval system. This session gives an overview of the methods applied to assess the quality of search systems for the set of records obtained after performing a query in an information retrieval system.
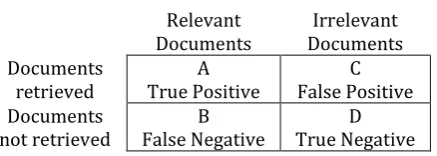
Table 1, illustrates the general form of contingency matrix using traditional alphabetic notation. The below table that is expressed using raw counts of the documents in corresponding label [13, 14].
Table -1: Contingency Matrix
Relevant Documents
Irrelevant Documents Documents
retrieved
A True Positive
C False Positive Documents
not retrieved
B False Negative
D True Negative
The variable A and D indicates the number of correct results and variable B and C indicates the number of incorrect results predicted by the search engine for any given query.
1.1 Recall
Recall or Sensitivity is the proportion of real positive cases that are correctly predicted positive. Thus it is the ratio of the number of relevant records retrieved to the total number of relevant records in the database. It is usually expressed in percentage. Based on the contingency matrix, it is expressed mathematically as in (1).
(1)
where D is the number of irrelevant records not retrieved and C is the number of irrelevant records retrieved. The aim of any ranking algorithm is to maximize the recall value. Difficulty in calculating recall is that in many cases, the total number of relevant items in a database cannot be measured [13, 14].
1.2 Precision
Recall alone is not enough since this measure does not bother about the irrelevant document retrieved. Conversely, Precision or Confidence denotes the proportion of predicted positive cases that are correctly real positives. Precision is the ratio of the number of
relevant records retrieved to the total number of irrelevant and relevant records retrieved. It is also expressed in percentage. Based on the contingency matrix, it is expressed mathematically as in (2).
(2)
where A is the number of relevant records retrieved and C is the number of irrelevant records retrieved [11, 13].The aim of any algorithm is to maximize the precision value. Both recall and precision are inversely related. This shows that increase in recall, decreases the precision and decrease in recall, increases the precision.
1.3 Inverse Recall
Inverse Recall or Specificity is proportion of real negative cases that are correctly predicted negative. It can also be given as the ratio of irrelevant records not retrieved to the total number of irrelevant documents in the database and so it is also known as the True Negative Rate. Based on the contingency matrix, it is expressed mathematically as in (3).
(3)
1.4 Inverse Precision
Inverse Precision is the proportion of predicted negative cases that are indeed real negatives. It is the ratio of irrelevant documents not retrieved to the total number of documents in the database that are not retrieved. It is also known as the True Negative Accuracy. Based on the contingency matrix, it is expressed mathematically as in (4).
(4)
1.5 F-Measure
For efficiency, the two measures precision and recall are sometimes used together in the F-measure to provide a single measurement for a system [15, 16]. The general formula for F measure is given in (5).
It is the weighted harmonic mean of precision and recall. The F1-Score or F1 Measure is considered as the special case of Fβ measure where the recall and precision are
© 2015, IRJET.NET- All Rights Reserved Page 1017 Two other commonly used F-measures are the
F2*measure, which weights recall higher than precision, and the F0.5 measure, which puts more weight on precision
than recall.
1.6 Prevalence
Prevalence measures the proportion of cases that are positive and is thus independent of the classifier; the prevalence of negative cases could also be defined analogously [17]. Based on the contingency matrix, it is expressed mathematically as in (7).
(7)
1.7 Accuracy
Accuracy is the proportion of true results (relevant retrieved and irrelevant not retrieved) among the total number of documents in the database [18]. Based on the contingency matrix, it is expressed mathematically as in (8).
(8)
1.8 Error Rate
It is the proportion of false results (relevant not retrieved and irrelevant retrieved) among the total number of documents in the database. Based on the contingency matrix, it is expressed mathematically as in (9).
(9)
The relation between accuracy and error rate is that the sum of these two measures is always 1.
1.9 Fallout
Fallout or False Positive Rate is the proportion of irrelevant documents retrieved among irrelevant documents in the database. Based on the contingency matrix, it is expressed mathematically as in (10).
(10)
1.10 Miss Rate
Miss Rate or False Negative Rate is the proportion of real positive that are predicted as negative. The ratio of relevant documents not retrieved to the total number of relevant documents. Based on the contingency matrix, it is expressed mathematically as in (11).
(11)
3. EVALUATION OF RANKED RETRIEVAL SYSTEM
This section provides the overview about the metrics used to measure the ranked retrieval sets. Many metrics are designed for ranked retrieval without any explicit rank cut-off, taking into account the relative order of the documents retrieved by the search engines and givingmore weight to documents returned at higher ranks [2,15].
2.1 Precision at k and R-Precision
At any point along the ranked list, we can look at a precision which is a useful metrics for web search, since a user tries to find out good results on the first page or on the first few pages. This is known as precision at k. (Example P at 10 corresponds to the number of relevant results on the first 10 documents). The disadvantage is that it is a least stable method. The illustration is given in Table 2. This measure is to generate a single value summary of the ranking by computing the precision at the R-th position in the ranking, where R is the total number of relevant documents. It requires having a set of known relevant documents from which we calculate the precision of the top documents returned. Averaging this measure across queries thus makes more sense.
Table -2: Precision at each position
Retrieved
Documents 1 2 3 4 5 6 7 8
Relevant
Documents √ √ × √ × √ √ √
Precision at
each rank 1/1 2/2 2/3 3/4 3/5 4/6 5/7 6/8
From Table 2, the precision at rank 10 is 6/10=0.6 or 60%
2.2 Average Precision
The precision at each point is calculated when a relevant document is encountered in the ranked list. The average of all the recorded value gives the average precision for a query result. From Table 2 the average precision at rank 10 can be calculated as
(1/1+2/2+3/4+4/6+5/7+6/8)= 0.814
2.3 Mean Average Precision (MAP)
Mean Average Precision is the average precision across multiple queries. It is the most commonly used measure in research papers. It assumes that the user is interested in finding many documents for a set of query [19]. For example, if the average precision for query 1 is 0.62 and that for the query 2 is 0.44. Then the Mean average precision = (0.62+0.44) = 0.53. Several variations in MAP have been proposed in [15].
2.4 Mean Reciprocal Rank
© 2015, IRJET.NET- All Rights Reserved Page 1018 called expected reciprocal rank (ERR) has been proposed
in [20].
4. DISCOUNTED CUMULATIVE GAIN (DCG)
DCG is another measure for ranking quality. Specifically it is used to measure effectiveness of web search engine algorithms. It measures the usefulness/gain of a document based on its position in the result set using a graded relevance scale of documents in a search engine result set. The gain is gathered from the top of the result list to the bottom with the gain of each result discounted at lower ranks.
Two assumptions are made in using DCG and its related measures [8].
Highly relevant documents are more useful when appearing earlier in a search engine result list (have higher ranks)
Highly relevant documents are more useful than marginally relevant documents, which are in turn more useful than irrelevant documents.
4.1 Cumulative Gain (CG)
Cumulative Gain is the predecessor of DCG and does not include the position of a result in the consideration of the usefulness of a result set. In this way, it is the sum of the graded relevance values of all results in a search result list [21]. The CG at a particular rank position P is defined as in (12).
(12)
where reli is the graded relevance of the result at position
i. As an illustration, consider a list of documents in response to a given search query. The relevance of each document can be judged on a scale with lower values for irrelevant documents and high values for relevant documents. In our example, consider a scale of 0-3 with 0 meaning irrelevant, 3 meaning completely relevant. For the documents ordered by the ranking algorithm, the user provides the following relevance scores as in table III.
Table–3 Ranked Documents with their Relevance Score
Document Order Relevance Score
D1 3
D2 2
D3 3
D4 0
D5 1
The Cumulative Gain can be calculated by finding the sum of all relevance score. Thus the relevance score at position 5 is given as
CG5 = (3+2+3+0+1) =9
This measure does not consider about the change in the order of the documents. In the table 3, even if we
interchange any of these documents say D1 and D5, the CG
remains same.
4.2 Discounted Cumulative Gain (DCG)
The principle of DCG is that highly relevant documents appearing lower in a search result list should be penalized as the graded relevance (GR) value is reduced logarithmically proportional to the position of the result [8, 22]. The discounted CG accumulated at a particular rank position Pis given in (13).
(13)
The computation of DCG value at each position for the documents listed in Table 3 is given in Table 4.
Table–4 DCG Calculation at each position
Rank (i)
Gain (GRi)
log2
i DCGi
1 3 - - DCG1=3
2 2 1 2 DCG2=3+2=5
3 3 1.58 1.89 DCG3=5+1.89=6.89
4 0 2 0 DCG4=6.89+0=6.89
5 1 2.32 0.43 DCG5=6.89+0.43=7.32
4.3 Normalized Discounted Cumulative Gain (NDCG) Comparing a search engine's performance from one query to the next cannot be consistently achieved using DCG alone, so the cumulative gain at each position for a chosen value of P should be normalized across queries [23, 24]. This is done by sorting documents of a result list by relevance, producing the maximum possible DCG till position P, also called Ideal DCG (IDCG) till that position. For a query, the normalized discounted cumulative gain, or NDCG, is computed as in (14).
To normalize DCG values, an ideal ordering for the given query is needed. For this example, that ordering would be the monotonically decreasing sort of the relevance judgments provided by the experiment participant, which is: 3, 3, 2, 1, 0.
The DCG of this ideal ordering, or IDCG5= 7.762
© 2015, IRJET.NET- All Rights Reserved Page 1019
5. COMPARISON
The below table, Table 5 compares the various evaluationmetrics for information retrieval System Table–5 Comparison of Various Performance Evaluation Measures for Information Retrieval System
Category of Information Retrieval System
Types of Measure Applications
Unranked Retrieval System
Recall
It considers a set of relevant documents for a query is the same, independent of the user
Precision Inverse recall Inverse precision
Prevalence Used by epidemiologists, health care providers, government agencies, and insurers
Accuracy Used for evaluating machine learning classification problems and not a good measure for information retrieval
Error rate
Used in the field of speech recognition and information retrieval Fallout
Miss Rate
Ranked Retrieval System
Precision at k Used in web search but it is least stable method
R-Precision Used for observing the behaviour of an algorithms for each individual Average Precision Used for systems which retrieve relevant documents quickly
Mean Average Precision
Used if a set of test information needs must be large and diverse enough to be representative of system effectiveness across different queries. Mean Reciprocal
Rank It estimates how early get relevant result in ranking Normalized
Discounted Cumulative Gain
Used in cases where order of the document in the resultant set is important. It is used to calculate relevance based on the grade.
6. CONCLUSION
In this paper, a survey on various evaluation metrics used by search engine has been made. Several measures are explained in this work where each work is used based on the type of information retrieved. The survey helps the researcher in evaluating the effectiveness of the ranking algorithm with other classical methods
REFERENCES
[1] Manning, Christopher D.; Raghavan, Prabhakar; Schütze, Hinrich, “Introduction to Information Retrieval”. Cambridge University Press, 2008.
[2] Singhal, Amit,"Modern Information Retrieval: A Brief Overview". Bulletin of the IEEE Computer Society Technical Committee on Data Engineering24 (4): 35– 43, 2001.
[3] B. Croft, D. Metzler, and T. Strohman, “Search Engines: Information Retrieval in Practice”. Addison Wesley, 2009.
[4] Gwizdka J, Chignell M. “Towards information retrieval measures for evaluation of web search engines”. Unpublished manuscript (1999).
[5] Ricardo Baeza-Yates, "Applications of Web Query Mining"3408. Springer Berlin / Heidelberg. pp. 7–22., 2005.
[6] Amanda Spink, Dietmar Wolfram, Major B. J. Jansen, Tefko Saracevic, "Searching the web: The public and their queries". Journal of the American Society for Information Science and Technology52 (3): 226–234, 2001
[7] Shital C. Patil*, 2 R. R. Keole, "Improving Search Result Delivery using Content and Usage Mining", International Journal of Applied Research and Studies (iJARS), Volume 3, Issue 3, 2014.
[8] "Introduction to Information Retrieval - Evaluation". Stanford University. 21 April 2013. Retrieved 23 March 2014.
[9] Mihajlovic, V., Djoerd Hiemstra, Henk Ernst Blok, and Peter MG Apers. "Exploiting Query Structure and Document Structure to Improve Document Retrieval Effectiveness.", 2006.
[10]Liu, Tie-Yan. "Learning to rank for information retrieval." Foundations and Trends in Information Retrieval 3, no. 3,pp. 225-331, 2009.
[11]D. R. Radev, H. Qi, H. Wu, W. Fan, "Evaluating web-based question answering systems". Proceedings of LREC, 2002.
© 2015, IRJET.NET- All Rights Reserved Page 1020 information and knowledge management, pp.
623-632. ACM, 2007.
[13]Powers, David M. W., Recall and Precision versus the Bookmaker, Proceedings of the International Conference on Cognitive Science (ICSC-2003), Sydney Australia, 2003, pp. 529-534.
[14]Powers, David M W, "Evaluation: From Precision, Recall and F-Measure to ROC, Informedness, Markedness & Correlation". Journal of Machine Learning Technologies2 (1): 37–63, 2011.
[15]Nallapati, Ramesh, and Chirag Shah. “Evaluating the quality of query refinement suggestions in information retrieval”. Massachusetts Univ Amherst CenterFor Intelligent Information Retrieval, 2006. [16]Robert M. Losee, “When Information Retrieval
Measures Agree About the Relative Quality of Document Rankings”, Journal of the American Society for Information Science, 51(9), pp. 834-840, 2000. [17]Alex Hartemink, “Clarifying various terms for
evaluating classifier (or hypothesis testing) performance”
[18]Brodersen, K.H.; Ong, C.S.; Stephan, K.E.; Buhmann, J.M. "The balanced accuracy and its posterior distribution". Proceedings of the 20th International Conference on Pattern Recognition: 3121–24, 2010. [19]Turpin, Andrew; Scholer, Falk, "User performance
versus precision measures for simple search tasks". Proceedings of the 29th Annual international ACM SIGIR Conference on Research and Development in information Retrieval (Seattle, WA, August 06–11, 2006) (New York, NY: ACM): 11–18, 2006.
[20]Chapelle, Olivier, et al. "Expected reciprocal rank for graded relevance." Proceedings of the 18th ACM conference on Information and knowledge management. ACM, 2009.
[21]KalervoJarvelin, JaanaKekalainen: Cumulated gain-based evaluation of IR techniques. ACM Transactions on Information Systems 20(4), 422–446, 2002. [22]Chris Burges, Tal Shaked, Erin Renshaw, Ari Lazier,
Matt Deeds, Nicole Hamilton, and Greg Hullender, “Learning to rank using gradient descent”. In Proceedings of the 22nd international conference on Machine learning (ICML '05). ACM, New York, NY, USA, 89-96, 2005.
[23]Yining Wang, Liwei Wang, Yuanzhi Li, Di He, Wei Chen, Tie-Yan Liu, “A Theoretical Analysis of NDCG Ranking Measures”. In Proceedings of the 26th Annual Conference on Learning Theory, 2013. [24]"Normalized Discounted Cumulative Gain". Retrieved
23 March 2014.
BIOGRAPHIES
S.Sathya Bama has 6 years of experience in both teaching and research. She has presented and published research papers in varies international journals & conferences. Her area of interest includes Web Mining, Data Mining.
Dr.M.S.Irfan Ahmed has 19 years of teaching experience and 13 years of research experience. He received the best faculty award in the year 2012. He has presented and published more than 30 research papers in international journals & conferences.