R E S E A R C H
Open Access
Resource allocation to femtocells for coordinated
capacity expansion of wireless access
infrastructures
Dimitrios Karvounas
*, Andreas Georgakopoulos, Vera Stavroulaki, Nikos Koutsouris, Kostas Tsagkaris
and Panagiotis Demestichas
Abstract
As the Internet has penetrated everyday life, more and more users will demand high-quality services. However, the Internet was not designed to handle such heavy usage. Thus, networks need to be enhanced in order to deal with the increased traffic. In this study, the use of opportunistic networks (ONs) is studied. ONs are operator-governed, coordinated extensions of the infrastructure and are created dynamically for a limited time frame. The problem studied is the capacity extension of congested infrastructure via resource allocation to femtocells. More specifically, a macro base station (BS) is considered with deployed femtocells within its area. As soon as a problematic situation is discovered, the congested BS notifies the network management entity which will determine the solution
method. In our case, a proportion of terminals that cause the congestion will be offloaded to the nearby femtocells relieving the macro BS. This is achieved through two approaches: a greedy algorithm that allocates the minimum possible power level to femtocells in order to acquire as much terminals as possible, and an energy-efficient algorithm that assigns the minimum possible power level to the femtocells that are required to cover specific terminals. Femtocells that are not needed are switched off.
Keywords:Opportunistic networks, Capacity extension, Future internet, Femtocells, Power allocation
Introduction
The Internet has become critical to everyday life in domains as diverse as education, health, commerce, etc. The Internet initially was not designed for such heavy usage. Therefore, networks need to be enhanced in order to handle the increased traffic and offer ad-equate services in terms of quality of service (QoS), security and mobility. To achieve this, operators need to overcome certain limitations. First of all, at any mo-ment the network may experience capacity problems due to a plethora of reasons. As a result, congestion issues arise.
In order to face the aforementioned problem, this study will focus on the use of opportunistic networks (ONs) that seem to be a promising solution for the problem of the capacity extension of congested infra-structure (e.g., BSs). ONs are operator-governed,
coordinated extensions of the infrastructure and are cre-ated dynamically for a limited time [1]. In addition, an efficient way to relieve the congested infrastructure is offloading, i.e., the transfer of a proportion of the traffic to alternative non-problematic radio access networks (e.g., Wi-Fi access points, femtocells, other BSs, etc.).
The life cycle of an ON consists of four phases: suit-ability determination, creation, maintenance, and ter-mination. At the suitability determination phase, the suitability of an ON at a specific time and area is determined. The final configuration of an ON is done in the creation phase. The selection of aspects such as involved nodes, used spectrum for the ON are done based on the context information and more accurate estimations of the radio environment. At the mainten-ance phase, monitoring will be done to ensure that the ON is still valid and efficient for what it was created for. According to the monitoring information, reconfig-uration or termination functionalities can be triggered. Reconfiguration will ensure the most efficient operation * Correspondence:dkarvoyn@unipi.gr
University of Piraeus, 80 Karaoli & Dimitriou str, Piraeus 18534, Greece
of the ON. When the ON operation is no longer ne-cessary or suitable, the ON will be terminated.
In this study, a network is considered that consists of a macro base station (BS), terminals that are served via the macro BS and femtocells that are distributed within the coverage area of the macro BS. At some point, the macro BS faces congestion issues due to the high traffic from the terminals. The proposed solution is to offload an amount of the traffic to the femtocells through the creation of an ON among femtocells and terminals. The target is to specify the minimum trans-mission power of the femtocells that is needed to cover the terminals. Therefore, two approaches are presented. The dynamic resource allocation (DRA) al-gorithm that allocates power levels to femtocells in order to acquire as much traffic as possible from the macro BS, and the energy-efficient resource allocation (ERA) that selects the minimum number of femtocells and the minimum power level that are required to cover specific number of terminals. Due to the fact that terminals will be offloaded to the femtocells, the BS will serve fewer terminals and therefore the power consumption will be reduced leading to savings in operational expenditure. In addition, users will experi-ence higher QoS since a part of the terminals will be offloaded to the femtocells, while the remaining term-inals will be served by the BS that will have solved its congestion issues.
The rest of the article is structured as follows:“Related work” section describes state-of-the-art work related to our problem. “Capacity extension through femtocells” section presents the capacity extension problem and the message sequence chart for the exchange of messages between the network elements. The DRA algorithm that will be used for the solution of the problem is illustrated in “Solution” section, as well as the ERA algorithm. “Simulation results” section describes the simulation implemented to validate the solution and the obtained results are presented. Finally, the article is concluded in “Conclusion”section
Related work
This section provides a discussion of state-of-the-art work related to the examined problem.
Mobile data offloading is the use of complementary networks for the delivery of data that were originally targeted for cellular networks [2]. The main Radio Ac-cess Technology (RAT) used for the data offloading is Wi-Fi. The main advantage of Wi-Fi is that it operates at the unlicensed spectrum and therefore causes no interference to cellular networks. In addition, in most urban areas, Wi-Fi is ubiquitous available deployed by operators or by single users. Dimatteo et al. [3] evalu-ate the potential costs and gains for providing Wi-Fi
offloading in a metropolitan area by using large-scale real mobility traces for empirical emulation.
Self-organizing networks (SONs) are the simplified management mechanism for the long-term evolution (LTE) using auto-configuration and auto-optimization, evolving from the universal mobile telecommunica-tions system (UMTS) [4]. The main functionalities of SONs include self-configuration, self-optimization, and self-healing. More specifically, self-configuration com-prises all necessary tasks to automate the deployment and configuration of the network. Self-optimization improves network performance by adjusting network parameters on the fly. Self-healing comprehends a set of functions to deal with service outages including detection, cause analysis, and outage mitigation mechan-isms [5].
Virtual carrier is a method to exploit the cooperation of licenced (e.g., UMTS, LTE) and unlicensed (Wi-Fi) spectrum to improve network capacity. The levels of synergy vary, depending on whether a multiprotocol cli-ent connects to distinct 3G/4G and Wi-Fi Access Points or to integrated 3G/4G/Wi-Fi devices that can imple-ment cooperative utilization of the available spectrum. In this case, an additional/virtual carrier is available to increase network performance [6]. Himayat et al. [7] provide further information for multiradio interworking between worldwide interoperability for microwave access (WiMAX) and Wi-Fi.
Mobile hotspots are multiprotocol portable devices with both cellular and local area network or personal area network interfaces that route traffic from nearby devices to the cellular networks [6]. More specifically, these devices create a Wi-Fi hotspot and as a result, other Wi-Fi-enabled devices can connect to this hotspot and access the cellular backhaul network without having a 3G/4G interface.
“forage”, representing a function inversely proportional to the interference level.
In addition, Abgrall et al. [11] suggest a distributed inter-cell power allocation algorithm where each cell computes by an iterative process its minimum power budget to meet its local QoS constraints. Their results show how their work permits to reduce both transmis-sion power and harmful effects of in-band interference, while meeting QoS constraints of users in each cell. Moreover, Mach and Becvar [12] focus on a power control mechanism and propose a novel approach for dynamic adaptation of femtocells’ transmitting power. The basic idea is to adapt the transmitting power of femtocells according to current traffic load and signal quality between user equipments and the femtocell in order to fully utilize radio resources allocated to the femtocell.
Finally, De Domenico and Calvanese Strinati [13] propose a resource scheduling algorithm which improves spectral reuse while reducing the transmission power in each resource block. More specifically, their model is based on 3GPP/LTE downlink specifications [14,15] where both BSs and terminals implement an OFDM air interface. OFDM symbols are organized into a number of physical resource blocks consisting of 12 contiguous subcarriers for 7 consecutive OFDM sym-bols. The proposed scheduler assigns each user a certain number of resource blocks, in which the femtocell repeats the original message implementing a repetition code. Moreover, the overall available power is split within the global number of assigned RBs, reducing the interference generated in each block.
Capacity extension through femtocells Concept
As it was aforementioned in the previous sections, an operator may face at any moment congestion in the in-frastructure. In order to overcome this problematic situ-ation, our approach proposes the use of ONs for the infrastructure capacity extension through femtocells. Femtocells are fully featured but low power BSs that op-erate in licenced spectrum in order to connect mobile terminals to the network of an operator through residen-tial broadband connections [16]. Therefore, the signal strength improves significantly resulting in better QoS. Moreover, there are different ways for a user to access a femtocell: the closed subscriber group (CSG) model, where only a limited number of users have access to femtocell’s resources. These users are defined by the femtocell owner. The open subscriber group (OSG) where all the operator’s customers have access to the femtocell. The hybrid subscriber group where a limited amount of femtocell’s resources are available to all users, while the rest are operated in a CSG manner [17].
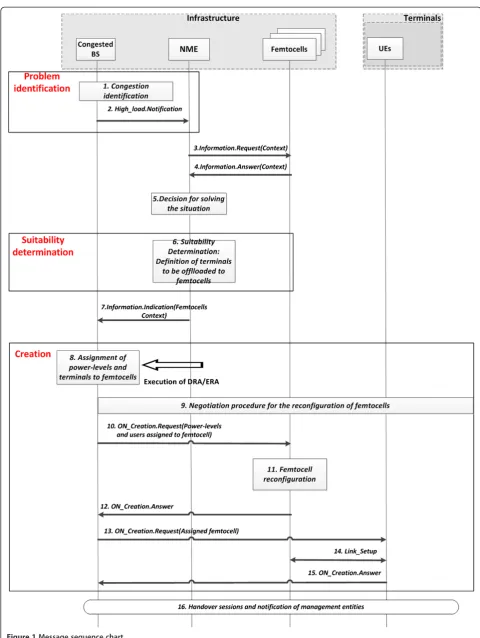
In the capacity extension problem, as soon as a BS experiences congestion issues the network management entity (NME) is notified in order to trigger the solution procedure. If neighbor femtocells are deployed, the NME acquires their status in order to investigate whether they can help in the solution. The femtocells that will be chosen to contribute can temporarily add users of the congested BS to their CSG or they can temporarily transit from CSG to OSG. In our approach, the second option is followed. As soon as the NME sends the information of the femtocells to the con-gested BS, the BS will execute the DRA or the ERA algorithm in order to be relieved by rerouting traffic to the femtocells. The decision is sent to the femto-cells in order to allow users to use their resources and configure their transmission power and to the UEs in order to connect to the femtocells.
Message sequence chart
Mathematical formulation
For the proposed solution, a network like the one of Figure 2 is assumed. The target is to assign the most appropriate power-level to femtocells in order to serve the users of the macro BS. Let F be the set of femto-cells and let B be the set of the macro BSs, while the set of terminals will be denoted with T. Moreover, PL will denote the set of power-levels to which the femto-cells can be configured. In addition, the following deci-sion variables are considered.
Xij¼
1; if terminali2T is assigned to infrastructure j2F[B 0; otherwise
(
ð1Þ
Ykj¼
1; if powerlevelkis assigned to femtocell j2F
0; otherwise
(
ð2Þ
In order to calculate the coverage of a femtocell according to its transmission power, the propagation model proposed by the Jako and Jeney [18] is used.
The allocation problem is an optimization problem, where an objective function (OF) will be minimized, sat-isfying a number of constraints. Accordingly, the overall optimization problem can be formulated as follows
Minimize OF¼X
j2F
CPjþ X
j2F X
j06¼j j02F
φjφj′
2
þX
i2T X
j2F[B
Xijdij ð3Þ
subject to:
X
j2F[B
Xij¼1;8i2T ð4Þ
X
k2PL
Ykj¼1;8j2F ð5Þ
φj≤capj;8j2F ð6Þ
Nijk≤Ykj;8i2T;j2F;k2PL ð7Þ
Xij≤NijkYkj;8i2T;j2F;k2PL ð8Þ
where
ber of terminals that are served through the femtocell, while capj is the capacity of femtocell j, i.e., the
max-imum number of terminals that the femtocell can serve. In addition, dij is the Euclidean distance of terminal i
from BS/femtocell j (in metres), while Pj denotes the
maximum transmission power of femtocell j (in Watts) and CPjis the current transmission power of femtocellj. lk depicts the proportion of the maximum transmission
power to which a femtocell is configured to operate (e.g., l1= 0.5).
The OF in (3) tracks the power consumption of the femtocells, the load balancing factor among femtocells, and the distance of the terminals from their serving in-frastructure. More specifically, the first term of the func-tion is the power consumpfunc-tion of the femtocells. The second term is used as a load-balancing factor and is the square of the load difference between each femtocell. The usage of this term is to ensure that terminals will be equally distributed among the femtocells. Lastly, the third term expresses the distance among the terminals and their serving BS/femtocell. As far as the constraints are regarded, relation (4) depicts that each terminal is served by one and only one BS or femtocell, while rela-tion (5) denotes that every femtocell can be configured to operate at only one power-level. Relation (6) illus-trates the fact that the current load of a femtocell cannot exceed its capacity. Relation (7) expresses the fact that a terminal cannot be covered by a femtocell which oper-ates at power-level k, if the power-level is not assigned to the femtocell. Relation (8) depicts that a terminal can-not be served by a femtocell operating at power-levelk, if the terminal is not covered by the femtocell or if the power-level has not been assigned to the femtocell. Rela-tion (9) denotes that the load of a femtocell is equal to the number of the terminals that are served through it, while relation (10) is utilized to calculate the current transmission power of a femtocell.
Solution
In order to solve the aforementioned optimization problem two algorithms were developed, namely the DRA algorithm and the ERA algorithm. The algo-rithms are compared to the well-known meta-heuristic SA algorithm (described at the Appendix) which has received a very positive feedback from the network community because of its proved ability to provide good solutions in reasonable amount of time, as well as the ability to be applied in the most up-to-date net-work problems.
DRA
One input parameter of the algorithm is the network topology which consists of a set of terminals within the macro BS coverage and their mobility level and a set of femtocells with a maximum capacity that they can sup-port and a set of power-levels to which they can be con-figured. The algorithm will calculate the allocation APF of power-levels to femtocells and the distributionAUFof terminals to femtocells. The two assignments constitute a solution set which corresponds to a solution with an OF value.
The algorithm can be described in steps as follows. At Step 1 the algorithm starts by configuring all femtocells to operate at their minimum power-level. At Step 2, for this minimum power allocation, which corresponds to a minimum coverage, the terminals are assigned to femto-cells using a variation of the RDQ-A (described at the Appendix) algorithm [19]. Step 3 inspects whether all terminals are assigned to femtocells or if all femtocells have reached their maximum transmission power the al-gorithm ends. If not, the launch of m sub-problems is triggered at Step 4, wheremis the number of femtocells that have not reached the maximum transmission power. At each sub-problem, the power-level of a different fem-tocell is increased to the next power-level resulting in different power-allocations (APF)1,. . .,(APF)m. Each
sub-problem is processed simultaneously at Step 5. More specifically, for each sub-problem the RDQ-A algorithm is executed and the assignmentAUFof terminals to fem-tocells is computed. The selection of the best set takes place at Step 6, in terms of minimization of the OF of relation (3). Finally, the algorithm performs a transition to Step 3.
chart of the algorithm, while Algorithm 1 depicts an overview of the DRA algorithm.
Algorithm 1 An overview of the DRA algorithm
Input:
1. A macro BS and its specifications (capacity, coverage)
2. A set of terminals within the macro BS coverage, their traffic requirements, and their mobility level
3. A set of femtocells and their specifications (capacity, maximum transmission power,
power-levels at which they can be configured, subscriber group type)
Main process:
1. Configure all femtocells to minimum transmission power-level.
2. Assign terminals to femtocells and QoS to terminals through RDQ-A.
3. If all terminals are assigned to a femtocell or all femtocells reached their maximum power-level, the algorithm ends.
4. Else, the power-level of the femtocells is increased, creating a sub-set of problems.
5. Each sub-problem comprises the increment of the power-level of a femtocell. At each sub-problem, the RDQA algorithm is executed.
6. The best solution is chosen and the algorithm performs a transition to Step 3.
Output:
1. Power allocation to femtocells. 2. Distribution of terminals to femtocells.
ERA
As it was aforementioned, the lifecycle of an ON includes the suitability determination phase. This phase will provide the input to the ERA algorithm and specific-ally the terminals that should be offloaded to the femto-cells in order to solve the problematic situation. The set of these terminals will be denoted with T’T. Appar-ently the mobility level of the femtocells will also be taken into account, due to the fact that terminals with high mobility level (e.g. ≥2 m/s) should not be rerouted to femtocells because they will need to proceed to a handover to a macro BS shortly. The ERA will also utilize the set of femtocells and their capabilities in terms of capacity and possible power-levels at which they can be configured to operate. The output of the
algorithm will comprise the selection of the femtocells that are needed to serve the terminals provided by the suitability determination phase, as well as the minimum possible power allocation to the femtocells in order to cover these terminals.
The algorithm can be described in steps as follows. At Step 1 the algorithm starts by forming the F’ set which contains the femtocells with the smallest distance from the terminals of T’. Therefore, F’Fcan be expressed as follows.
F0¼f 2F:Nifkmaxdif≤Nijkmaxdif;ð8i2TÞ∧ð8j6¼fÞ
ð12Þ where kmax2PL is the maximum power-level at which the femtocell can be configured. At Step 2 the algo-rithm configures all femtocells that belong to F’ to op-erate at their maximum power-level. It should be reminded that each power-level k2PL corresponds to a range of coverage covk. At Step 3 the terminals are
assigned to the femtocells for this power allocation and according to the aforementioned constraints.Tfwill
de-note the set of terminals that were assigned to be served by femtocell f2F’. Therefore, TfT’ can be
expressed as follows.
Tf ¼ i2T0:Xif ¼1
ð13Þ
At Step 4 the algorithm forms the Fd set which
con-tains the femtocells that can reduce their power, i.e., they have not reached the minimum power-level kmin2PL.
Therefore,FdF’can be expressed as follows. Fd¼ f 2F0:Ykminf ¼0
ð14Þ Step 5 checks if Fd is empty. If it is empty, the
algo-rithm is terminated; otherwise it proceeds to Step 6 where the next femtocell f2Fd is picked up. At Step 7
the power-level of f is reduced to the next power-level and then Step 8 checks if a terminali2Tfexists that is
no longer within the range of f due to the power-level reduction. If there is no such a terminal, the femtocell is able to reduce its power-level and the algorithm transits to Step 7. Otherwise, the algorithm must proceed to Step 10 where the power-level of the femtocell must be set to the previous-value in order to continue covering the user. Then fis removed from Fd since it cannot
de-crease its power-level any more. Finally, the algorithm transits to Step 5.
Figure 4 illustrates the ERA concept, while Figure 5 depicts the flow chart of the ERA algorithm.
Simulation results Methodology
In order to evaluate the proposed DRA algorithm, a platform has been developed as a multi-agent system, based on JADE [20] and a customized version of the op-portunistic network environment [21] in order to take into account mobility aspects. The JADE middleware enables the integration, interaction, and cooperation of all the entities that reside in it. In addition, each BS and
femtocell is an agent that can communicate with other agents and exchange real messages.
Furthermore, it assumed that femtocells can operate at six different power-levels, i.e., 50, 60, 70, 80, 90, and 100% of their maximum transmission power.
Table 1 depicts the parameters that were considered during the simulations.
All simulations were executed in a system with Intel Core i3 CPU at 2.53 GHz and 4.0 GB of RAM.
Results
Scenario 1
As it was aforementioned above, in this study a macro BS which faces congestion issues was studied. A propor-tion of the terminals of the BS that is responsible for the problematic situation will be offloaded to seven femto-cells within the area of the BS. The DRA algorithm cal-culated the power level of the femtocells at which most users were covered and the solution was compared with the one provided by the SA.
Figure 6 illustrates the power levels of the femtocells, as were calculated by the two algorithms. As it can be observed, the power level distribution is similar for both algorithms. The main difference of the output of the two algorithms is that femtocell 6 is configured to operate at the 50% of its maximum transmission power by the DRA algorithm, while the SA algorithm configures it at the maximum power level.
Figure 7 depicts the number of terminals that each femtocell acquired from the macro BS. The main differ-ence is that femtocell 1 acquired three terminals accord-ing to the DRA solution and none accordaccord-ing to the SA solution. In addition, femtocell 6 acquired two terminals by the SA algorithm and none by the DRA algorithm.
Figure 8 illustrates the progress of the OF for each it-eration of the DRA and SA algorithm. Specifically, the
Table 1 Parameters used at the simulation
Parameter name Value
Macro BS transmission power 60 W
Femtocells maximum transmission power 0.120 W
BS/femtocells frequency 2140 MHz
Terminals power sensitivity –90 dB
SA cooling rate 0.85
SA maximum number of iterations 500
SA initial temperature 100
Packet size 64–1024 KB
values of the vertical axis correspond to the values of the OF, while the values of the horizontal axis corres-pond to the iterations of each algorithm. Apparently, the OF values tend to decrease as the DRA algorithm proceeds. The reason is that the algorithm selects the best assignment set at Step 6, leading to the reduction of the OF. Regarding the comparison with the SA algo-rithm, the DRA needed 17.45 s to estimate the solu-tion, while the SA needed 38.16 s. Thus, the DRA algorithm proved to be 54.26% faster than the SA. In addition, the OF value of the best solution that was estimated by the DRA was 24.06, while the one of the SA algorithm was 29.35. Therefore, the quality of the DRA solution proved to be 18.03% better than the one of the SA algorithm.
Scenario 2
In this scenario, the ERA solution will be evaluated. To this respect, a macro BS is considered and within its area 9 femtocells are deployed and 40 terminals. As far as the traffic model of the terminals is regarded, message gener-ation is a random variable, ranging from 3 to 7 s uni-formly distributed with mean of 5 s. Furthermore, message size is a random variable in the range of
64–1024 KB uniformly distributed. Also, the number of terminals that generate traffic in each interval is random. Moreover, the goal of the algorithm is to select the femtocells and assign them with the minimum possible power-level that is needed to cover the terminals that will be offloaded to the femtocells. As it was aforemen-tioned in the previous sections, these terminals are pro-vided as input to the ERA algorithm by the suitability determination phase. In order to proceed with the evalu-ation, 18 cases were considered. Each case comprises the number of terminals that will be rerouted to the femto-cells, the mobility level of the terminals (in terms of m/ s) and the distribution of the terminals within the area. Specific two distributions are taken into account. A “centralized”one which means that terminals are distrib-uted at the center of the macro BS, and a “sparse” one which means that terminals are uniformly distributed within the area of the BS. Table 2 depicts the considered cases. It should be noted that due to the fact that the DRA algorithm does not accept input from the suitabil-ity determination phase, these cases cannot be examined for the DRA concept.
Figure 9 illustrates the delivery probability of all 40 terminals in the congested BS before and after the Figure 7Terminals acquired by femtocells after the execution of DRA and SA.
solution enforcement for each one of the 18 investigated cases. The horizontal axis depicts the number of the case, while the vertical one presents the delivery prob-ability. The general trend shows that as mobility level increases the delivery probability tends to drop. On the other hand, as more terminals are offloaded to femto-cells, delivery probability tends to increase.
Figure 10 shows the average delay for delivered mes-sages from all 40 terminals in the congested area before
and after the solution for each one of the 18 cases. The horizontal axis depicts the number of the case, while the vertical one presents the average delay in seconds. In all cases, the proposed concept tends to perform better since the delay drops compared to the situation before the solution enforcement. Specifically, the decreasing delay is higher when more terminals are offloaded to femtocells, while as the moving speed of the terminals increases, the average delay tends to increase as well.
Furthermore, the power-level that was assigned to each femtocell is estimated in Figure 11, as well as the number of terminals that each femtocell acquires is also counted in Figure 12. In addition, the runtime of the ERA algorithm in milliseconds is provided in Figure 13. Table 3 depicts the previously aforementioned cases grouped by the number of terminals offloaded to femto-cells and according to the distribution of the terminals within the macro BS area, that correspond to the afore-mentioned results in Figures 11, 12, and 13. Apparently, in the“centralized”distribution the femtocells needed to be configured to high power-level in order to cover the increased number of terminals. On the other hand, only the 25% of the femtocells had to be utilized, while the rest were turned off. On the other hand, in the“sparse” distribution the terminals where uniformly distributed so each femtocell served only 1–2 terminals. Thus, low power-levels were assigned to the femtocells. However, almost all femtocells needed to be utilized.
Conclusion
This article considers ONs as a solution to the problem of capacity expansion of congested infrastructure. In par-ticular, as soon as a macro BS faces congestion issues, nearby femtocells are exploited in order to acquire a pro-portion of the BS’s terminals. Femtocells and terminals
Table 2 Considered cases
Case # terminals to be offloaded to
create an ON relieving the problematic BS. The complex optimization problem that raised is mathematically for-mulated and solved by two algorithms. The first one, namely the DRA can be utilized by the operators that prefer to serve as many terminals as possible by femto-cells. The second one, namely the ERA, selects only the femtocells that are needed to cover specific terminals and assigns to the femtocells the minimum possible power-level. Therefore, this algorithm should be preferred by operators that need to achieve energy efficiency.
Through the simulations, it is observed that the DRA algorithm exhibits better performance than the well-known and tested SA algorithm. More specific-ally, the DRA algorithm proved to be 28.57% faster than the SA algorithm. In addition, the value of the OF that corresponds to the solution that was com-puted by the DRA algorithm was 17.91% better than the one of the SA algorithm. Regarding the ERA al-gorithm, it managed to reduce the delay in the con-gested area by 15% in average and to increase the delivery probability.
Appendix RDQ-A
Tsagkaris et al. [19] focus on a distributed RAT selection process which in general aims at dynamically selecting and adapting to the most appropriate RAT for all term-inals in the network, depending on the network condi-tions, system capabilities and demand aspects. RAT selection is modeled through an optimization problem called RDQ-A problem (RAT, Demand and QoS-Allocation problem). The solution of the RDQ-A prob-lem consists in new reconfiguration actions, i.e. new allocations: (i) of available RATs to the transceivers of a BS, (ii) of demand (users) to transceivers and (iii) of QoS levels (bitrate) to users.
The RDQ-A problem is implemented in four phases highly collaborating with each other. Each phase exploits the output of its preceding phase, while it pro-duces appropriate output to be used in the next phase, and so on. Specifically, during the first phase, all candi-date allocations of RATs to transceivers are found, con-sidering the aforementioned system aspects. Each Figure 10Average delay for each considered case.
allocation corresponds to the launch of a sub-problem. The resulting sub-problems obtained are then pro-cessed in parallel. In the second phase, for each of the sub-problems the quality levels offered to users are set to their lowest possible values and the allocation of de-mand to transceivers is extracted. Then, in the third phase, the optimum allocation of demand to QoS levels is explored by retaining the demand to transceivers al-location from the previous phase and continuously in-creasing the offered quality levels. Finally, the fourth phase contains the selection of the best allocations’ triplet, in terms of maximization of an OF related to utility, i.e., the level of users’ satisfaction and the minimization of the associated cost.
Simulated annealing
In general, in each step, the SA algorithm replaces the current solution by a random neighbor solution, chosen with a probability that depends on the difference be-tween the corresponding OF values and on a global par-ameter T (called the temperature), that is gradually decreased during the process (cooling). In this manner, the algorithm searches the solution space in a random way and at the same time it avoids becoming stuck at local minima.
More specifically, suppose that S is the finite set of all possible solutions and f is a real valued function (i. e., the OF), defined on members of S. The problem is to find a solution s 2 S that minimizes f over S. The algorithm starts with an initial solution. A neighbor of this solution is then generated by a mechanism (which depends on the problem) and the change in cost is cal-culated. If a reduction in cost is found, the current so-lution is replaced by the neighbor one. However, if an increase is found the neighbor solution is accepted sometimes. The acceptance or the rejection is deter-mined by a sequence of random numbers, but with a controlled probability. The probability of accepting a move which causes an increase Δf to the OF is called the acceptance function and is normally set to exp (–Δf/T), where T is a control parameter which corre-sponds to temperature in the analogy with physical annealing. This acceptance function implies that small increases in f are more likely to be accepted than large increases, but asTapproaches zero, most increases will be rejected. The reason of this “strategy” is to avoid be-coming trapped in local optima. Therefore, SA starts with a relatively high value of T. The algorithm pro-ceeds by attempting a certain number of neighborhood moves at each temperature, while the temperature Figure 12Number of terminals acquired by femtocells for each grouped case.
parameter is gradually dropped [22]. Algorithm 2 depicts a pseudo-code for the SA algorithm.
It should be noted that in this work if the OFof each new solution is not at least 10% better than the one of the previous one and this occurs for 100 iterations, which means that the algorithm has coverged to a solu-tion, the algorithm is terminated.
Algorithm 2 Simulated annealing
Input:
1. An initial solutions02S 2. The initial temperatureT0 3. The cooling ratec
4. The maximum number of iterationsimax
Main process:
1. The sub-optimal solutionsbest2S
Competing interests
The authors declare that they have no competing interests.
Acknowledgment
This study was performed in the framework of the European-Union funded project OneFIT (www.ict-onefit.eu). The project was supported by the European Community’s Seventh Framework Program (FP7). The views expressed in this document do not necessarily represent the views of the complete consortium. The Community is not liable for any use that may be made of the information contained herein.
Received: 19 November 2011 Accepted: 23 September 2012 Published: 9 October 2012
References
1. V. Stavroulaki, K. Tsagkaris, M. Logothetis, A. Georgakopoulos, P. Demestichas, J. Gebert, M. Filo, Opportunistic networks: an approach for exploiting cognitive radio networking technologies in the future Internet. IEEE Veh. Technol. Mag.6(3), 52–59 (2011)
2. B. Han, P. Hui, V. Anil, Kumar, M Marathe, J Shao, A Srinivasan. Mobile data offloading through opportunistic communications and social participation. IEEE Trans. Mob. Comput.11(5), 821–834 (2012)
3. S Dimatteo, P Hui, B Han, V Li, Cellular traffic offloading through WiFi networks, in 8th IEEE International Conference on Mobile Ad-hoc and Sensor Systems (IEEE MASS, Valencia. Spain2011, 192–201 (2011) 4. S. Feng, E. Seidel,Self-Organizing Networks (SON) in 3GPP Long Term
Evolution(Nomor Research GmbH, Munich, 2008)
5. Nokia Siemens Networks,Introducing the Nokia Siemens Networks SON Suite—an efficient, future-proof platform for SON, white paper(Nokia Siemens Networks, 2009)
6. S. Yeh, S. Talwar, G. Wu, N. Himayat, K. Johnsson, Capacity and coverage enhancement in heterogeneous networks. IEEE Wirel. Commun.
18(3), 32–38 (2011)
7. N. Himayat, S. Talwar, K. Johnsson, K. Etemad, J. Puthenkulum, V. Gupta, L. Yang, M. Park, G. Wu, C. Chan,Heterogeneous networking for future wireless broadband networks(, 2010). IEEE 802.16 Documents, IEEE C80216-10_0003r1
8. A. Agustin, J. Vidal, O. Muñoz,Interference pricing for self-organisation in OFDMA femtocell networks, in European Workshop on Broadband Femtocell Networks
(Future Network and Mobile Summit, Warsaw, Poland, 2011), pp. 1–8 9. S. Barbarossa, A. Carfagna, S. Sardellitti, M. Omilipo, L. Pescosolido, Optimal
radio access in femtocell networks based on markov modeling of interferers’activity, inIEEE International Conference on Acoustics, Speech and Signal Processing (ICASSP)(Prague, 2011), pp. 3212–3215
10. P. di Lorenzo, S. Barbarossa, Distributed resource allocation in cognitive radio systems based on social foraging swarms, inIEEE 11th International Workshop on Signal Processing Advances in Wireless Communications (SPAWC)
(2010), pp. 1–5
11. C. Abgrall, E.C. Strinati, J.C. Belfiore, Distributed power allocation for interference limited networks, inIEEE 21st International Symposium on Personal Indoor and Mobile Radio Communications (PIMRC)(Istanbul, 2010), pp. 1342–1347
12. P. Mach, Z. Becvar, QoS-guaranteed power control mechanism based on the frame utilization for femtocells. EURASIP J Wirel Commun Netw 2011 (2011)
13. A. De Domenico, E. Calvanese Strinati, A radio resource management scheduling algorithm for self-organizing femtocells, inIEEE 21st International Symposium on Personal, Indoor and Mobile Radio Communications Workshops(Istanbul, 2010), pp. 191–196
14. 3GPP TSG RAN, 3GPP TR.25814, Physical Layer Aspects for Evolved UTRA (Release 7)(2006). v7.1.0
15. 3GPP TSG-RAN1#48, Orange Labs, China Mobile, KPN, NTT DoCoMo, Sprint, T-Mobile, Vodafone, and Telecom Italia,R1-070674, LTE physical layer framework for performance verification(2007). v7.1.0
16. ThinkFemtocell, http://www.thinkfemtocell.com/
Table 3 Grouped cases
17. G. de la Roche, A. Valcarce, D. Lopez-Perez, J. Zhang, Access control mechanisms for femtocells. IEEE Commun Mag48(1), 33–39 (2010) 18. Z. Jako, G. Jeney, Downlink femtocell interference in WCDMA networks,
energy-aware communications, in17th International Workshop, EUNICE 2011
(Springer, 2011)
19. K. Tsagkaris, G. Dimitrakopoulos, A. Saatsakis, P. Demestichas, Distributed radio access technology selection for adaptive networks in high-speed, B3G infrastructures. Int J Commun Syst Wiley20(8), 969–992 (2007)
20. Java Agent DEvelopment Platform (JADE), http://jade.tilab.com 21. A. Keranen, J. Ott, T. Karkkainen, The ONE simulator for DTN protocol
evaluation, inProc. SIMUTools'09: 2nd International Conference on Simulation Tools and Techniques(Rome, 2009)
22. R.W. Eglese, Simulated annealing: a tool for operational research. Eur J Oper Res46, 271–281 (1990)
doi:10.1186/1687-1499-2012-310
Cite this article as:Karvounaset al.:Resource allocation to femtocells for coordinated capacity expansion of wireless access infrastructures.
EURASIP Journal on Wireless Communications and Networking20122012:310.
Submit your manuscript to a
journal and benefi t from:
7 Convenient online submission
7 Rigorous peer review
7 Immediate publication on acceptance
7 Open access: articles freely available online
7 High visibility within the fi eld
7 Retaining the copyright to your article