PREPARATION AND CHARACTERIZATION OF SOLID DISPERSION FAMOTIDINE – MANNITOL
BY CO-GRINDING METHOD
LILI FITRIANI, SHERLY RAMADHANI, ERIZAL ZAINI*
Department of Pharmaceutics, Faculty of Pharmacy, Andalas University, Padang, West Sumatera 25163, Indonesia. Email: [email protected]
Received: 10 November 2016, Revised and Accepted: 23 November 2016
ABSTRACT
Objective: This study aims to prepare and characterize solid dispersion of famotidine using mannitol to enhance the solubility and dissolution rate.
Methods: Solid dispersions were prepared by co-grinding method in 9 formulas. The ratio of famotidine and mannitol was varied (1:1, 1:2, 2:1 w/w), and each ratio was milled at three different times (30, 60, and 90 minutes). The physical mixture was also prepared as comparison at ratio 1:1 w/w. Solid dispersions were characterized by X-ray diffraction analysis, Fourier transform infrared (FTIR) spectroscopy, differential scanning calorimetry (DSC) analysis, scanning electron microscopy (SEM), particle size analysis, solubility, and dissolution rate study. The assay of famotidine was done using a UV spectrophotometer.
Results: The highest solubility of famotidine in solid dispersion was obtained in F2 (ratio 1:2 and grinding time 30 minutes). The solubility of intact famotidine, physical mixture, and solid dispersion F2 was 1.630±0.027, 2.757±0.096, and 3.272±0.076 mg/ml, respectively. X-ray diffractogram of solid dispersion F2 showed a decrease in the peak intensity of famotidine. Thermogram of DSC showed a decrease of famotidine melting point for both physical mixture and solid dispersion. Photomicrograph of SEM indicated the changes in morphology solid dispersion compared to intact substances. FTIR analysis showed no chemical interaction between famotidine and mannitol. The particle size analysis showed a reduction in the particle size of the solid dispersion. The dissolution result after 60 minutes was 85.029%, 86.166%, 92.057% for intact famotidine, physical mixture, and solid dispersion F2, respectively.
Conclusion: Solid dispersion increased solubility and dissolution rate.
Keywords: Solid dispersion, Famotidine, Mannitol, Co-grinding, Solubility.
INTRODUCTION
Famotidine is an H2 receptor antagonist, acts similar to cimetidine,
which inhibits H2 receptor selectively and reversibly [1]. In general,
famotidine is used for the treatment of gastric ulcers, duodenal ulcers, Zollinger-Ellison syndrome, and gastroesophageal reflux disease. Compared to others H2 receptor antagonist, famotidine has 7.5 times
more potent than ranitidine and 20 times than cimetidine [2]. Famotidine is better than cimetidine since it does not have antiandrogenic effect which causes sexual dysfunction (impotence) and gynecomastia [1].
Famotidine is classified into Class IV based on Biopharmaceutics Classification System, which has low solubility and low permeability [3]. The availability of drugs given orally in the blood such as famotidine depends mainly on solubility in the gastrointestinal fluids and drugs across the permeability of membrane cell in gastrointestinal tract [4]. Drugs which have low solubility mostly show a low gastrointestinal absorption, which causes low oral bioavailability [5].
A number of methods have been developed to overcome the problem of solubility and dissolution rate including salt formation [6], micronization and microspheres [7,8], complexation
with β-cyclodextrin [9], micellization [10], and formation solid
dispersion [11,12]. Solid dispersion is defined as the dispersion of the active ingredient in an inert carrier or matrix in the solid state. In the manufacture of solid dispersion system, it is very important to understand the physicochemical properties of the drug and a suitable carrier to increase the dissolution rate of drugs [13]. Various techniques can be done to prepare solid dispersion; one of them is co-grinding [14].
Co-grinding can enhance the solubility by reducing particle size reduction and change crystalline becomes amorphous form or decreases the crystallinity degree [15]. Compared to other techniques used to increase solubility, the co-grinding technique is a simple process and friendly for environmental since it does not require organic solvents [16]. Mannitol is one carrier that can be used to prepare solid dispersion. Mannitol belongs to sugar alcohol group which has high water solubility. Moreover, mannitol has a lower toxicity that could be used as a carrier in the manufacture of solid dispersion [17].
In this study, solid dispersion of famotidine with mannitol was prepared and characterized with the aim to increase the solubility and dissolution rate of famotidine. Characterization of solid dispersions was done by scanning electron microcopy (SEM), X-ray diffraction analysis, Fourier transform infrared (FTIR) analysis, DSC analysis (DSC) analysis and particle size analysis.
MATERIALS AND METHODS Materials
Famotidine (PT SanbeFarma, Indonesia), mannitol (Merck, Germany), methanol (Merck, Germany), KH2PO4 (Bratachem, Indonesia), liquid
paraffin (Bratachem, Indonesia), and distilled water. All materials were used as received.
Preparation of solid dispersion
Famotidine and mannitol were mixed at a ratio of 1:1, 1:2, and 2:1 (w/w). The mixture was ground in Planetary Ball Mill (Fritsch, Pulverisette 7, Germany) at 500 rpm for 30, 60, and 90 minutes for each © 2017 The Authors. Published by Innovare Academic Sciences Pvt Ltd. This is an open access article under the CC BY license (http://creativecommons. org/licenses/by/4. 0/) DOI: http://dx.doi.org/10.22159/ajpcr.2017.v10i3.16112
ratio. The co-grinding powder was kept in desiccator. The formula of solid dispersion can be seen in Table 1.
Preparation of physical mixture
Physical mixture of famotidine mannitol was prepared at ratio of 1:1 (w/w). The mixture was mixed homogeneously, stored in a sealed container and kept in a desiccator.
Solubility test
An excess amount of famotidine in the samples was added to 100 mL of distilled water. Solubility test was conducted for 72 hrs in an orbital shaker at room temperature. Samples were analyzed using
UV spectrophotometer (Shimadzu UV-1700, Japan) at λmax famotidine
283 nm.
Powder X-ray diffraction analysis
Analysis of X-ray powder diffraction was performed using an X-ray diffractometer (PAN analytical PW 30/40 X-ray diffractometer, the Netherlands). Samples were placed on the sample holder and leveled to prevent particle orientation during sample preparation. The analysis
was performed at 2θ in a range 5-40°. Measurement condition was as follow: Target metals Cu, Kα filter, voltage 45 kV, and current 40 mA.
The measurement was conducted for intact famotidine, intact mannitol, physical mixture, and solid dispersion F2.
SEM analysis
The sample powder was placed on an aluminum sample holder, and the voltage was set at 10 kV and current 12 mA. Samples were then observed on various magnifications using SEM (HITACHI type S-3400N, Japan). SEM was done for intact famotidine, intact mannitol, physical mixture, and solid dispersion F2.
DSC analysis
The thermal properties of intact famotidine, intact mannitol, physical mixture, and solid dispersion of F2 were determined using a thermal analyzer (Mettler Toledo FP90, Switzerland), which has been calibrated with Indium temperature. Each sample in a small amount was placed on an aluminum pan, and the instrument temperature was set in a
range from 50°C to 250°C at 10°C per minute of heating rate.
Infrared spectroscopy analysis
The samples were measured with a PerkinElmer FTIR Spectrophotometer, where the samples absorption spectra were recorded at wave number 4000-600/cm. FTIR analysis was done for intact famotidine, intact mannitol, physical mixture, and solid dispersion F2.
Particle size analysis
Particle size analysis was conducted using an optical microscope, and about 500 particles were counted to obtain a good estimation of the particle size distribution. Particle size analysis was done for intact famotidine, physical mixture, and solid dispersion F2.
Dissolution test
Dissolution test of intact famotidine, physical mixture, and solid dispersion F2 was done in a dissolution tester (SR8 Plus Dissolution Test Station Hanson Virtual Instrument, USA) type I. The medium for dissolution test was 900 ml phosphate buffer pH 4.5. The dissolution
tester was set at temperature 37°C±0.5°C and the speed was 50 rpm.
Samples were pipetted at 5, 10, 15, 30, 45, and 60 minutes. The dissolved famotidine in medium was measured spectrophotometrically at 283 nm.
RESULT Solubility test
The solubility test was conducted by measuring the amount of famotidine dissolved in distilled water using spectrophotometer. The result of solubility test can be seen in Table 2. According to these results, the solubility of solid dispersion increased compared to intact
famotidine and physical mixture. The improvement of solubility occurred due to the grinding process by co-grinding methods that reduce the particle size and increase surface (result of particle size is shown later). Moreover, improvement solubility of solid dispersion was also contributed by a decrease of crystallinity degree (result of powder X-ray diffraction is described later).
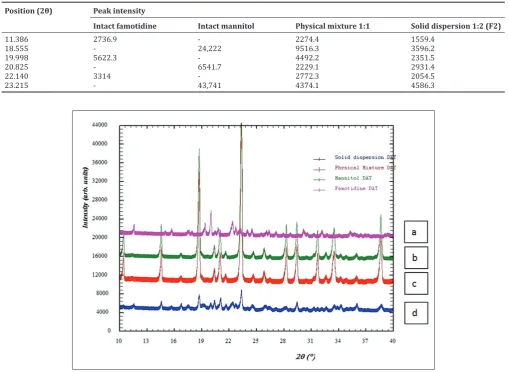
Powder X-ray diffraction
The diffractogram of intact famotidine, intact mannitol, physical mixture, and solid dispersion F2 can be seen in Fig. 1. The results of X-ray diffraction analysis showed the crystallinity of famotidine was
characterized by typical and sharp peaks at 2ϴ:11.386°, 19.998°, and 22.140°; while peaks of mannitol were at 18.555°, 20.825°, and 23.215°as shown in Table 3. Solid dispersion F2 showed the crystalline form which was a superimposition of famotidine and mannitol diffraction peaks, yet the interference peak intensity was decreased. The peak intensity of physical mixture also decreased, but not as greater as the solid dispersion F2. A decrease in the peak intensity of the interference showed the changes in the degree of crystallinity of famotidine [18].
DSC analysis
The thermal properties of intact famotidine, intact mannitol, physical mixture, and solid dispersion of F2 can be seen in thermogram Fig. 2. Famotidine showed a sharp peak and the melting point was
164.18°C, and mannitol also depicted a sharp peak with the melting point at 166.79°C. The physical mixture showed a decrease of melting point, which corresponded to famotidine melting point at 154.65°C.
Meanwhile, solid dispersion of F2 showed two endothermic peaks
at 150.59°C and 160.29°C, where these two peaks were represented
famotidine and mannitol, consecutively.
SEM analysis
The photomicrograph SEM of intact famotidine, intact mannitol, physical mixture, and solid dispersion F2 is shown in Fig. 3. The morphology of intact famotidine looked like a rod crystalline form, while the mannitol showed an irregular shaped in larger size. The physical mixture showed that famotidine stick on mannitol. In contrary, the solid dispersion depicted the smaller particles, which is due to mechanical energy from the grinding process that causes changes in
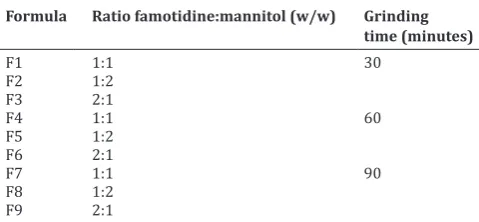
Table 1: Formulation of solid dispersion famotidine - mannitol Formula Ratio famotidine:mannitol (w/w) Grinding
time (minutes)
Table 2: Result of solubility test
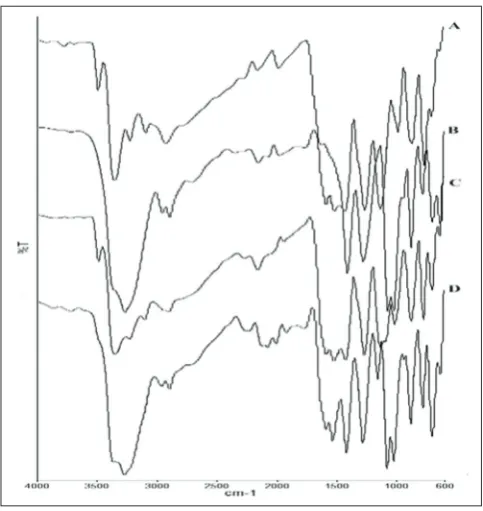
spectrum of solid dispersion showed a combination of functional groups of famotidine and mannitol. The IR spectrum did not show any new functional groups formed, which indicated a simply physical interaction between famotidine and mannitol [14].
Particle size distribution analysis
The particle size distribution was done using an optic lab microscope, and the result is shown in Fig. 5. In general, the particle size of particles was in range of 0-300 µm. The most particle size of intact famotidine and physical mixture was in range 50.1-100 µm, while the solid dispersion was in range 0-50 µm. This indicated that the particle size distribution of solid dispersion F2 was smaller than intact famotidine and physical mixture [16].
Dissolution test
The dissolution test result of intact famotidine, a physical mixture, and solid dispersion F2 is shown in Fig. 6. The percentage of intact famotidine, a physical mixture, and solid dispersion F2 dissolved after 60 minutes were 85.029%, 86.166%, and 92.057%, respectively. The dissolution of intact famotidine, physical mixture, and solid dispersion F2 showed significant differences (p<0.05). This indicated that an increase on the dissolution rate of famotidine.
DISCUSSION
The highest solubility was solid dispersion of Formula 2 (F2) at ratio of famotidine mannitol 1:2 and grinding time 30 minutes. The amount of mannitol and grinding time likely influenced the solubility of famotidine.
Table 3: Peak intensity of intact famotidine, intact mannitol, physical mixture and solid dispersion F2 Position (2θ) Peak intensity
Intact famotidine Intact mannitol Physical mixture 1:1 Solid dispersion 1:2 (F2)
11.386 2736.9 - 2274.4 1559.4
18.555 - 24,222 9516.3 3596.2
19.998 5622.3 - 4492.2 2351.5
20.825 - 6541.7 2229.1 2931.4
22.140 3314 - 2772.3 2054.5
23.215 - 43,741 4374.1 4586.3
Fig. 1: Diffractogram of (a) intact famotidine, (b) intact mannitol, (c) physical mixture, (d) solid dispersion F2
Fig. 2: Thermogram of (A) intact famotidine, (B) intact mannitol, (C) physical mixture, and (D) solid dispersion F2
the particle size [19]. This photomicrograph SEM results supported the solubility test.
FTIR analysis
Fig. 4: Fourier transform infrared spectrum of (A) intact famotidine, (B) intact mannitol, (C) physical mixture, and
(D) solid dispersion F2
Fig. 5: Particle size distribution of (▲) solid dispersion F2, (■) physical mixture, and (♦) intact famotidine
Fig. 6: Dissolution profile of (▲) solid dispersion F2, (■) physical mixture, and (♦) intact famotidine
The amount of mannitol affected the solubility due to the polarity of mannitol. In addition, mannitol is known as a hygroscopic material which tends to absorb moist from the air. Thus, the longer grinding time, the more mannitol contact in air and caused a sticky mannitol on the planetary ball mill chamber. Therefore, further characterization was done only for intact famotidine, intact mannitol, physical mixture, and solid dispersion F2.
The decrease of crystallinity impacted on the energy needed to break the crystal lattice, the lower the crystallinity, the less energy needed. Thus, solid dispersion tends to have a higher solubility [16]. Moreover, the grinding process also played a role in changing the crystal lattice of famotidine caused by mechanical energy coming from ball collision in ball mill apparatus altered the crystal peak interferences [19]. This result was in accordance with the solubility test. There was a decrease of famotidine melting point in solid dispersion F2. The decline of
melting point was anticipated as the result of diffractogram showed the reduction of peak intensity. This result was also contributed to the increasing of solubility.
The reduction of particle size was likely due to the grinding process, where mechanical energy was applied to break the particle size of famotidine. Moreover, the grinding process was likely influence the particle size of mannitol, as shown in photograph SEM previously, where famotidine was sticked on mannitol. The smaller particle size leads to the greater surface area, which impact on the higher solubility of famotidine [17]. The dissolution test is in accordance with the solubility test result, an increase in solubility and dissolution rate of famotidine formed by solid dispersion.
CONCLUSION
Solid dispersion famotidine with mannitol by co-grinding method increased both solubility and dissolution rate significantly (p<0.05) compared to intact famotidine and its physical mixture.
ACKNOWLEDGMENT
The authors would like to thank the Andalas University for the research grant No. 03/UN.16/DM/LPPM/I/2016.
REFERENCES
1. Smith JL, Gamal MA, Chremos AN, Graham DY. Famotidine, a new H2-receptor antagonist. Effect on parietal, nonparietal, and pepsin secretion in man. Dig Dis Sci 1985;30(4):308-12.
2. Dammann HG, Müller P, Simon B. 24 hour intragastric acidity and single night-time dose of three H-2-blockers. Lancet 1983;2(8358):1078. 3. Fernandes NC, Jagdale SC, Chabukswar AR, Kuchekar BS.
Superdisintegrants effect on three model drugs from different BCS classes. Res J Pharm Tech 2009;2(2):335-7.
4. Fahmy RH, Kassem MA. Enhancement of famotidine dissolution rate through liquisolid tablets formulation: In vitro and in vivo evaluation.
Fig. 3: Scanning electron microscopy at magnification ×500 of (a) intact famotidine, (b) intact mannitol, (c) physical mixture,
and (d) solid dispersion F2
a b
Eur J Pharm Biopharm 2008;69(3):993-1003.
5. Lipinski CA, Lombardo F, Dominy BW, Feeney PJ. Experimental and computational approaches to estimate solubility and permeability in drug discovery and development settings. Adv Drug Deliv Rev 2001;46(1-3):3-26.
6. Serajuddin AT. Salt formation to improve drug solubility. Adv Drug Deliv Rev 2007;59(7):603-16.
7. Rasenack N, Müller BW. Dissolution rate enhancement by
in situ micronization of poorly water-soluble drugs. Pharm Res 2002;19(12):1894-900.
8. Gupta R, Prajapati SK, Pattnaik S. Performance and evaluation of floating microspheres of famotidine and comparison of their physical properties. Int J Pharm Pharm Sci 2012;4 Suppl 5:376-82.
9. Octavia MD, Halim A, Zaini E. Preparation of simvastatin-β
cyclodextrin inclusion complexes using co-evaporation technique. J Chem Pharm Res 2015;7(2):740-7.
10. Rangel-Yagui CO, Pessoa A Jr, Tavares LC. Micellarsolubilization of drugs. J Pharm Pharm Sci 2005;8(2):147-63.
11. Salman, Ardiansyah, Nasrul E, Rivai H, Ben ES, Zaini E. Physicochemical characterization of amorphous solid dispersion of ketoprofen-polyvinylpyrorolidone K-30. Int J Pharm Pharm Sci 2014;7(2):209-12.
12. Kalia A, Poddar M. Solid dispersions: An approach towards enhancing
dissolution rate. Int J Pharm Pharm Sci 2011;3(4):9-19.
13. Leuner C, Dressman J. Improving drug solubility for oral delivery using solid dispersions. Eur J Pharm Biopharm 2000;50(1):47-60.
14. Yang C, Xu X, Wang J, An Z. Use of the co-grinding method to enhance the dissolution behavior of a poorly water-soluble drug: Generation of solvent-free drug-polymer solid dispersions. Chem Pharm Bull (Tokyo) 2012;60(7):837-45.
15. Chono S, Takeda E, Seki T, Morimoto K. Enhancement of the dissolution rate and gastrointestinal absorption of pranlukast as a model poorly water-soluble drug by grinding with gelatin. Int J Pharm 2008;347(1-2):71-8.
16. Zhong L, Zhu X, Luo X, Su W. Dissolution properties and physical characterization of telmisartan-chitosan solid dispersions prepared by mechanochemical activation. AAPS PharmSciTech 2013;14(2):541-50. 17. Nassab PR, Rajkó R, Szabó-Révész P. Physicochemical characterization of meloxicam-mannitol binary systems. J Pharm Biomed Anal 2006;41(4):1191-7.
18. Zaini E, Witarsah AS, Agustin R. Enhancement of dissolution rate of meloxicam by co-grinding technique using hydroxypropyl methylcellulose. J Chem Pharm Res 2014;6(11):263-7.