COMPARING FLUORIDE REMOVAL KINETICS OF ADSORPTION PROCESS FROM AQUEOUS
SOLUTION BY BIOSORBENTS
TEJ PRATAP SINGH, MAJUMDER CB*
Department of Chemical Engineering, IIT Roorkee, Roorkee - 247 667, Uttarakhand, India. Email: [email protected] Received: 16 March 2016, Revised and Accepted: 24 March 2016
ABSTRACT
Objective: In this study, we observed the defluoridation capacity of groundnut shell and Citrus limetta (commonly known as sweet lime) and aims at comparison of their defluoridation capacity.
Methods: Batch experiments were carried out for this investigation. To find out the best operating conditions for maximum fluoride removal, we varied the contact time by keeping others parameters to be constant and observed their effects on defluoridation capacity. In this study to follow adsorption process, we used various kinetic models, namely, Elovich equation, Weber and Morris intra-particle diffusion model, Bangham’s pore diffusion model, and the pseudo first and second order equations. We also calculated and discussed the effects of various kinetic parameters such as correlation coefficients, equilibrium adsorption capacities and rate constant.
Results: The hand-in-hand relationship between intra-particle diffusion model and Elovich equation indicates a major role of pore diffusion process in adsorption mechanism. Furthermore, the rate kinetics is best described by pseudo second order model for both the biosorbents.
Conclusion: From the performed experiments, it was found that Citrus limetta peel has more defluoridation capacity in comparison of groundnut shell in all manners.
Keywords: Adsorption kinetics, Adsorption, Biosorbent, Ground nut shell, Citrus limetta peel.
INTRODUCTION
Our earth is called blue planet due to the presence of water in vast amount in forms of sea, oceans, glaciers, etc. Around 71% of earth is covered with water. Of that total water on the surface of earth only 2.5% is available as freshwater which can be consumed by human body. Of that 2.5% of freshwater most of water is in the form of ice and groundwater. Less than 0.3% of all freshwater is in rivers, lakes, atmosphere, and an even smaller amount of the Earth’s freshwater (0.003%) is contained within biological bodies and manufactured products [1]. Hence, there arises a need to save our water as despite being blue planet very little water is available which can be utilized in daily life for different activities.
Freshwater is often polluted by different sources, so there is an acute need to find out source of these pollutants and find remedy by which they can be cured. One of the major pollutants in world is fluoride. Today a larger part of world is suffering from health problems caused by fluoride. Although fluoride is necessary for our body as it is beneficial for bones and teeth, the required amount is in ppm and if this limit is exceed it affects health of that living being. Fluorine is equally important for animals and plants but in their cases too if limit is exceeding it will cause adverse effect on them. Maximum Permissible limit of fluoride in consumable water is 1.5 mg/L [2]. Fluoride is responsible for the strong bones and teeth but when the level of fluoride is exceeded certain amount in our body it leads to very serious diseases such as dental and skeletal fluorosis. Fluoride possesses high potential to cause damage not only to the human body but also on plants. Fluoride is not decomposed by any bacteria or living organisms, so once it comes in the chain of environment it is accumulated [3]. More than 25 nations of the world including India suffer from the contamination of fluoride in drinking water. Orissa is one of the states where 10 out of the 30 districts are suffering from fluoride contamination.
METHODS
In this study, we collected two biosorbents groundnut shell and Citrus limetta peel (commonly known as sweet lime) from local fruit stall in old market, Roorkee, India. These were chosen as they are natural and
cost efficient biosorbent. To make them ready for the process, they were washed thoroughly with normal tap water to remove dirt sticking on the surface of them. After which they were dried in a hot air oven at 100-120°C for 24 h after which in jaw crusher dried material is crushed and screened in 50 µm mesh ASTM.
Preparation of stock solution
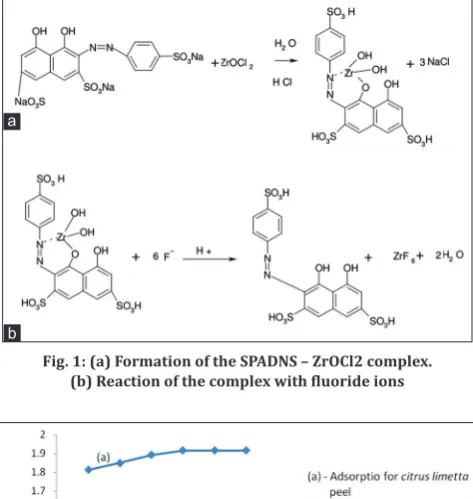
The 100 mg/L fluoride stock solution was prepared by mixing 0.221 g of anhydrous sodium fluoride in 1 L of millipore water. The 20 mg/L fluoride concentration test solution was prepared from stock solution which is the normal fluoride concentration in industrial waste water. All the experiments were carried out in 250 ml round bottom flasks, with 50 ml test solution in a conical flask at 29±1°C in horizontal incubator shaker. At the end of desired contact time, the conical flask was removed from the shaker. Subsequently, samples were filtered using Whatman no. 42 filter paper and filtrate was analyzed for residual fluoride concentration by SPADNS method, described in the standard method of examination of wastewater and water [4]. Fig. 1 shows various reactions involved in the SPANDS method for estimation of fluoride.
Reactions involved in the SPADNS method for estimation of fluoride Recipe for SPADNS solution:
A represents fluoride obtained by curve (mg) B represents diluted sample final volume (ml)
C represents diluted sample volume worn for development of color.
Where:
A0 represents absorbance at zero fluoride concentration A1 represents absorbance at fluoride concentration of 1 mg/L Ax represents absorbance of the sample prepared.
RESULTS AND DISCUSSIONS Contact time
In this section, we discussed the effect of contact time on adsorption capacity. To understand this better a graph has been plotted between contact time and adsorption capacity which is shown in Fig. 2. From the graph, there is clear indication that with increase in time, there is an increase in adsorption by these biosorbents in starting phase but once they reach equilibrium it remains more or less constant. In a study by other researchers, similar trend was observed when they used protonated chitosan beads [5]. When Biosorbents reach saturation, that time is called their optimum contact time. For Citrus limetta peel and groundnut shell optimum contact time was noted to be 40 and 60 minutes, respectively.
Adsorption kinetics
To determine best kinetic model, we do use squared sum of errors (SSE) values. It is assumed that model which provides the lowest value of SSE is best model for that system [5,6]. To calculate SSE values, the following formula were used:
Where: qe(expt) and qe(cal) denotes the experimental sorption capacity of fluoride (mg/g) at equilibrium time and the corresponding value that were obtained from the kinetic models. In this study five simplified kinetic models namely Elovich equation, Weber and Morris intra-particle diffusion model, Bangham’s pore diffusion model, and the pseudo first and second order equations have been discussed to identify the rate and kinetics of sorption of fluoride onto Citrus limetta peel and groundnut shell.
Elovich equation
The Elovich equation is represented in the following manner in the mathematical form [7]:
α - Initial sorption rate in mg/g min
β - Extent of surface coverage and activation energy for chemisorptions.
In the present scenario, when we plotted a graph between qt versus ln (t) as shown in Fig. 3, it tends to follow Elovich equation. With the confirmation that Elovich equation is followed, we can now say that diffusion is the rate determining step [8]. It should be also noted that while applying this equation we ignored the desorption rate [9]. The kinetic curve of sorption demonstrated good fitting with the model (r2>0.9) which may indicate the diffusion rate-limiting is more prominent in fluoride sorption by Citrus limetta peel and groundnut shell. Table 1 shows various parameters obtained by applying Elovich equation to obtained data.
Weber and morris intra-particle diffusion model
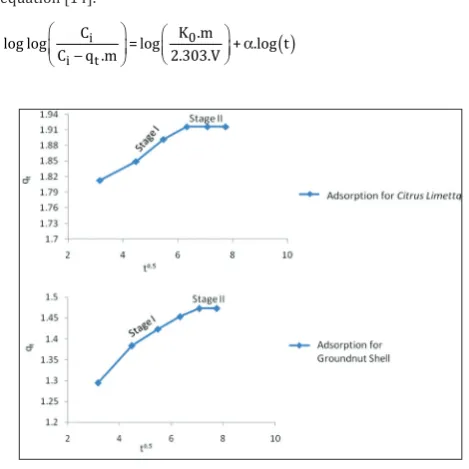
Rate of sorption is frequently used to analyze nature of the “rate-controlling step,” and the use of the intra-particle diffusion model has been greatly explored in this regard which is represented by the following Weber and Morris equation [10].
qt=kip*t0.5+C
Where, C is the intercept, determined by the thickness of the boundary layer and kipis the intra-particle diffusion rate constant. According to
this model, if adsorption of a solute is controlled by the intra-particle diffusion process, a plot of qt versus t0.5 gives a straight line. Weber and Morris plots of qt versus t0.5 are shown in Fig. 4a and b for, Citrus limetta peel and groundnut shell, respectively. It is evident from the plots that there are two separate stages; first linear portion (Stage I) and second curved path followed by a plateau (Stage II). In Stage I, nearly 50% of fluoride was rapidly taken up by biosorbents within 5 minutes. This is attributed to the immediate utilization of the most readily available adsorbing sites on the adsorbent surfaces. In Stage II, very slow diffusion of adsorbate from surface site into the inner pores is observed. Thus, initial portion of fluoride adsorption by carbon adsorbents may be governed by the initial intra-particle transport of fluoride controlled by surface diffusion process and later part is controlled by pore diffusion. Similar dual nature with initial linear and then plateau were found in the literature [11].
Fig. 2: Effect of contact time on adsorption of fluoride on Citrus
limetta and groundnut shell
Fig. 3: Elovich equation plots of Citrus limetta and groundnut shell Fig. 1: (a) Formation of the SPADNS – ZrOCl2 complex.
(b) Reaction of the complex with fluoride ions
where:
Ci - Initial concentration of the adsorbate in a solution (mg/L) V - Volume of solution in (ml)
m - Mass of the adsorbent (g/L)
qt - Amount of adsorbate retained at time t (mg/g) K0 – Constant
A graph has been plotted between log log C
C q .m
shown in Fig. 5 for Citrus limetta peel and groundnut shell. The plot was found to be linear for adsorbent with correlation coefficient indicating that kinetics confirmed Bangham’s equation, and therefore, the adsorption of fluoride onto Citrus limetta peel and groundnut shell was pore diffusion controlled. A similar trend was observed in the literature for the adsorption of fluoride onto waste carbon slurry. Table 3 shows various parameters obtained by applying Bangham’s Pore Diffusion model to obtained data.
Pseudo first order model
The Lagergren’s rate equation is one of the most widely used rate equation to describe the adsorption of adsorbate from the liquid phase [10,13]. The linear form of pseudo first-order rate expression of Lagergren is given as follows:
log q q = log q k t
2.303
e− t e − 1
(
)
( )
where:
qe - Amounts of fluoride adsorbed on adsorbent (mg/g) at equilibrium qt - Amounts of fluoride adsorbed on adsorbent (mg/g) at time t(min) k1 - Rate constant of pseudo first-order kinetics.
Fig. 6 shows the plots of linearized form of pseudo first-order kinetic model for the two biosorbents. The plots were found linear with good correlation coefficients (>0.9) indicating the applicability of pseudo first-order model in this study. The pseudo first-order rate constant (k1) and qe(cal.) values were determined for each adsorbent from the slope and the intercept of corresponding plot and are listed in Table 4.
Pseudo second order model
The adsorption kinetics was also described as pseudo-second order process using the following equation [15],
Although intra-particle diffusion renders straight lines with correlation coefficient more than 0.98 for both the biosorbents, the intercept of the line fails to pass through the origin in each case. This can be explained by difference in the rate of mass transfer in the initial and final stages of adsorption [12] and indicates some degree of boundary layer control which implies that intra-particle diffusion is not only rate controlling step [13]. The data were further used to learn about the slow step occurring in the present adsorption system using pore diffusion model. Table 2 shows various parameters obtained by applying Weber and Morris intra-particle diffusion model to obtained data.
Bangham’s pore diffusion model
Bangham’s model adsorption process is described by Bangham’s model equation [14].
Table 1: Various parameters obtained for different biosorbents Name of
adsorbent Elovich equationβ q
e(expt) (mg/g) qe(cal) (mg/g) R2 α SSE
Citrus limetta peel 15.873 1.915 0.4708 0.9671 0.0693 0.5687
Groundnut shell 12.3915 1.15 0.669 0.9931 0.0893 0.1749
SSE: Squared sum of errors
Table 2: Various parameters obtained for different biosorbents Name of
adsorbent Intra particle diffusionk
id (mg/g.min−0.5) qe(expt)(mg/g) qe(cal)(mg/g) R2 SSE
Citrus limetta peel 0.027 1.915 1.7272 0.9366 0.0096
Groundnut shell 0.0259 1.15 0.9184 0.9298 0.0405
SSE: Squared sum of errors
Table 3: Various parameters obtained for different biosorbents Name of
adsorbent Bangham’s pore diffusion modelk
0 qe(expt)(mg/g) qe(cal)(mg/g) R2 α SSE
Citrus limetta peel 11.595 1.915 1.806 0.851 0.002 0.00324
Groundnut shell 5.371 1.15 1.145 0.999 0.018 0.000018
SSE: Squared sum of errors
Fig. 4: (a) Intra particle diffusion plot for Citrus limetta peel. (b) Intra particle diffusion plot for groundnut shell
Fig. 5: Pore diffusion plot of Citrus limetta peel and groundnut shell
Fig. 6: Kinetic modeling of adsorption of fluoride onto Citrus
limetta peel and groundnut shell (pseudo first order)
Fig. 7: Kinetic modeling of adsorption of fluoride onto Citrus
limetta and groundnut shell (pseudo second order)
Table 5: Various parameters obtained for different biosorbents
Name of
adsorbent Pseudo second orderk
2 (1/min) qe(expt)(mg/g) qe(cal)(mg/g) R2 SSE
Citrus limetta peel 0.67832 1.915 1.942 0.9999 0.00019
Ground nut shell 0.3325 1.15 1.1750 0.9999 0.00047
SSE: Squared sum of errors
t
q =
1 K q
+ t q
t 2 e2 e
where:
qe - Amounts of fluoride adsorbed on adsorbent (mg/g) at equilibrium qt - Amounts of fluoride adsorbed on adsorbent (mg/g) at time t (min) k2 - Rate constant of pseudo second-order kinetics.
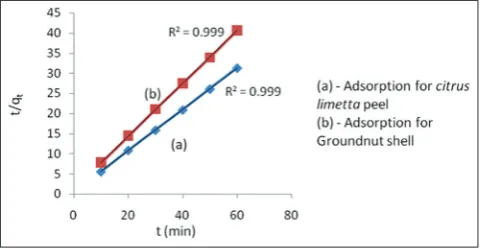
The plots of t/qt versus t for the three adsorbents are shown in Fig. 7. The values of qe(cal.) and k2 were determined for each adsorbent from the slope and intercept of the corresponding plot and are compiled in Table 5.
The correlation coefficient (r2) values for pseudo second-order adsorption model have high values, i.e., 0.999 for both biosorbents. Comparatively in each case, the r2 value is higher than that of pseudo first-order model. The lower SSE values for pseudo second order model also indicate that the adsorption kinetics of fluoride onto Citrus limetta peel and Groundnut Shell can be better described by pseudo second order model. A similar phenomenon has observed by others for the adsorption of fluoride on various adsorbents [16-18].
CONCLUSION
By fitting of the kinetic data, the dynamics of sorption could be better described by Pseudo second order model indicating the rate limiting step to be chemisorptive in nature for both the biosorbents such as Citrus limetta peel and the groundnut shell. And in between biosorbents Citrus limetta peel shows a better defluoridation in comparison of the groundnut shell. The kinetic models such as intra-particle diffusion model and Elovich equation indicates a major role of pore diffusion process in adsorption mechanism.
REFERENCES
1. Gleick PH, editor. Water in Crisis: A Guide to the World’s Freshwater Resources. New York: Oxford University Press; 1993. p. 13.
2. WHO. Fluoride and Human Heath. Series 59. Geneva: WHO; 1970. 3. Singh TP, Bhatnagar J, Majumder CB. Defluoridation of industrial
wastewater using eichhornia crassipes. Int J Sci Eng Technol 2015;3:753-6.
4. Hichour M, Persin F, Sandeaux J, Gavach C. Water defluoridation by donann dialysis and electro dialysis. Sep Purif Technol 2000;18:1-11. 5. Eaton AD, Clesceri LS, Greenberg AE, Franson MA. Standard Methods
for the Examination of Water and Waste Water. APHA, AWWA, WWF. Washington, DC: American Public Health Association; 1995. 6. Viswanathan N, Sundaram CS, Meenakshi S. Removal of fluoride from
aqueous solution using protonated chitosan beads. J Hazard Mater 2009;161:423-30.
Table 4: Various parameters obtained for different biosorbents Name of
adsorbent Pseudo first orderk
1 (1/min) qe(expt)(mg/g) qe(cal)(mg/g) R2 SSE
Citrus limetta peel 0.3915 1.915 0.3221 0.9978 0.6832
Groundnut shell 0.04145 1.15 0.27415 0.9884 0.58
7. Aharoni C, Ungarish M. Kinetics of activated chemisorption. Part 2: Theoretical models. J Chem Soc Faraday Trans 1977;73:456-64. 8. Pavlatou A, Polyzopolus NA. The role of diffusion in the kinetics of
phosphate desorption: The relevance of the Elovich equation. Eur J Soil Sci 1988;39425-36.
9. Rudzinksi W, Panczyk P. In: Schwarz JA, Contescu CI, editors. Surfaces of Nanoparticles and Porous Materials. New York: Dekker; 1998. p. 355.
10. Ho YS, Ng JC, McKay G. Kinetics of pollutant sorption by biosorbents: Review. Separation Purif Methods 2000;29:189.
11. Liao XP, Shi B. Adsorption of fluoride on zirconium(IV)-impregnated collagen fiber. Enviorn Sci Technol 2005;39:4628-32.
12. Kumar E, Bhatnagar A, Ji M, Jung W, Lee SH, Kim SJ, et al. Defluoridation from aqueous solutions by granular ferric hydroxide
(GFH). Water Res 2009;43(2):490-8.
13. Meenakshi S, Vishwanathan N. Identification of selective ion-exchange resin for fluoride sorption. J Colloid Interface Sci 2007;308(2):438-50. 14. Pandya KK, Prasad G, Singh VN. Mixed adsorbent for Cu(II) removal
from aqueous solutions. Enviorn Technol Lett 1986;50(7):547-4. 15. Lagergran S. About the theory of so-called adsorbtion of soluble
substances. Vetenskapsakad Handl 1898;24(4):1-39.
16. Weber WJ, Morris JC. Kinetics of adsorption on carbon from solution. J Sanit Eng Div 1963;89(2):31-60.
17. Simons R. Trace-element removal from ash dam waters by nanofiltrationand diffusion dialysis. Desalination 1993;89:325-41. 18. Sivasamy A, Singh KP, Mohan D, Maruthamuthu M. Studies on