A SIMPLE REVERSE PHASE-HIGH-PERFORMANCE LIQUID CHROMATOGRAPHY
METHOD DEVELOPMENT AND VALIDATION OF VALSARTAN IN BULK AND IT’S TABLET
DOSAGE FORM
RAMREDDY GODELA
1*, SHERISHA BHAVANI
21Department of Pharmaceutical Analysis, MLR Institute of Pharmacy, Dundigal, Hyderabad, India. 2Department of Pharmaceutical
Chemistry, Baskara College of Pharmacy, Moinabad, Hyderabad, India. Email: [email protected]
Received: 15 July 2017, Revised and Accepted: 15 September 2017
ABSTRACT
Objective: The most important objective of the present research work is to develop simple, specific, rapid, accurate, and sensitive reverse-phase high-performance liquid chromatography method and validated for the qualitative and quantitative determination of valsartan in its active pharmaceutical ingredient and tablet dosage form according to ICH guidelines.
Proposed Method: An isocratic separation was done using Phenomenex C18 column possess 75×4.6 mm, 2.6 µ,100 A0 dimensions with mobile phase composition of water:acetonitrile (30:70% v/v) by maintaining 1 ml/minute flow rate and response detected at a wavelength of 247 nm.
Results: The retention time of valsartan was found to be 2.71 minutes, limit of detection and limit of quantification were observed at 1.24 µg/ml and 3.6 µg/ml concentration, respectively, and a calibration curve was linear in the concentration range of 5-50 μg/ml with coefficient of correlation 0.99. The percentage recovery (accuracy) was in the range of 98.9-102%, and the % relative standard deviation was observed to be <2%.
Conclusion: The proposed method was validated for accuracy, precision, sensitivity, linearity, and robustness and successfully employed for the quantitative determination of valsartan in tablet dosage form in quality control department of pharmaceutical industry.
Keywords: Reverse-phase-high-performance liquid chromatography, Retention time, Limit of detection, Limit of quantification, Robustness.
INTRODUCTION
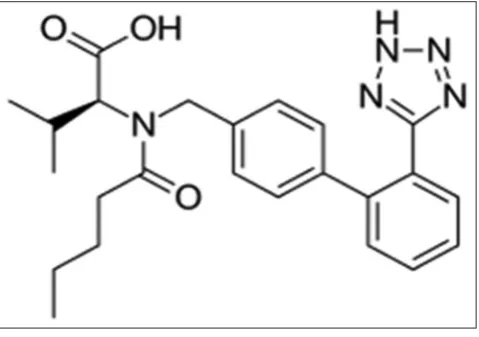
Valsartan (2S)-3-methyl-2-[pentanoyl-[[4-[2-(2H-tetrazol-5-yl) phenyl] phenyl] methyl] amino] butanoicacid (Fig. 1) is a angiotensin II receptor antagonist used in the treatment of hypertension. It works by relaxing the blood vessels. The blood vessels to lower blood pressure.
Literature survey revealed that various analytical methods have been used for the qualitative and quantitative estimation of valsartan in bulk and pharmaceutical dosage forms using ultraviolet (UV)-visible spectroscopy [1,2], high-performance thin-layer chromatography [3], and reverse phase-high-performance liquid chromatography (RP-HPLC) [4-7]. Extensive literature survey reveals
that there is no RP-HPLC method with less retention time with simple mobile phase system was not reported for quantitative estimation of valsartan in bulk drugs and pharmaceutical dosage forms.
The objective of the present research work was to develop and validate simple, precise, and accurate analytical method with less retention time and simple solvent system for the estimation of valsartan in bulk and commercially available tablets in routine analysis. Chromatographic analysis is the most popular method for the analysis of most of the formulations; hence, a new RP- HPLC method was developed and validated for the estimation of valsartan.
METHODS
The valsartan reference standard (claim 99.18%) was provided by Aizant pharma. Tablets of valsartan (VALZAAR-40 mg) were purchased from a local pharmacy. HPLC grade acetonitrile was obtained from Merck India Limited, Mumbai, India. All the glass wares used were made of Borosilicate glass, and the solvents and prepared solutions were filtered through Nylon (0.45 µm) filters.
Chromatography
RP-HPLC method [8] was performed with Cyberlab HPLC equipment with UV detector and manual injector with a 20 µL loop. The equipment was connected to a multi-instrument data acquisition and data processing system (LC-solution software). The chromatographic system was performed using C18 (250 × 4.6 mm, 2.6 µ, 100 A0) column. Separation was achieved using a mobile phase consisting of acetonitrile:water (70:30 v/v) at a flow rate of 1 ml/minute. The eluent was monitored using UV detection at a wavelength of 247 nm. The column temperature was maintained at 28°C, and the injection volume 10 µL was used. The mobile phase was filtered through a 0.45 μm nylon filter before use.
Research Article
Fig. 1: Structure of valsartan
Determination of absorption maxima by UV-visible spectrophotometer
Weigh accurately 20 mg of valsartan, transfer into 100 ml of volumetric flasks, add 60ml of diluent, sonicate to dissolve, and make up to the volume with diluent. Pipette out 10 ml of this solution into 100 ml of volumetric flask dilute to the volume with diluents, concentration of the valsartan was found to be 20 µg/ml. The solution was scanned in the range of 200-400 nm, and from the spectrum, the ƛmax was found to be 247 nm, resulted spectrum was shown in Fig. 2.
Preparation of standard solution
Weigh accurately 20 mg of valsartan and transfer into 100 ml of volumetric flasks, add 60 ml of diluent, sonicate to dissolve, and make up to the volume with diluent. Pipette out 10 ml of this solution into 100 ml of volumetric flask dilute to the volume with diluents, the concentration of the valsartan was found to be 20 µg/ml.
Preparation of sample solution
Weigh and transfer powder equivalent to 20 mg of valsartan into 100 ml volumetric flask, add 60 ml of diluent and sonicate for 15 minutes and diluted to the volume with diluent, filter the solution through 0.45 µm nylon filter. Pipette out 1 ml of this solution into 100 ml volumetric flask and diluted to the volume with diluent to get the concentration about 20 µg/ml.
Assay of the given sample preparation is calculated using following formula.
× × × × ×
AT WS DT P AVGWt
Assay%= 100
AS DS WT 100 Lable claim
Where:
AT = Peak area of obtained with test preparation AS = Peak area of obtained with standard preparation WS = Weight of working standard taken in mg WT = Weight of sample taken in mg
DS = Dilution of standard solution DT = Dilution of sample solution
P = Percentage purity of working standard.
Method validation
Validation is establishing documented evidence, which provides a high degree of assurance that a specific process will consistently produce a product meeting its predetermined specifications and quality characteristics.
System suitability test
Test for system suitability was performed by injecting blank solution once and standard solution of 100% test concentration (prepared as per the assay method) for 6 times into HPLC system. The system suitability was established by evaluating the system suitability parameters from the chromatograms thus obtained. Typical system suitability parameters include % relative standard deviation (RSD), tailing factor (T), and theoretical plates (N).
Linearity
The linearity of an analytical method aims to elicit whether the test result is directly proportional to concentration. This is well understood by plotting a graph with peak area versus concentration. The linearity of the drug was established by constructing the calibration curve with a concentration on X-axis and absorbance on Y-axis over a concentration range of 5 µg/ml-50 µg/ml.
ACCURACY
The accuracy of the method was determined by performing recovery studies which were carried out by standard addition method at three different levels (80%, 100%, and 120%). A known amount of valasartan added separately to pre-analyzed samples, and percent recoveries were calculated at each level.
Precision
Intraday precision was determined by analyzing valsartan for 3 times in the same day (intraday). Interday precision was determined by analyzing valsartan daily for 3 days, and % RSD was calculated.
Sensitivity (limit of detection [LOD] and limit of quantification [LOQ])
LOD is defined as the lowest amount of an analyte that can reliably be differentiated from background levels. LOQ of an analytical procedure is the lowest amount of analyte that can be quantitatively determined with suitable precision and accuracy. LOD and LOQ were calculated using following equation as per the ICH guidelines.
LOD = 3.3×σ/S
LOQ = 10×σ/S
Where,
σ is the standard deviation of y-intercepts of regression lines
S is the slope of the calibration curve.
Fig. 2: Ultraviolet spectrum of valsartan showing absorption maxima of 247 nm
Table 1: Results of system suitability test for valsartan 20 µg/ml
Injection Retention time
(minute) Peak area µV x seconds USP plate count (N) Acceptance limit (N) USP tailing factor (T) Acceptance limit (T)
1 2.71 13235 6532 N should be >2000 1.12 T should be ≤2
2 2.7 12960 5532 1.08
Robustness
Robustness of an analytical procedure was performed by slightly changing the mobile phase composition and flow rate.
RESULTS
Initially, the solubility of valsartan was checked in various solvents. The drug was found to be soluble in methanol, acetonitrile, and water. From the UV spectrum, it was observed that maximum absorbance of valsartan was shown at 247 nm.
Method optimization
Optimization of the chromatographic conditions was carried out by running several trials to obtain retention time, peak symmetry, plate count, and relative standard deviation within the limits and possible optimal. After several trials, a method using mobile phase composition of acetonitrile and water in the ratio of 70:30 at a flow rate of 1 ml/minute, on Phenomenex C18 (250×4.6 mm, 2.6 µ,100 A0) column at 247 nm, was found to be the most suitable and acceptable. The optimized method resulted in chromatogram with valsartan eluting at 2.71 minutes (Fig. 3) with a tailing factor of 1.09 and USP plate count of 5955.
Method validation
The proposed method was validated according to Q2 specifications of the ICH guidelines [9].
System suitability
The system suitability was established by assessing the system suitability parameters from the chromatograms thus obtained. Typical system suitability parameters include % RSD, tailing factor (T), and theoretical plates (N). All the parameters measured values (Table 1) were satisfying the acceptance criteria.
Linearity
The linearity of detector response was determined by preparing a series of solution of the working standards over the range of 5-50 µg/ml of concentration. These solutions were injected onto the chromatographic system, and response area was recorded. A calibration curve was constructed by plotting area against concentration, and regression equation was computed. R2 value of linearity curve was 0.999, plots with values were shown in Fig. 4 and Table 2.
Accuracy
The percentage recovery of drug from the spiked sample solutions was found to be in the range of 98.3-102% (Table 3) which indicates that the accuracy of the proposed analytical method was within the acceptance criteria of the ICH guidelines.
Precision
Variation of results of the concentration (20 µg/ml) within the same day (intraday) and variation of results concentrations (5-50 µg/ml) between days (inter-day) were analyzed.% RSD of peak area values of valsartan working standard solutions was found to be in the range of 1.8% and 0.50-1.57%, for intra- and inter-day precision, respectively. The low values of (≤2) these statistical parameters represent the method with good precision (Tables 4 and 5).
Sensitivity and robustness
LOD and LOQ were found to be 1.24 µg/ml and 3.6 µg/ml, which indicate the method has good sensitivity. The % RSD values were below 2.0% by
Fig. 3. Optimized chromatogram of valsartan
Fig. 4: Calibration curve of valsartan
Fig. 5: Chromatograms of standard solution of valsartan
Fig. 6: Chromatograms of test (tablet) solution of valsartan Table 2: Peak areas of linearity standard solution of valsartan
Concentration (µg/ml) Peak area
5 2903
10 6872
20 13235
30 19471
40 26312
50 32230
Assay
Percentage purity of the tablet dosage form was done by injecting the 20 µg/ml standard solution and a sample solution equivalent to 20 µg/ml valsartan. The percentage purity of valsartan in tablet dosage form was found to be 99.7% based on the data showed in (Figs. 4 and 5, Table 7).
× × × × × × × =
13241 20 10 100 100 99.1 81 100 99.7%
12997 100 100 41 10 100 40
DISCUSSION
The RP-HPLC assay method plays a vital role in both qualitative and quantitative analysis of drug in its pure and tablet dosage. Till date,
many RP-HPLC methods have been developed for qualitative and quantitative analysis of valsartan. However, the retention times in the reported studies were in a range 7-4 minutes [5-7], and the method with high retention time could not be treated as economical as it requires more amount of solvents and needs to be run for long time. If the retention time could be reduced solvent consumption and runtime for sample analysis can be lowered, hence rapid analysis of more number samples can be done. In previously reported methods, very expensive solvents such as glacial acetic acid and buffers were used and more effective linearity range could not be accomplished. In the present study, RP-HPLC method with retention time of 2.7 minutes was observed by a simple mobile phase composition of acetonitrile:water (70:30), better accuracy and huge linearity range of 5-50 µg/ml was attained with this simple mobile phase composition disclose the
Table 3: % Recovery data for valsartan
% Level Amount added (µg/ml) Standard solution peak area Spiked average peak area % Recovery Acceptance limit
50 10 6772 6654 98.3 ±2%
100 20 13762 14103 102
150 30 19570 19756 99
Table 4: Results of intraday precision
Number of injections (20 µg/ml) Peak area
Injection-1 13205
Injection-2 12960
Injection-3 12901
Injection-4 13506
Injection-5 13032
Injection-6 12837
Mean* 13073.5
SD 246.8366
% RSD 1.888068
*Average of three determinations. RSD: Relative standard deviation, SD: Standard deviation
Table 5: Results of intraday precision
Concentration (µg/ml) Day-1 Day-2 Day-3 Mean* SD % RSD
5 2903 2953 2863 2906.333 45.0925 1.551525
10 6872 6772 6812 6818.667 50.33223 0.738154
20 13235 13362 13207 13268 82.60145 0.622561
30 19270 19445 19281 19332 98.0153 0.507011
40 26312 26230 26991 26511 417.7092 1.575607
50 32230 33230 32730 32730 500 1.52765
*Average of three determinations. RSD: Relative standard deviation, SD: Standard deviation
Table 6: Results of robustness
Variation of parameter System suitability parameters
Retention time (minutes) % RSD USP tailing factor USP plate count
Mobile phase ratio (±1) water:acetonitrile
29:71 2.70 0.65 1.12 4589
30:70 2.71 0.54 1.04 6823
31:69 2.69 0.63 1.10 3561
Flow rate (±0.1 ml)
1.1 2.70 0.59 1.04 5423
1.0 2.70 0.91 1.04 2963
0.9 2.71 0.72 1.06 4327
Table 7: System suitability parameters of valsartan (standard and test) in assay method
Peak name Retention time Peak area % Area USP tailing USP plate count
cost-effectiveness of the method as compared to previously reported methods. The statistical results of the validated parameters within the limits stated by international conference on harmonization of technical requirements for registration of pharmaceuticals for human use. Compared to previously reported methods, the proposed method has a great advantage in terms of retention time, linearity, and sensitivity, and hence, this method could be used for better qualitative and quantitative analysis of valsartan.
CONCLUSION
The isocratic HPLC method was developed for the study of valsartan in pharmaceutical dosage form. The validated method is very rapid, accurate, and precise. Moreover, it has advantages of short runtime and the possibility of analysis of a large number of samples, both of which significantly reduce the analysis time per sample. Hence, this method can be conveniently used for routine quality control analysis of valsartan in its pure and tablet dosage forms.
REFERENCES
1. Satana E, Altınay S, Goger NG, Ozkan SA, Senturk Z. Simultaneous determination of Valsartan and hydrochlorthiazide in tablets by
first-derivative ultraviolet spectrophotometry and LC. J Pharm Biomed Anal 2001;25(5-6):1009-13.
2. Tatar S, Saglík S. Comparison of UV-and second derivative-spectrophotometric and LC methods for the determination of valsartan in pharmaceutical formulation. J Pharm Biomed Anal 2002;30(2):371-5. 3. Shah NJ, Suhagia BN, Shah RR, Patel NM. HPTLC Method for the
simultaneous estimation of valsartan and hydrochlorothiazide in tablet dosage form. Indian J Pharm Sci 2009;71(1):72-4.
4. Vinzuda DU, Sailor GU, Sheth N. R RP-HPLC method for determination of valsartan in tablet dosage form. Int J ChemTech Res 2010;2(3):1461-7.
5. Imam SS, Ahad A, Aqil M, Sultana Y, Ali A. A validated RP-HPLC method for simultaneous determination of propranolol and valsartan in bulk drug and gel formulation. J Pharm Bioallied Sci 2013;5(1):61-5. 6. Sharma T, Chandra SI. A validated gradient stability indicating LC
method for the analysis of valsartan in pharmaceutical dosage form. Int J Pharm Pharm Sci 2016;8(9):128-33.
7. Pradhan KK, Mishrab US. Development and validation of a stability indicating rp-hplc method for the determination of valsartan. Int J Pharm Pharm Sci 2016;7(8):57-61.
8. Sethi PD. HPLC Quantitative Analysis of Pharmaceutical Formulations. 1st ed. Delhi: CBS Publishers; 2001.