Volume 2010, Article ID 870976,16pages doi:10.1155/2010/870976
Research Article
Cross-Layer Dynamic Spectrum Map Management
Framework for White Space Applications
Seungil Yoon,
1Kyutae Lim,
1and Jongman Kim
21Georgia Electronic Design Center, School of Electrical and Computer Engineering, Georgia Institute of Technology, Atlanta,
GA 30332, USA
2KORUS Research Center for Informersive Systems, School of Electrical and Computer Engineering,
Georgia Institute of Technology, Atlanta, GA 30332, USA
Correspondence should be addressed to Seungil Yoon,[email protected]
Received 16 January 2010; Accepted 15 October 2010
Academic Editor: Jordi P´erez-Romero
Copyright © 2010 Seungil Yoon et al. This is an open access article distributed under the Creative Commons Attribution License, which permits unrestricted use, distribution, and reproduction in any medium, provided the original work is properly cited.
White space, unused TV spectrum, will be allowed for unlicensed use by wireless communication devices “the so called white space applications (WSAs).” WSAs retrieve a location-based spectrum map, a list of open white space channels, from a spectrum map server and can select one on the list as their operating channel for the broadband Internet access. However, since not only primary users such as TV broadcasting services use white space shortly or longly but also neighboring WSAs do, WSAs need to perform spectrum sensing that determines the occupancy status, either occupied or unoccupied, of white space channels and select one among the unoccupied channels according to the spectrum sensing results. In a conventional spectrum sensing, they can execute unnecessary spectrum sensing on the already occupied channels. This paper proposes a dynamic management framework of white space that extends a spectrum map to contain occupancy information with the assistance of WSAs. Our framework enables WSAs to avoid unnecessary spectrum sensing on the channels that are marked as occupied according to the extended spectrum map. In return for the provision of the spectrum map, a spectrum map server obtains the spectrum sensing results of associated WSAs to update the extended spectrum map about the channel occupancy status. Theoretical analysis indicates that the proposed framework can contribute to shortening the total spectrum sensing time of WSAs by up to 50%.
1. Introduction
In November 2008, the Federal Communications Commis-sion (FCC) [1] announced that white space applications (WSAs) or devices (WSDs) that do not interfere with primary users or applications such as TV broadcast services will be allowed to operate on white space, locally unused TV spectrum, for the wireless broadband Internet access. According to the FCC rules, WSAs should be able to connect to a public database server “a so-called spectrum map server” or another database server such as “a so-called radio resource management (RRM) server” that provides a location-based spectrum map. By retrieving the spectrum map of the current location, WSAs can implement the protection of primary users by performing spectrum sensing on the only channels that are open for unlicensed use according to the retrieved spectrum map. However, every
location has the different number of open channels for WSAs, and primary users such as TV broadcasting services and wireless microphones can dynamically occupy unused channels. Thus, WSAs must perform spectrum sensing after retrieving the spectrum map of the current location whenever they start their service, their location changes, or they recognize the change of the wireless environments of white space. Multiple standard or industry-led groups such as IEEE [2], White Space Database Group [3], and ECMA [4] have been involved in developing white space standards.
operating channel. According to [5–9], WSAs can find their operating channel in noncooperative ways such as dynamic frequency selection or dynamic frequency sharing without the assistance of neighboring WSAs. However, to increase the efficiency of channel selection, WSAs can find their operating channel using spectrum auction or leasing mechanisms that are managed by a spectrum management controller [10– 15]. For instance, a decentralized controller can conduct the spectrum map management of a local area while a centralized controller can provide spectrum map management over all areas. Regardless of the spectrum management techniques that WSAs depend on, we prefer the method that one WSA exclusively operates on one white space channel at one location. This exclusiveness is different to spectrum management of other unlicensed access networks such as WiFi, which permits multiple devices to operate on the same channel with less concerning for the collision or the service degradation with neighboring WiFi devices.
As a coordinated method of the above two approaches, multiple WSAs can share one channel using message-based spectrum contention [16] that schedules exclusive access in a promised set of data frames within a superframe. In addition, using transmit power control, WSAs can adjust their transmit power after negotiating with neighboring WSAs to generate less interference to neighboring WSAs. Newly joining WSAs will be pleased if anyone can inform which channels are unused at the current location of the WSAs. Based on this preference, we suggest extending the role of a spectrum server that provides not only a spectrum map but also the channel occupancy status, either occupied or unoccupied, with extra information. Using an extended spectrum map having the occupancy status, newly joining WSAs can reduce the scope of spectrum sensing from all white space channels to a small number of channels that are suspected to be unoccupied. As the return of the retrieved spectrum map, newly joining WSAs could send the spectrum sensing results to the spectrum server to assist the server in building and dynamically updating the spectrum map with the occupancy status extracted from the spectrum sensing results. Throughout this paper, the RRM server represents the spectrum server that provides the extended spectrum map. If any WSAs do not cooperate in constructing the dynamic spectrum map, their neighboring WSAs that are willing to provide their spectrum sensing results to the RRM server can detect these noncooperative WSAs at the same or neighboring location. In this case, the RRM server can recognize the existence of noncooperative WSAs from the spectrum sensing results of registered WSAs, which are neighbors of the noncooperative WSAs.
As a result of cross-layer cooperation between WSAs and the RRM server, newly joining WSAs with the dynamic spectrum map are capable of not only shortening the total spectrum sensing time but also decreasing interference to neighboring WSAs by reducing the possibility of miss detection. This paper consists of the following sections. Section 2describes the dynamic spectrum map management architecture, technical challenges, and solutions. Section 3 explains the dynamic spectrum map management by explor-ing the extent to which the RRM server manages the dynamic
spectrum map and the newly joining WSAs use the dynamic spectrum map in a channel selection.Section 4explains the extent to which we conduct theoretical analysis and what analysis results we have.Section 5summarizes our work.
2. Dynamic Spectrum Map Architecture
WSAs and the RRM server act as the main system compo-nents on the dynamic spectrum map architecture.
2.1. Network Reference Model. Figure 1 depicts a network reference model of dynamic spectrum management. In this reference model, we do not support WSDs operating in ad-hoc mode, and client-based white space portable devices (WSPDs) that may have multiple licensed and/or unli-censed wireless interfaces can associate with one or multiple infrastructure-based white space access points (WSAPs). Depending on the purpose of WSPDs, we can have three types of client-based WSPDs, Type 1, Type 2, and Type 3, as depicted in Figure 1. A Type 1 WSPD has licensed and unlicensed wireless interfaces while a Type 2 WSPD and a Type 3 WSPD have only white space interfaces. Thus, two WSPDs supporting different white space standards cannot communicate as depicted in a stop mark ofFigure 1. However, if neighboring WSAPs can support interfaces between WSAPs and the RRM server such as RRM-SU1, RRM-SU2, and RRM-SU3 in Figure 1, they can offer the spectrum sensing results to the spectrum server and retrieve the spectrum map. The RRM server retrieving the spectrum sensing results of registered WSAPs builds the location-based spectrum map containing the channel occupancy information.
WiFi
(orcellular)-RRM
SU1-RRM
RRM-SU
2
RRM-RRM
RRM-RRM
RRM-RRM
RR M-e
xte rnal
RRM
External-RRMRRM
SU3-RRM
Radio resource manager (as a local spectrum server) External RRM server like white database group White space access point (WSAP) for secondary user standard1 (SU1)
WSAP for SU2 WSAP for SU3 White space portable
device (WSPD) with WiFi and SU1 interfaces
WSPD with only SU1
interface
WSPD with only SU2
interface
WSPD with SU1 and SU3 interfaces
Type 1 Type 2 Type 3
Figure1: A network reference model for dynamic spectrum map management.
the given channel information as reliable. We present more details how to manageγonSection 3.
Along with the spectrum map, WSAPs manage a list of backup channels,B, that are not currently occupied but neighboring WSAPs regard them as their recovery channels to prepare the inevitable case of switching their operating channel. This event can occur in a case of the unexpected appearance of primary users on their current operating channel. Thus, the best channel selection is to find the channel that its channel occupancy is unoccupied and is not considered as the backup channel of neighboring WSAPs. The list of backup channels,B, is used in a channel selection procedure for checking above conditions.
2.3. Spectrum Map Lifecycle. In the RRM server, as described in the previous section, every geolocation has its own spectrum map, and the spectrum map stays either in the learning stage or in the serving stage. When the RRM server creates the spectrum map of the new location, the new spectrum map starts from the learning stage. In the learning stage, the RRM server can figure out a usage pattern of
white space channels through analyzing the spectrum sensing results retrieved from associated WSAPs operating in the new location, and then, the RRM server can update the spectrum map with the occupancy status,S, of white space channels. After the successful update, the spectrum map is maintained in the serving state, in which the RRM server can provide it to newly joining WSAPs while the RRM server continues to update the spectrum map with the retrieved spectrum sensing results from associated WSAPs.
WSAPs and provide their updated spectrum sensing results to the RRM server. The spectrum sensing results merging the spectrum sensing results of neighboring WSAPs can contribute to the increase in the accuracy of the spectrum map. However, when the accuracy of the spectrum map becomes less than a certain level, the spectrum map starts from the learning stage again.
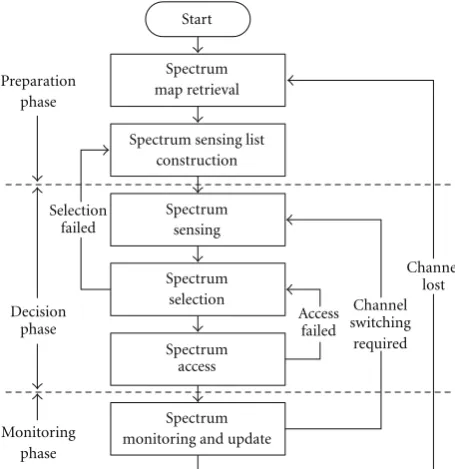
2.4. General Flow of Spectrum Map Management. Figure 2 illustrates the general flow of channel selection conducted by newly joining WSAPs, and the selection consists of three operation phases: the preparation phase, the decision phase, and the monitoring phase. In the preparation phase, the newly joining WSAPs with the retrieved spectrum map build a list of white space channels targeted for spectrum sensing and execute spectrum sensing on channels included on the target list as the initial step of the decision phase. If they find one or more unoccupied channels from the spectrum sensing results, they select their operating channel among unoccupied channels, and if they succeed in spectrum access on the selected channel, they start their service in the active state on the channel. Otherwise, they execute the second spectrum sensing on the channels that were not included on the target list for the first spectrum sensing. In fact, since they can fail in spectrum access on their selected operating channel because of the inaccuracy of spectrum sensing, they continue to examine the next available channel among unoccupied channels until they succeed in spectrum access on the channel. However, if they fail in all attempts, they start from the preparation phase by redefining the target list for spectrum sensing. On the other hand, if they succeed in spectrum access on their selected operating channel, they immediately move to the monitoring phase and continue to monitor the wireless environments of their operating channel. They can also request associated white space clients to report their spectrum sensing results. In the monitoring phase, they prepare a case of switching their operating channel from the current one to another unoccupied channel because of the sudden appearance of primary users or their encounter with a low performance on the current operating channel for a certain time. Thus, activated WSAPs must periodically execute spectrum sensing on white space channels, and, thus, they can also provide the additional spectrum sensing results to the RRM server.
Figure 3 illustrates the extent to which newly joining WSAPs perform a channel selection. Updating the spectrum map with the spectrum sensing results occurs on both the RRM server and the WSAPs. At the stage of building the target list of spectrum sensing, the WSAPs do not include occupied channels on the target list according to the spectrum map. For instance, they exclude the second channel and the other channels such as the fifth one on the target list as depicted in the second step ofFigure 3. After spectrum sensing, they now recognize that the occupancy status of some channels on the target list does not change while the occupancy status of the others changes. They apply these spectrum sensing results to the update of the spectrum map stored in their internal memory and deliver the updated spectrum sensing results to the RRM server in a report
Start
Spectrum map retrieval
Spectrum sensing
Spectrum access Spectrum
selection
Spectrum monitoring and update
Channel switching required
Channel lost Spectrum sensing list
construction
Selection failed Preparation
phase
Decision phase
Monitoring phase
Access failed
Figure2: A general flow of a channel selection procedure with the extended spectrum map.
message as the most recent spectrum sensing results in the location where they operate.
2.5. Asynchronous Update of the Spectrum Map. While the WSAPs rely on their own spectrum sensing results mostly, the RRM server believes the retrieved spectrum sensing results partly, which is proportional to the accuracy of spec-trum sensing techniques. Since all WSAPs can have different spectrum sensing techniques, they can have the different accuracy of spectrum sensing results from diverse registered WSAPs. Thus, to handle this instability in the accuracy of spectrum sensing results, the RRM server manages the accuracy index,γ, that numerically scales the reliability of the occupancy status information of every white space channel on the spectrum map. Since newly joining WSAPs build a list of unoccupied channels for spectrum sensing in compliance with the retrieved spectrum map, spectrum sensing results include the current occupancy status of the only channels on the target list. Thus, the update of the occupancy status with the spectrum sensing results from one WSAP is not applied to all white space channels. In other words, the update of the occupancy status of every channel occurs asynchronously with the spectrum sensing results retrieved from the diverse accuracy of spectrum sensing techniques, and that is the reason why the RRM server maintainsγper channel.
1 2 3 4 5
1 3 4 i N
i N
1 2 3 4 5 i N
1 3 4 i
i i
N
Idle Busy
Success Failure The list of white space channels
(1) Spectrum map retrieval
(2) Spectrum sensing list construction
(3) Spectrum sensing
(4) Spectrum selection and spectrum access
(5) Spectrum monitoring and spectrum update
Update-3
Update-4
Update-1
Update-2
Figure3: An example of a channel selection procedure with the proposed framework.
spectrum access. Otherwise, except the operating channel, for the channels included on the target list such as the first channel inFigure 3, the RRM server calculates the accuracy index with Update-3. For the rest of channels excluded on the target list, the RRM server calculates the accuracy index with Update-4. We describe more details of calculating the accuracy index onSection 3.1.
2.6. Technical Challenges and Solutions. In the extension of the RRM server, maintaining a radio resource map that matches the real radio environments of white space channels for all locations will constitute multiple technical challenges. For one, the RRM server should have a large number of WSAPs that connect to the RRM server. Depending on the density of activated WSAPs at a location, the change in the channel occupancy status will occur either dynamically or slowly. If the RRM server has only a few WSAPs that inform the server about a change in the channel occupancy in a densely populated area, the RRM server cannot build a reliable radio resource map or the spectrum map that reflects the latest occupancy status of white space channels. Another challenge is that the spectrum map depends on the accuracy of spectrum sensing since all WSAPs determine the channel occupancy based on spectrum sensing results. As the accuracy of spectrum sensing increases, the accuracy of the spectrum map increases. However, the RRM server cannot always retrieve the spectrum sensing results of high spectrum sensing techniques since heterogenous WSAPs have their different target applications and/or spectrum
sensing techniques. Thus, the RRM server obtains diverse spectrum sensing results that contain the rather different radio environment reports in the same location. In addition, although previous researches studied the evaluation metrics of spectrum sensing based on the characteristics of spectrum sensing techniques such as energy detection [17] and feature detection [18], they do not numerically scale the values of evaluation metrics. For example, Table 2.2 of [9] presents a comparison of multiple spectrum sensing detectors, which summarizes the characteristics of multiple spectrum sensing detectors with three properties: computational complexity, sensitivity to synchronization errors, and robustness to noise uncertainty. They only define evaluation values to be relative comparison to each detector as Highor Moderate, and, thus, the RRM server cannot use these evaluation values to update the accuracy index of channels on the spectrum map.
in spectrum sensing techniques, and based on this keyword, we can redefine two challenges into the following problems: the support of spectrum sharing between heterogeneous WSAPs and the accuracy management of the spectrum map. Since heterogeneous WSAPs cannot directly communicate or perform cooperative spectrum sharing mechanisms, we suggest that the RRM server acts as a main coordinator of supporting spectrum sharing and managing the accuracy of the spectrum map with the assistance of registered WSAPs.
3. Dynamic Spectrum Map Management
The RRM server can effectively lead dynamic spectrum map management by accommodating any type of WSAPs having different access standards as long as they can communicate with the RRM server.
3.1. Spectrum Map Information Management. To support spectrum sharing between heterogeneous WSAPs and to manage the accuracy of the spectrum map, the RRM server should be able to analyze the real network environments of white space channels from the spectrum sensing results of registered WSAPs. Thus, we suggest that the RRM server collects the following parameters:
(i) the number of WSAPs that made the report messages of the spectrum sensing results,
(ii) the number of occupied channels and detected neighboring WSAPs from each report message, (iii) the number of the activation and the deactivation of
WSAPs,
(iv) the duration time of one channel to be occupied with the start and end times.
Once the RRM server finishes the collection of the above parameters, the RRM server can estimate the following parameters:
(i) the average duration time of one channel to be occupied,
(ii) the average number of occupied channels and detected neighboring WSAPs,
(iii) the average interarrival time between two report messages,
(iv) the average number of report messages during a pre-defined duration.
The RRM server will use Rto that represents the average interarrival time between two report messages to decide a wait time for a next report message. In addition, by simply dividing the average duration time by the average interarrival time, the RRM server can estimate the average number of simultaneously activated WSAPs that connect to the RRM server (Nα). Meanwhile, using the average number of occu-pied channels and detected neighboring WSAPs, the RRM server can also estimate the average number of neighboring WSAPs, Nβ. We define the ratio of the two numbers, ν = Nα/Nβ, that represents the percentage of the total number
of WSAPs that connect to the RRM server. Thus, for a high accuracy of spectrum sensing,νshould approaches 1. With a calculatedν, we suppose the network environment of white space channel in the location of WSAPs.
Every channel information of the spectrum map includes the accuracy index,γ, that numerically scales the reliability of the occupancy status of the channel in the spectrum map. Let γidenoteγof the occupancy status of theith channel. When the RRM server creates the spectrum map of all the locations for the first time, it setsγto zero for all channels. Now, the RRM server, which retrieves the spectrum sensing results of theith channel at a location for the first time, initializesγi with the probability of detection, Pd, of spectrum sensing techniques of the WSAP that reported the spectrum sensing results. After the server updatesγionce, the server updates γiin two different situations, before and just after retrieving a report message. Until the server retrieves a next report message from any WSAP at location L within Rto time, which follows the exponential distribution as depicted in Figure 4(a), the server applies the exponential decrease inγi of locationLwith the following equation:
γx i =γ0i
1−eγ0
ix
, i∈ {1, 2, 3,. . .,N}, (1)
where γ0
i for the ith channel is initialized with γs(= Pd of spectrum sensing of the WSAP sent the first spectrum sensing results), andxis given byt/Rtowhentis the duration time of the consecutive expirations ofRtotimers. If the server fails to retrieve an expected next report message and instead, retrieves a sign of the expiration of theRto timer, the server restarts the newRtotimer after updatingγiwith (1).
However, when the server retrieves a report message before theRtotimer is expired, the server has three choices of updatingγi: no change as depicted inUpdate 1ofFigure 4(b), initialization with a givenγs(=Pd) as depicted inUpdate2/3, or initialization with one as depicted in Update 4. The first choice,Update 1, is that the RRM server does not updateγi if the retrieved report message does not have the spectrum sensing results of theith channel at locationLsince WSAPs did not execute spectrum sensing on the ith channel. The second choice,Update 2/3, is that the RRM server updates γi with Pd of spectrum sensing techniques of the WSAP that sent the report message since the WSAP selected the ith channel as its operating channel, but the WSAP failed in spectrum access on the channel. The second choice also includes the case of updating γi of all channels except the operating channel included in the spectrum sensing results. The third choice,Update 4, is that the RRM server updates γi with one, which indicates that the accuracy of spectrum sensing of the WSAP is reliable since spectrum access on theith channel was successful. Since the update ofγoccurs asynchronously,γof all channels can differ at any time. Now, we have five ways of updatingγconsisting of one way in a case of the expiration of theRtotimer and four ways,Update
−1/2/3/4, in a case of the retrieval of the report message containing the spectrum sensing results.
0 1 2 3 4 5 x
A
ccur
acy
of
ch
annel
infor
mation
(
γ
)
γx
i =γ0i(1−eγ 0 ix)
Rto
Number of consecutiveRtoexpirations
xincreased one wheneverRtotimer expired
γ0
i =γs(≤1),x=0
(a) with consecutive expirations ofRtotimers.
A
ccur
acy
of
ch
annel
infor
mation
(
γ
)
0 1 0 x
Number of consecutiveRtoexpirations
Update 1:γ0
i =1
Update 2, 3:γ0
i =γs
Update 4:γi0=γx i
(b) with a report message.
Figure4: Calculation of the accuracy index of theith channel.
for spectrum sensing, and inside the algorithm,γi is used to decide whether the algorithm includes the ith channel on the target list, which the spectrum map marked as unoccupied. If γi is greater than a certain threshold, χ, the algorithm regards the occupancy status information, S, of the ith channel on the spectrum map as reliable. Thus, the algorithm includes the ith channel on the target list of spectrum sensing, ST, if S is zero. In addition, the algorithm also includes any occupied channels, but if the white space standard,W, of the newly joining WSAPs is same as the standard, Wd, of neighboring WSAPs, which were previously detected by other WSAPs in the same location, operating on the ith channel. This addition is designed to collect beacon frames of neighboring WSAPs and prepare an inevitable case of performing coexistence mechanisms because of the absence of unoccupied channels. In this
(1) ProcedureCreateSpectrumSensingList(T,χ,Wd) (2) ST[ ]←0
(3) fori←1dolength(T)
(4) Begin
(5) {i,S,W,γ} ← {S,W,γ}oftiinT
(6) Ifγ≥χthen
(7) Begin
(8) IfS=0then
(9) ST·add({i,S,W,γ})
(10) else
(11) IfWd=Wthen (12) ST·add({i,S,W,γ})
(13) End
(14) else
(15) IfW /=Primar yUsersthen
(16) ST·add({i,S,W,γ}) (17) End
(18) returnST (19)end Procedure
Algorithm1: CreateSpectrumSensingList.
case, the WSAPs can obtain the coexistence mechanisms supported by neighboring WSAPs from the collected beacon frames. The previous operations as shown in lines 7–13 are only meaningful whenγis greater than or equal to χ, and otherwise, the algorithm includes the ith channel on the target list only if the channel is not used by primary users as shown in lines 15-16.
3.3. Spectrum Sensing Result Retrieval. On all channels on the built target list,ST, the newly joining WSAPs perform spectrum sensing. Regardless of spectrum sensing schemes, they expect a retrieval of spectrum sensing results, STs, a set ofch,S,W,Cof all channels included onST withPd of the spectrum sensing schemes.chof the jth element on STsis the channel number of the white space channel where its spectrum sensing results are stored in the jth element onSTs,S indicates the occupancy status according to the spectrum sensing results, andW indicates the existence of primary users operating on the channel or any detected neighboring WSAPs that support the same access standard of the newly joining WSAPs. For instance, we can defineW to have one of values,PU1,PU2,SU1,SU2,SU3, and UN. PU1 represents TV broadcasting services,PU2does wireless microphones, and SU1/2/3 represent different unlicensed white space standards while UN indicates that the access standard of detected neighboring WSAPs is unknown. If the WSAPs locate in a densely populated area, they can detect multiple neighboring WSAPs operating on the same channel. If all detected neighboring WSAPs are homogenous, the WSAPs can build a list of neighboring WSAPs by interpreting retrieved beacon frames of neighboring WSAPs, and this list is useful if the WSAPs need coexistence mechanisms in a matter of spectrum sharing. For instance, depending on coexistence capability of the WSAPs and the neighboring WSAPs, they can negotiate the adjustment of their trans-mission power for coexistence. At that moment, the WSAPs can use W and C to decide whether the negotiation of coexistence with the neighboring WSAPs is affordable or not.
jth element onSTshasch,S,W,Cof therj. chth channel with the following extra parameters.
(i)A: a list of the detected neighboring WSAPs on the chth channel. This is optional.
(ii) Backup channel flag (BF): the flag that indicates whether the chth channel is a potential backup channel for neighboring WSAPs.
In addition, the WSAPs maintain the following list:
(i)SSs(SSs ⊆ ST): a list of channels included on STs, which their occupancy status according to STs is unoccupied, but its real occupancy status is occupied according to the spectrum map of neighboring WSAPs.
The WSAPs build SSs withSTs andT of the neighboring WSAPs extracted from the retrieved coexistence beacon frames.
3.4. Spectrum Selection Procedure. Based on the acquired spectrum sensing results, the newly joining WSAPs perform the selection of their operating channel. WithSTsandSSs, the WSAPs executeAlgorithm 2for a channel selection, and the algorithm consists of two steps: the collection of unoccupied channels and the selection of the operating channel. In the first step, as shown in lines 3–8, the algorithm searches unoccupied channels onSTs. Since the j index onST,STs, andSSsno longer indicates a channel number, we use thech field to indicate a channel number. If the occupancy status of therj·chth channel,S, is zero, the algorithm addsrj to a list of candidate channels for the operating channel,CS. The algorithm executes the previous operation on all channels on STs and counts the size of CS. If the size is only one, the algorithm declares the r0 ·chth channel on CS as the operating channel of the WSAPs. However, as shown in lines 16–19, the size ofCScan be greater than one, which means that we have multiple unoccupied channels. In the second step, the algorithm calls the selOneFromMultiples function that selects one channel among multiple ones.
InselOneFromMultiples, the algorithm attempts to find any candidate channel that is also not detected as the backup channel for neighboring WSAPs. The previous operation can find one or more candidate channels, which are unoccupied and not backup channels of neighboring WSAPs. In this case, the function simply returns the first channel as shown in the line 27. However, if all unoccupied channels are backup channels for neighboring WSAPs, the function randomly selects one of them as shown in line 29. The WSAPs perform spectrum access on the selected operating channel, and if it is successful, they move to the active state to provide the broadband Internet access for their customers along with the update of the spectrum map. Otherwise, they repeat the new channel selection procedure, which executes Algorithm 2 and performs spectrum access on a new selected operating channel, after deleting the current operating channel from STs.
When the size ofCSis less than one, which means that the algorithm failed in searching any unoccupied channel,
(1) procedureChannelSelection(STs,SSs,γs,χ) (2) CS[ ]←0
(3) fori←1dolength(STs)
(4) Begin
(5) S←Sofr
iinSTs (6) IfS=0then
(7) CS·add(ri)
(8) End
(9) Iflength(CS)=1then
(10) returnCS[1] (11) else
(12) Begin
(13) If length(CS)>1then
(14) returnselOneFromMultiples (CS,SSs)
(15) else
(16) Ifγs≥χthen
(17) # returnTransmit Power Control
(18) else
(19) returnnull (20) End
(21) returnnull (22)end procedure
(23)ProcedureSeloneFromMultiples (CS,SSs) (24) fori←length(CS)do
(25) Begin
(26) Ifri·BF=0 andri·chfound onSSsthen (27) returnri·ch
(28) End
(29) j←rand(length(CS)) (30) returnCS[j]·ch
(31)end procedure
Algorithm2: ChannelSelection.
(1) procedureSpectrumMapUpdate(Ind,ac,T,STs,Pd,χ) (2) UT[ ]←T
(3) forj←1dolength(STs)
(4) Begin
(5) c←chofrjinSTs (6) Ifc=acthen
(7) Ifind=successthen
(8) UT[c]·γ=1
(9) else
(10) UT[c]·γ=Pd (11) else
(12) Begin
(13) UT[c]·γ=Pd
(14) End
(15) If(ind=success) or (Pd≥χ)then (16) UT[c]·S=rj·S,UT[c]·W=rj·W (17) End
(18) T=UT; (19)end procedure
Algorithm3: SpectrumMapUpdate.
the algorithm can conduct TPC ifγs(= Pd) is greater than χor the second spectrum sensing on channels that were not included onST of the first spectrum sensing. However, If the WSAPs failed in the second spectrum sensing, they can finally decline their activation and wait until some channels are released, or as shown in line 17, they can also conduct TPC.
Table1: Parameters for Evaluation of the Proposed Framework.
Description Unit Value
N number of channels 30, 50
R default service radius m 120, 180
A unit area πm2 25
m number of WSAPs perA [0.025 : 0.025 : 0.05]
ρ density of WSAPs (=m/A) [0.001–0.02]
ϕ duty cycle 1.0
k min session duration time sec 120
p max session duration time sec 2400
E(Td) mean session duration time sec 333
μ session termination rate 10.8
the channel selection and spectrum access procedures. Ind
represents the success or the failure of spectrum access, and ac represents a channel number of the operating channel. The algorithm updatesγof the channels onTwith the above update rules as shown in lines 8–13 and also updates theS andW fields of the channels onT if spectrum access was successful and the accuracy of spectrum sensing is greater than or equal to χ as shown in lines 15-16. In fact, the algorithm executed in the WSAPs does not conduct lines 6– 14 because the RRM server is only responsible for updating γ. However, as shown in lines 15-16, the algorithm in the WSAPs updatesSandWfields, which are internally stored in the WSAPs, and the WSAPs use the updated local spectrum map in a next channel selection or switching until they retrieve the newlyupdated spectrum map from the RRM server or the new spectrum map of the new location as the WSAPs move to the new location.
While the WSAPs operate in the active state, they per-form a periodic spectrum sensing on their operating channel and another channel regardless of the occupancy status of the other channel as the WiFi devices do. For example, 802.11 a/g devices can scan 11 channels within the default 180 seconds (50 ms scan time on each channel every 16 seconds). The same approach on WSAPs can amend a corrupted spectrum map indicating a particular channel as occupied, but the channel is in fact unoccupied. This amendment takes a little longer time than the case that the newly joining WSAPs execute the second spectrum sensing against the channels excluded from the first spectrum sensing. Through a periodic scan, our proposed framework builds more reliable spectrum map as more spectrum sensing on the active state continues. To validate the retrieved spectrum map results, the RRM server will only accept the spectrum sensing results from registered WSAPs. However, this paper does not provide specific identification schemes, which is beyond the scope of this paper. In addition, to resolve conflicts that can occur because of the diverse spectrum sensing results from heterogeneous WSAPs having different spectrum sensing techniques, the RRM server prefers the most recent spectrum sensing results of spectrum sensing techniques having a high accuracy.
4. Theoretical Analysis
For theoretical analysis of the proposed dynamic spectrum management framework, we adopt theM/G/m/mqueueing model to define the M/B/N/N model as the evaluation model of dynamic spectrum management. In ourM/B/N/N
queueing model, M indicates that the activation of newly joining WSAPs follows a Poisson distribution, andB indi-cates that a service duration time follows a bounded Pareto distribution. With theN number of white space channels, the secondN indicates that newly joining WSAPs will fail in finding unoccupied channels if the number of activated neighboring WSAPs is greater thanN. In addition,Table 1 shows the values of parameters for evaluating dynamic spectrum management. We refer to the duration time of speech of 120 seconds as the minimum session duration time [19] and 12 times the duration time to watch web videos [20], 192×12 seconds, as the maximum session duration time. A newly joining WSAP will send one report message to the RRM server since the WSAP should connect to the RRM server to retrieve the spectrum map. Since the average interarrival time of two consecutive report messages follows an exponential distribution, its probability density function (pdf) is expressed asE(Tarr)=1/δ =1/ρπR2, in whichδis the average number of active WSAPs,ρis the density of the WSAPs, andRis the average distance of service coverage. The pdf of the service duration time, which follows the bounded Pareto distribution, is expressed as
E(Td)= kω 1−k/ pω
ϕ
ω−1
1 kω−1−
1
pω−1 , (2)
where ω is 1.2 [21]. With k and p in Table 1, we have E(Tarr) = 333 seconds, and μ = 10.8 is calculated by 3600/E(Tarr). We estimate the blocking probability,PB(δ,μ), and the expected number of active WSAPs,EN(δ,μ), using the following equations:
PBδ,μ=
δ,μN/N! N
n=0
δ,μn/n!,
ENδ,μ=
δ μ
1−PBδ,μ.
(3)
In our analysis, instead of δ,Nβ represents the average number of WSAPs, which is expressed as
Nβ=ρϕπR2, (4)
it may turn into a dormant state, and it will release the channel. Using (2), (3), and (4), we can calculate the expected number of activated WSAPs, E(Nβ), with the following equation:
In fact, depending on the accuracy of spectrum sensing or the probability of detection,Pd, newly joining WSAPs cannot successfully detect theE(Nβ) number of neighboring WSAPs. Thus, we define E(Nβ), which reflects the accuracy of spectrum sensing in the calculation of the expected number of detected neighboring WSAPs. The following equation is used to calculateE(Nβ):
wherePiis the probability of the occupancy of theith channel at any time, and Pf is the probability of false alarm. If WSAPs attempt to access all channels equally, Pi becomes equal toE(Nβ)/N, and we have a simplifiedE(Nβ)=(Pd− Pf)E(Nβ) + N × Pf. However, spectrum sensing, which can detect unoccupied channels as occupied because of miss detection, can detect occupied channels as unoccupied because of false alarm. Thus, we can calculate the number of channels misjudged by spectrum sensing with the following equation:
Using E(Nβ) and Ne, we define the spectrum sensing reliability index (SSRI), which is given by
Rs=1− Ne
N−ENβ, (8)
and in theoretical analysis, we useRsasχin the algorithms.
4.1. Accuracy of Extended Spectrum Map. Since the perfor-mance of the proposed framework relies on the accuracy of the extended spectrum map, we studied the extend to which Rs is affected by the environments of white space and the accuracy of spectrum sensing. According to (8),Pd, Pf,ρ, μ, and E(Nβ) are key parameters for evaluating the performance ofRs. Thus, we define previous five parameters as the evaluation parameters for Rs and the values of the parameters for the analysis of the performance of Rs. By applying the values to (8), we evaluate the extend to which our framework performs according toRs.
Figure 5(a)illustrates the expected number of occupied channels for Pd = 1 and Pf = 0 when the density of WSAPs (ρ), the average rate of service time (μ), and the expected number of simultaneously activated WSAP,E(Nβ), are known. With μ = 10.8 and N = 30, the expected number of occupied channels reaches around half of 30 when ρ reaches approximately 0.004. In the case of N =
50, the expected number reaches around half of 50 when ρ reaches approximately 0.006. Based on this observation, we decide the range of the density of WSAPs for the theoretical analysis of spectrum sensing from 0.002 to 0.02, and we regard ρ beyond 0.008 for N = 30 and 0.012 for N = 50 as the situation in which most channels are occupied.
With given Pm(= 1 −Pd), Pf, ρ, μ, and E(Nβ), we analyzed the extent to which they affect Rs. As depicted in Figure 5(b), with Pm = 0.01 and Pf = 0.01, the difference of E(Nβ) andE(Nβ) is about one channel. Even with a high probability such as Pm = 0.1 and Pf = 0.05, the difference between E(Nβ) andE(Nβ) is less than five for N = 30 and N = 50. Thus, we disregard the impact of miss detection or false alarm in the calculation of the number of detected neighboring WSAPs in theoretical analysis.Figure 5(c) illustrates the calculatedRs withPi = E(Nβ)/N. With a low probability of miss detection and a low probability of false alarm,Rshas a bigger value thanRs with a high probability. For example, withPm = 0.01 and Pf = 0.01, Rs is greater than 0.9 for both N = 30 and N = 50 whileRsforPm = 0.1 andPf = 0.05 is less than 0.8 and 0.5 forN = 30 andN = 50, respectively.Rswith ρ=0.008, which approaches 0.5 forN=30, approaches 0.5 forN = 50 withρ = 0.012. According to the observation of the (c) label inFigure 5(a),E(Nβ) reaches almostN =30 and 50 atρ=0.008 and 0.012, respectively. Thus, the analysis indicates that the RRM server can provide a reliable spectrum map whenRsis greater than 0.4, and we set the threshold,χ, used in Algorithms1,2, and3forγto 0.4 in our analysis. We do not evaluate the performance of the proposed framework withRs<0.4.
4.2. Probability of Success in Channel Search. With a typical spectrum sensing approach, we can estimate the probability of success in a channel search with the following equation:
(c) Saturation points
(a)ρ≈0.004
(b)ρ≈0.006
N=50
N=30
0.004 0.008 0.012 0.016 0.02 The WSAP density (ρ)
(a) An ideal case
N=30 with no error
N=50 with no error
0.004 0.008 0.012 0.016 0.02 The WSAP density (ρ)
(b) An practical case
(a)ρ≈0.008
0.004 0.008 0.012 0.016 0.02 The WSAP density (ρ)
N=30,Pm=0.01,Pf =0.01 N=30,Pm=0.1,Pf =0.05
N=50,Pm=0.01,Pf =0.01 N=50,Pm=0.1,Pf =0.05
(c) Spectrum Sensing Reliability Index (SSRI)
Figure5: The expected number of activated WSAPs withR=120mand errorless spectrum sensing techniques when the density of WSAPs (ρ), the average rate of the service time (μ), and the expected number of activated WSAPs,E(Nβ), are known (Subfigure (a)). versus the expected number of activated WSAPs with erroneous spectrum sensing techniques (Subfigure (b)). Subfigure (c) depicts the extent to which the Spectrum Sensing Reliability Index (SSRI) is affected with the knownPm,Pf,ρ,μ, andE(Nβ).
search with the extended spectrum map. Let Pi(t) denote the probability of the occupancy of the ith channel at time t. Thus, at any time t, Pi(t), which we refer to as occupied or unoccupied according to the spectrum sensing results, for occupied channels should bePd while Pi(t) for unoccupied channels should be Pf. In addition, we can calculate the number of channels on ST by N −E(Nβ). Between two report messages, over a Δt period, we can estimate the number of the newly activated neighboring WSAPs by ψ(Δt) = Δt/E(Iβ), where E(Iβ)(= 1/Nβ) is
estimate the number of unoccupied channels afterΔtfrom timetwith the following equation:
Pi(t+Δt)=Pi(t) + that is beyond the scope of this paper. In fact, this paper assumes that the WSAPs can find at least one or more unoccupied channels after performing spec-trum sensing, which means that E(Nβ) is always less than N. Now, using (9) and (10), we estimate the probability of success in finding unoccupied channels in the first spectrum sensing with the following equa-tion: probability of detection of WSAPs that prefer spectrum sensing with the extended spectrum map, and Rs(t) is the Rs of the WSAP sending the report message at time t. With 1/Nα, we estimate E(Iα), that is, the interarrival time of two report messages with Nα, which is the aver-age number of WSAPs that connect to the RRM server. In our analysis, we estimate Nα with a given ν (ν = Nα/Nβ). In addition, φ is a scale parameter that controls a degradation range. For example, as φ approaches zero, Rs(t)/eφΔt decreases more smoothly compared to the case of φ approaching one. As registered WSAPs increaseE(Iα) approachesE(Iβ), and, thus,φ approaches zero. This coin-cides in the fact that the RRM server can trust more the spectrum map with a highν than the spectrum map with a low ν. With a low ν, since E(Iα) becomes greater than E(Iβ), φ approaches one resulting in a bigger decrease of Rs(t)/eφΔt.
While neighboring WSAPs that do not enroll in the RRM server occupy ψ(Δt) channels among N − E(Nβ) unused channels, some activated WSAPs will release their operating channel during theΔttime, which will increase the probability of success in the second spectrum sensing. In fact, we expect thatΔtμ/3600 channels will be released during the Δttime. However, ifΔtμ/3600 is greater thanψ(Δt), newly joining WSAPs will occupy the channels released during theΔttime, resulting in no change betweenPi(t+Δt) and Pi(t). While Pf s(t,Δt) represents the expected probability of success in the first spectrum sensing, Pf s(t) represents the highest probability of success in spectrum sensing if all the channels onST remain in the current occupancy status, occupied. Figures 6(a) and 6(b) with ν = 0.8 and Rs = 0.9 illustrate that the probability of success in a channel search approaches 80% when ρ is less than or equal to 0.008 for N = 30 and 0.012 for N = 50. Thus, we can have a high probability of success in a channel search in
Table2: The expected success probability of the second spectrum sensing,Pss(t), withRs=0.9,R=120 m, andN=30.
Time period ρ=0.002 0.004 0.006 0.008 0.010 0.012 0 0.475 0.671 0.743 0.762 0.768 0.770 5×(E(Iα)/6) 0.485 0.679 0.749 0.767 0.772 0.775
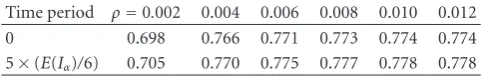
Table3: The expected success probability of the second spectrum sensing,Pss(t), withRs=0.9,R=180 m, andN=30.
Time period ρ=0.002 0.004 0.006 0.008 0.010 0.012 0 0.698 0.766 0.771 0.773 0.774 0.774 5×(E(Iα)/6) 0.705 0.770 0.775 0.777 0.778 0.778
the first spectrum sensing untilρbecomes greater than the saturation point. In addition, with a low Rs such as ν = 0.4 under a low population such as ρ = 0.004 or 0.006, WSAPs with the extended spectrum map can still perform around 80% success in a channel search in the first spectrum sensing. However, the RRM server, which fails to receive the spectrum sensing results of WSAPs within a certain time such asRto, cannot properly updateγ, resulting in a low chance of success in the first spectrum sensing with a rather unreliable spectrum map. When the RRM server has the expiration of theRto (= E(Iα)) timer, the RRM server restarts the timer whileγof all channels in the spectrum map exponentially decreases.Figure 6(d)illustrates the extent to which Pf s decreases if the RRM server fails in retrieving the next expected report message. Nevertheless, the decrease inPf s with a lowρ such as 0.002 or 0.004, is insignificant as depicted in the (a) label of Figure 6(d) even after the RRM server has the third consecutive expiration of anRto timer. However, we can observe the drastic decrease inPf s with a highρ. For instance, as depicted in the (c) label of Figure 6(d),Pf swith a highρis already less than or equal to 0.3 at the first timer expiration.
When the WSAP fails in the first spectrum sensing, the WSAP launches the second spectrum sensing against either all channels or channels that were not included onST. This paper assumes that on the second spectrum sensing, the WSAP excludes the channels included on ST of the first spectrum sensing. During theΔttime,Pi(t+Δt),i∈Sn−ST, for occupied channels is expressed as
Pi(t+Δt)=Pi(t)−
Using (12), the probability of success in a channel search on the second spectrum sensing,Pss, is expressed as
Pss(t,Δt)=PdRs(t)
−0.1 Time periods between two report messages
ρ=0.004 Time periods between two report messages
ρ=0.01 Time periods between two report messages
ρ=0.004 Time periods between the next report messages (c)Pf sforρ >0.008
when the firstRto
is expired
(a)Pf sforρ=0.002∼0.008 when the firstRtois expired
Su
Figure6: With the spectrum sensing reliability index,Rs=0.9, the analysis results of the expected probability of success in the first spectrum sensing,Pf s(t), withR=120 m andN=30 in (a) and (c) are presented. In subfigure (b), forN=50,ρvaries from 0.010 to 0.018. Subfigure (a) and (b) indicate that a higherρcontributes to the drastic drop of the probability of success, which we observe in (c) labels of subfigure (a) and (b). In subfigure (c), with a lowerν=0.4,Pf sstill approaches 80 % forρ=0.004 andρ=0.006. A subfigure (d) indicates the extent to whichPf swill decrease if we have consecutive expiration ofRtotimers.
second spectrum sensing could achieve no more increase in performance. Compared to the case of WSAPs with a shorter service distance, with a longer service distance,Pssof WSAPs, which experienced the failure of the first spectrum sensing at early time, increases. The previous observation indicates that the proposed framework can provide stable and predictable performance as long as we have proper operation parameters such as ρ and ν for every location through the learning
ρ=0.002
ρ=0.004
ρ=0.006
ρ=0.008
ρ=0.01
ρ=0.012
0 2∗(E(Iα)/6) 4∗(E(Iα)/6) E(Iα) Time periods between two report messages 80
120 160 200 240 280
Expect
ed
total
spect
rum
sensing
time
w
ith
Ts
=
10
ms
(a)E(Tss)(t) withν=0.8 forR=120 m
ρ=0.002
ρ=0.004
ρ=0.006
ρ=0.008
ρ=0.01
ρ=0.012
0 2∗(E(Iα)/6) 4∗(E(Iα)/6) E(Iα) Time periods between two report messages 80
120 160 200 240 280
Expect
ed
total
spect
rum
sensing
time
w
ith
Ts
=
10
ms
(b)E(Tss)(t) withν=0.8 forR=180 m
ρ=0.002
ρ=0.004
ρ=0.006
ρ=0.008
ρ=0.01
ρ=0.012
0 2∗(E(Iα)/6) 4∗(E(Iα)/6) E(Iα) Time periods between two report messages 80
120 160 200 240 280
E
xpect
ed
to
ta
l
spectrum
se
n
sing
time
w
ith
Ts
=
10
ms
(c)E(Tss)(t) withν=0.4 forR=120 m
Figure7: With the spectrum sensing reliability index,Rs=0.9, the analysis results of the expected spectrum sensing time,E(Tss)(t), with
N =30 are presented. Subfigure (b) is the analysis results ofE(Tss)(t) forR=180 m. Three subfigures depict thatE(Tss)(t) rather steeply increases whenρbecomes greater than a saturation point. In subfigure (c), with a lowerν=0.4,E(Tss)(t) still could be reduced significantly whenρis less than or equal to 0.008.
4.3. Average Spectrum Sensing Time. We estimate the expected total spectrum sensing time with a conventional spectrum sensing approach, which scans all white space channels, with the following equation:E(Tss)=N×ts, where tsis a time that takes for sensing one channel. We calculate the expected total spectrum sensing time with the proposed dynamic spectrum management,E(Tss)(t), using (14), as the sum of the expected time in the first spectrum sensing and the expected time of the second spectrum sensing
E(Tss)(t)=N−ENβts+1−Pf s(t)ENβts. (14)
E(Tss)(t) decreases. For example, in Figure 7(a),E(Tss)(t), which does not change untilρ approaches 0.008, decreases after ρ becomes greater than 0.008, which we can also observe inFigure 7(b). In addition,E(Tss)(t) withν=0.4 is below 200 ms, as depicted inFigure 7(c), withρ=0.002 and ρ=0.006. However, fromρ=0.008, we can observe increase in E(Tss)(t) since a low νresults in a low Pf s because the expiration of theRto timer can highly occur. The previous observations indicate that increase in the number of WSAPs supporting the extended spectrum map can shorten the total spectrum sensing time under the condition that newly joining WSAPs can find at least one or more unoccupied channels (ρ <asaturation point).
4.4. Burden of Updating the Spectrum Map. We expect that the extended spectrum map requires only dozen bytes to be added to a message that WSAPs use to connect to a conven-tional spectrum map server when they start their operation. The added bytes will be used to indicate the occupancy status of all white space channels, and our proposed framework requires one more connection to the RRM server compared to a conventional approach. The conventional retrieval of the spectrum map occurs once when WSAPs starting their service while our proposal requires two retrievals when WSAPs connect and disconnect to the RRM server. Let denote bw the number of bits in the message for the conventional retrieval of the spectrum map, and, then, we can calculate the total bandwidth of retrieving the spectrum map with bw× ρ. Our scheme requires 2 ×ρ ×(bw+ (N×size(S,W,C,γ)), where size (S,W,C,γ) is the number of bits for storing channel information for one white space channel, and 2 means that our scheme updates two times related to the activation and the deactivation of WSAPs. In addition, we expect that computational complexity is ignorable since channel information is simply updated using Algorithm 3, and updating the accuracy index,γ, is also not complicated.
5. Conclusions
In this paper, we propose the dynamic spectrum map management framework that can enhance the efficiency of spectrum sensing with the cooperation between white space access points (WSAPs) and the extended spectrum map server, the RRM server. The RRM server that manages a location-based spectrum map can assist WSAPs to shorten the total spectrum sensing time. Since the accuracy of the spectrum map depends on the accuracy of spectrum sensing techniques, the RRM server should acquire the assistance from a certain number of WSAPs that provide their spectrum sensing results of a higher accuracy of spectrum sensing techniques. Theoretical analysis indicates that for the high accuracy of the spectrum map, the number of WSAPs supporting the proposed framework should be greater than 0.4 times the total number of all registered and unregistered WSAPs to the RRM server. In addition, the theoretical analysis indicates that we can save up to 50% of the expected total spectrum sensing time as the number of registered WSAPs increases.
The proposed framework assists not only newly joining WSAPs to improve their starting operation with the short-ened total spectrum sensing time, but also already activated WSAPs to shorten their intermediate spectrum sensing time in the active state. Upon detecting unexpected appearance of primary users, all WSAPs perform spectrum sensing while their session is alive. For instance, in [4], WSAPs perform spectrum sensing at least once every 60 seconds, and within two seconds, WSAs are to vacate their operating channel if they detect the appearance of any primary users on their operating channel. To minimize the burden of spectrum sensing in every 60 seconds, we expect that WSAPs will scan their operating channel and one more channel, instead of all channels, at each periodic scan as the WiFi devices do. WSPAs can use the saved time to transmit more user data as a result of decrease in the number of channels for spectrum sensing. With the assistance of the proposed framework, activated WSAPs can recognize the appearance of primary users if neighboring WSAPs informed the RRM server of the existence of primary users. This cooperation between WSAPs and the RRM server can contribute to the early vacancy from white space channels. Based on these observations, we expect that the proposed cross-layer framework that integrates WSAPs and the RRM server can enhance the dynamic spectrum map management through the life cycle of the spectrum map.
References
[1] Federal Communications Commission, “FCC Adopts Rules for UnlicensedUse of Television White Spaces,” November 2008.
[2] “IEEE 802.22 Working Group on Wireless Regional Area Networks,”http://www.ieee802.org/22/.
[3] White Space Database Group, “Tech Industry Leaders Join to Develop Guidelines for White Spaces Database,” January 2009,http://www.google.com/intl/en/press/pressrel/20090204
whitespaces.html.
[4] J. Wang, M. S. Song, S. Santhiveeran et al., “First Cognitive Radio Networking Standard for Personal/Portable Devicesin TV White Spaces,” http://www.ecma-international.org/publi-cations/files/drafts/tc48-tg1-2009-132.pdf.
[5] Q. Zhao and B. M. Sadler, “A survey of dynamic spectrum access: signal processing, networking, and regulatory policy,”
IEEE Signal Processing Magazine, vol. 24, no. 3, pp. 79–89,
2007.
[6] S. Pollin, “Coexistence and dynamic sharing in cognitive radio networks,” inCognitive Wireless Communication Networks, E. Hossainand and V. K. Bhargava, Eds., Springer, New York, NY, USA, 2007.
[7] W. Lemstra, “Cognitive Radio defying Spectrum Management Acollection of four (short) contributions,” inProceedings of the Conference on Competition and Regulation in Network
Industries (CRNI ’08), November 2008.
[8] I. F. Akyildiz, W.-Y. Lee, M. C. Vuran, and S. Mohanty, “NeXt generation/dynamic spectrum access/cognitive radio wireless networks: a survey,”Computer Networks Journal, vol. 50, no. 13, pp. 2127–2159, 2006.
[9] J. Lunden, Spectrum sensing for cognitive radio and radar
systems, Dissertation for the degree of Doctor of Science
[10] C. Cordeiro and K. Challapali, “C-MAC: a cognitive MAC protocol for multi-channel wireless networks,” inProceedings of the IEEE International Symposium on Dynamic Spectrum
Access Networks (DySPAN ’07, pp. 147–157, April 2007.
[11] M. M. Buddhikot, P. Kolodzy, S. Miller, K. Ryan, and J. Evans, “DIMSUMnet: new directions in wireless networking using coordinated dynamic spectrum,” inProceedings of the IEEE International Symposium on a World of Wireless, Mobile and
Multimedia Networks (WOWMOM ’05), pp. 78–85, 2005.
[12] Q. Zhao, L. Tong, and A. Swami, “Decentralized cognitive MAC for dynamic spectrum access,” inProceedings of the 1st IEEE International Symposium on Dynamic Spectrum Access
Networks (DySPAN ’05), pp. 224–232, November 2005.
[13] I. Stanojev, O. Simeone, Y. Bar-Ness, and T. Yu, “Spectrum leasing via distributed cooperation in cognitive radio,” inIEEE
International Conference on Communications (ICC ’08), pp.
3427–3431, May 2008.
[14] N. R. Suri and Y. Narahari, “An auction algorithm for procur-ing wireless channel in a heterogenous wireless network,” in Proceedings of the International Conference on Wireless and
Optical Communications Networks (WOCN ’08), April 2008.
[15] H. Zheng and L. Cao, “Device-centric spectrum manage-ment,” inProceedings of the 1st IEEE International Symposium
on Dynamic Spectrum Access Networks (DySPAN ’05), pp. 56–
65, November 2005.
[16] S. Shellhammer, J. C. Juniga, M. Goldhammer, and W. Hu, “CoexistenceTutorial Material,” IEEE 802 Whitespace Study Group, February, 2009.
[17] H. Urkowitz, “Energy detection of unknown deterministic signals,”Proceedings of the IEEE, vol. 55, pp. 523–531, 1972. [18] W. A. Gardner, “Signal interception: a unifying theoretical
framework for feature detection,”IEEE Transactions on
Com-munications, vol. 36, no. 8, pp. 897–906, 1988.
[19] L. Correia, Mobile Broadband Multimedia Networks:
Tech-niques, Models and Tools for 4G, Academic Press, New York,
NY, USA, 2006.
[20] P. Gill, M. Arlitt, Z. Li, and A. Mahanti, “YouTube traffic characterization: a view from the edge,” in Proceedings of the 7th ACM SIGCOMM Internet Measurement Conference
(IMC ’07),pp. 15–28, November 2007.
[21] M. C. Weigle, “Improving confidence in network simulations,”
inProceedings of the Winter Simulation Conference (WSC ’06),