DOI: 10.15662/ijareeie.2014.0307052
Wireless Sensor Network for Greenhouse
Automation
Tushar C. Korade1, Dr. A.A. Shinde2
Research Fellow [Electronics-VLSI], Department of Electronics, BVDU College of Engineering, Pune, India1 Professor [Electronics-VLSI], Department of Electronics, BVDU College of Engineering, Pune, India2
ABSTRACT: In recent trend we are coming across various challenges in the field of farming. One important part of this is Green house. We have to control the climatic conditions of green house. To make this effective we have to record climatic conditions in each part of the green house. Here we can’t use cables to make out automation less expensive. Also measurement using the cable is tedious job. Thus, a Wireless network consisting of various sensors, controllers, transmitters and receivers is used. In this work, we have developed a Wireless sensor network for greenhouse monitoring and tested it in field. Here we studied different climatic conditions which directly affects crops. This is our small work in this field of Greenhouse automation using Wireless sensor node. In future we can build more complex networks.
KEYWORDS: Wireless sensor node, Greenhouse automation.
I. INTRODUCTION
In the modern world not a single field is not remain where the automation is not reached, One of them but an important field that we are considering below is not only a useful field but it plays an important role to produce atmospheric conditions as per our requirement that is shortly we are discussing with Green house automation.
Now a day due to the tremendous changes in the environment because of so many natural effects like earthquake etc. the balance of the earth is disturbed and these changes directly affects the atmospheric changes. Again we are very well aware to do the farming different crops and different plants require different atmospheric conditions. If the atmospheric conditions are not matches then it definitely affects the quality of the output and indirectly the profit reduces. Considering this point different experiments are done for the controlling the various parameters of the atmosphere like temperature, humidity on a certain limited area and for this certain electronic equipments are used, on the another side it is observed there is need of atomize system which can able to control the different parameters. Along with this to take further step ahead the water management and the medicine spray management also needed.
II. LITERATURE SURVEY
In various fields we are seeing different types of sensors used. Sensors are used in traffic signal controlling, restricted access, various electronic equipment control, industries uses sensors for temperature, pressure, flow and power control. Various environmental changes can be monitored with the help of sensors. In the field of medical sensors plays vital role. With the help of sensors in medical field we are reducing medical cost.
In our life we are using sensors for monitoring, detection and collection of data. We can use wired and wireless sensors. Wired sensors are more effective but it has some limitations like its installation, portability, size, complexity, cost etc. These all limitations are overcome with the help of wireless sensors. Wireless sensors are easy to install, robust, flexible to reallocate etc.
The central repository is used. We need to store the collected data to this central repository. Security of the data and its transmission are key factors along with power and cost reduction.
III. OVERVIEW OF WIRELESS SENSOR MONITORING SYSTEM
DOI: 10.15662/ijareeie.2014.0307052
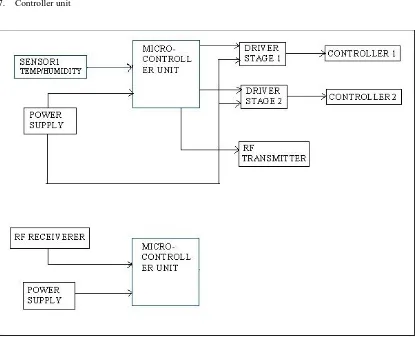
1. Microcontroller 2. Sensors
3. RF Transmitter and Receivers pair 4. LCD display
5. Power supply 6. Driver stages 7. Controller unit
Figure 1: Block Diagram of Wireless Sensor Monitoring System.
DOI: 10.15662/ijareeie.2014.0307052
automatically to start the fan. If it is increased beyond standard value then heater turns on automatically. Thus for taking control action driver stages and controller units are used.
Advantage
1. Use of sensors in the project reduces the Human intervention required in monitoring and taking control action.
Applications
1. This project is used to monitor Greenhouse atmosphere and take comtrol action. 2. Security and Tracking
3. In medical instrument
4. Automation in various factories.
5. Structural Monitoring in the field of construction 6. Traffic engineering
TEMPERATURE SENSOR LM35:-
Calibrated directly in ° Celsius (Centigrade)
Linear + 10.0 mV/°C scale factor
0.5°C accuracy guarantee able (at +25°C)
Rated for full −55° to +150°C range
Suitable for remote applications
Operates from 4 to 30 volts
Less than 60 μA current drain
Low self-heating, 0.08°C in still air
Nonlinearity only ±1⁄4°C typical
Low impedance output, 0.1 W for 1 mA load
HUMIDITY SENSOR SY-HS-220:-
Terminals:SY-HS-220: B - GND, W - VOUT, R - VCC, G – RT Supply voltage: 5 V DC
Supply current: ≤ 3,0 mA
Operating temperature: 0°C to +60°C
Accuracy: ±5% RH
Humidity range:30-90 RH
Dimensions: 30x43x10 mm
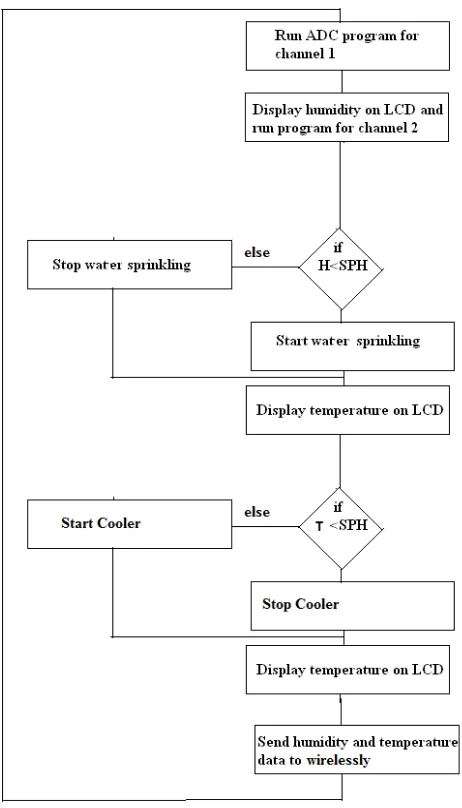
FLOWCHART FOR TRANSMITTER SIDE
At transmitter section we have various sensors with the help of which we are collecting data and process it further. The collected data is in the analog form, so we need to convert it first into corresponding digital value. To convert analog data to digital format here we have used 8 bit ADC. Hence we can have 8 different sensors. According to the application one can change the sensor nodes.
Transmitter section further sends data to receiver end where it get compared with the threshold value and the control signal is getting generated according to which action will be taken, In our application we have used temperature
DOI: 10.15662/ijareeie.2014.0307052
Figure 2: Flowchart for Transmitter side
FLOWCHART FOR RECEIVER SIDE
DOI: 10.15662/ijareeie.2014.0307052
Figure 3: Flowchart for Transmitter side
IV. RESULT
Transmitter Section:
Here we have considered to sensors, temperature and humidity. Results are displayed at two terminals, Terminal 1: Humidity.
DOI: 10.15662/ijareeie.2014.0307052
At transmitter section we have connected to sensors Humidity and temperature. These two sensors records data and send it to the receiver section.
In this particular example Humidity recorded is %RH: 67 and temperature is 280 C.
Receiver Section:
At receiver section we are getting the required results. Here we have a program to compare the values with the threshold set. And further we are taking the control action. We have used sprinkler and blowers to perform control action.
V. CONCLUSION
DOI: 10.15662/ijareeie.2014.0307052
We presented a tutorial of the current state-of-the-art for wireless sensor nodes, investigating and analysing some of the architectural challenges posed by these devices. A great variety of sensor nodes already exist, proving this is a recent and very interesting research topic.
REFERENCES
1. Tushar C. Korade, A. A. Shinde. “STUDY OF WIRELESS SENSOR NETWORKS” International Journal of Electrical, Electronics and Data Communication, ISSN: 2320-2084 Volume-2, Issue-3, March-2014
2. Ajay V. Deshmukh. “Microcontrollers [Theory and Applications]”, the McGraw-Hill Companies, 2nd Edition, Page no. 115 to 211 & 236 to 239.
3. H. Liu, Z. Meng and S. Cui, “A Wireless Sensor Network Prototype for Environmental Monitoring in Greenhouses” presented at Wireless Communications, Networking and Mobile Computing 2007 (WiCom 2007), International Conference on 21-25 Sept. 2007 Page(s): 2344 – 2347.
4. Sensinode (2007). NanoStack manual v1.0.1. [Online]. Available: www.sensinode.com.
5. Greenhouse guide. (Referred 20.04.2008). [Online]. Available: http://www.littlegreenhouse.com/guide.shtml.