Analysis of Different Temperature Sensors for Space
Applications
Shayama SubairP
1
P
and Lizy AbrahamP
2 P P 1 P
Department of ECE, LBS Institute of Technology for Women, Poojappura Trivandrum, Kerala, India
P
2
P
Department of ECE, LBS Institute of Technology for Women, Poojappura Trivandrum, Kerala, India
Abstract
In this paper, a temperature measurement using DS18B20 is implemented which is an economic and feasible method. This study mainly deals with the applicability of DS18B20 and other sensors in space applications. Temperature is an important parameter to monitor. The total process consists of sensing of the temperature using RTD, Thermocouple, LM35, DS18B20 , PIC16F877A and sent to PC using RS232 serial interface, display in the way of digital and waveform using a real time software Lab VIEW (Laboratory Virtual Instrumentation Engineering Workbench) of National Instruments, USA and comparing with conventional sensor used in industry.
32T
Keywords32T: RTD, Thermocouple, LM35, 33TDS18B20 temperature sensor, PIC16F877A, RS232, LabVIEW
1. Introduction
Temperature is a common parameter to be controlled and closely related with our daily lives, industrial production and space applications. Temperature is an important component of modern detection technique. Temperature monitoring system has two kinds of shortcoming in current life. One is that it needs a lot of wires to transfer the sensor signal to data acquisition card and the implementation of linking signal wires is very troubling. Also, the cost is high. The other shortcoming is that the signal transferred in wire is analog signal. Designing high-performance temperature measurement systems has great significance in many practical applications for modern significance. In this paper, as the background of compensation and applications of the sensors temperature characteristics, DAQ based RTD, Thermocouple, LM35 analysis and a novel intelligent temperature detecting system based on PIC16F877A and DS18B20 [1]-[4] is designed and implemented. The system uses single-bus digital temperature sensor DS18B20 as mining temperature component produced by DALLAS, PIC16F877A as the master processing chip. Also sent to PC by using RS-232 serial interface and display it using the real time software LabVIEW.
2. System design
System design framework is shown as Fig.1, from which we can see the system consists of PIC, temperature sensors, PC machine and an indicator. In which RTD, Thermocouple, LM35 DS18B20 are the temperature collection components and pressure gauge and BMP180 are the pressure collection components, responsible for the actual temperature and pressure sensitiveness, and sending the collected data to master chip PIC16F877A by a single bus. The main chip processes the received data and converts it into standard units. Simultaneously, on the one hand, send them to the host computer PC through its serial communication. An indicator is provided for checking the PIC functioning.
Fig.1 Framework map of system design
3.
System
Hardware
Design and
Implementation
3.1 Design and implementation of PIC external
circuit
needed, pin 32 can be directly connected to the VCC. At the same time, taking into account the PIC16F877A microcontroller has a clock inside the circuit, so only need to access timing control component in its OSC1/CLKI OSC2/CLKO pins to form a stable self-excited oscillator. When using the crystal and capacitors to form the resonant circuit, in principle, there are no strict requirements with the C1 and C2, but considering the size of capacitor usually affects the stability of the oscillator oscillation and the fast of vibration, therefore, usually capacitor selects 15 ~ 35pF or so, this design chooses 20MHz crystal and 22pF capacitors, the specific circuit design is shown in Figure 2.
Fig.2 PIC external crystal oscillator circuit
3.2 Design and implementation of DS18B20
temperature sensor interface circuit
As DS18B20 is a single bus device, so the work of the circuit is simple, just power on and complete the data transmission. DS18B20 can be set to two power supply, data bus power supply and external power supply. Using data bus power supply can save a wire, but it takes longer to complete the temperature measurement, while using an external power supply, the measurement speed is faster although using another wire. Since this system, only a temperature sensor is connected, so adopts external power supply mode, attach a 4.7k pull-up resistor on the bus into pull up the power level, the specific of the interface circuit is shown as Figure3.
Fig.3 DS18B20 interface circuit
4. Design and Implementation of System
Software
4.1 Design and implementation of PIC program in
MPLAB
PIC programming is done using MPLAB0T0TIntegrated
Development Environment0T0T(IDE) which is a gratis, integrated toolset for the development of0T0Tembedded
applications0T0Ton
Microchip's0T0TPIC0T0Tand0T0TdsPIC0T0Tmicrocontrollers. The system
Fig.5 DS18B20 Reset diagram
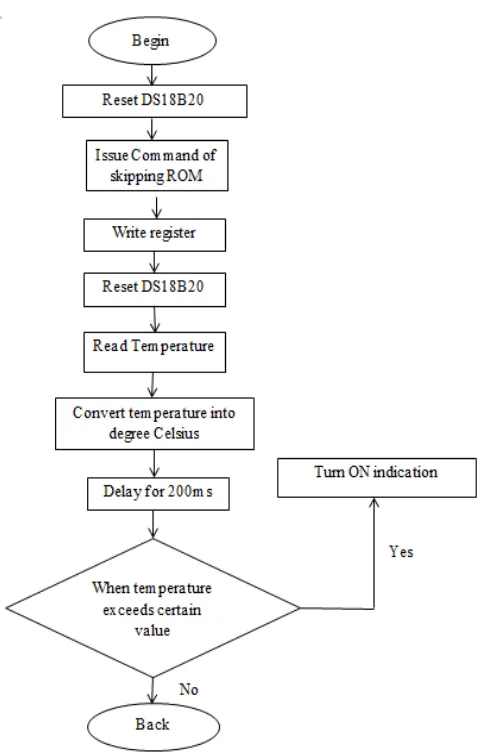
Figure 5 is the design process of DS18B20 reset program, each operation of DS18B20 [5], [6] requires a command of its reset, Figure6 is a design process of writing a command to DS18B20, Figure 7 is a design process of reading data from DS18B20, Figure 8 is the design process of PIC reading the temperature data and indicating using LED whether the chip is working or not.
Fig.6 Write Command to DS18B20
Fig.7 Read Command to DS18B20
According to the above process flow diagram, you can easily write the specific procedure code and compile. After the compilation is successfully completed the program is burned to PIC16F877A. If the LED is turned OFF, this means that the PIC external circuit is not working or some error during burning. Then circuit connection is checked and it is rewired or the voltage flow through each component is verified.
Fig.8 Program design process of MCU reading the temperature data, LED indication
5. Program design of PC using LABVIEW
The temperature measurement system stored the raw data in flash chip and uploaded them to PC through RS232 serial communication interface. LABVIEW [7] and its data acquisition system is used to read data in the form of digital and waveform, simultaneously, display visually on the host computer using the main program interface in LabVIEW. The block diagram in LabVIEW mainly includes the serial port selection, begin detection/stop detection, current temperature display window and temperature change waveform. VISA Configure Serial port initializes the serial port specified by 43T
VISA
resource name
43T to the specified settings. Wire data tothe 43T
VISA resource name
43T input to determine thepolymorphic instance to use or manually select the instance. The rate of transmission through RS232 is
9600.The time required for the write and read operations is 1000 milliseconds and one stop bit. The number of bits is required for data transmission is eight.
6. Experimental results
In order to test and verify the effectiveness of the temperature measurement systems designed in this paper, different experiments are carried out at high and low temperature with the system. In the experiment, set the temperature of high and low temperature dropping from 40 ℃ to 25 ℃, then rising from 50 ℃ to 65 ℃, change and detect the data every 3 ℃,then compare the error between the detected temperature and the set standard temperature. The sensor response to high and low temperature is good, Figure.9 is the response curve for cooling, and Figure.10 is the response curve for heating. The experimental details of the high and low temperature detection experiment are shown in Table 1. From the experimental test data in Table 1, we can see clearly, the standard error of the detected temperature with this system and actual set temperature value at each temperature point is no more than 0.7 ℃, which indicates the proposed temperature measurement system is correct and effective.
Table 1 Detected temperature data Cool
Temper-ature(/P
0
P
C)
Detected Temper-ature(/P
0
P
C)
Warm Temper-ature(/P
0
P
C)
Detected Temper-ature(/P
0
P
C)
40 40.6 50 50.7
37 37.7 53 53.6
34 34.5 56 56.7
31 31.5 59 59.5
28 28.8 62 62.7
25 25.5 65 65.8
Fig.10 Response curve for heating
7. Comparison with other sensors
The temperature variation of all the sensors is found out and the response time, settling time of different sensors are plotted.
Fig.11 Response Time Curve
From Fig 11 it is clear that the response time of DS18B20 is almost similar to RTD. So it can replace RTD. The settling time is less compared to RTD .So from the above curves the overall behavior of DS18B20 is better compared to other sensors.
Fig.12 Settling Time Curve
8. Conclusion
Temperature is one of the important parameters in the actual industrial processes, designing efficient temperature measurement system has been the focus of the work. In this paper, take the temperature measurement using RTD, thermocouple, LM35, DS18B20 and PIC16F877A and introduce a design methodology and implementation of such detection system temperature measurement system in details, which has strong practical value. Simultaneously, it should also be noted that the sensor is the core device of temperature detection system, whose performance parameters directly affects the accuracy of the detected temperature. The Experimental result shows that the
temperature detected with DS18B20 has better
performance and its accuracy is ±0.58℃, which
determines the scope of its utility, can only be the aspect where the accuracy of the temperature is not very high.
References
[1] Jie LI, Qiao JIANG, Xi-ning YU, Ying DU ” Intelligent Temperature Detecting System”,IEEE transactions on Intelligent System Design and Engineering Application,2010
[2] Abhishek Mallik and Sauvik Das Gupta,” Modelling of MEMS based Temperature sensor and temperature control in a petrochemical industry using LabVIEW.”,IEEE transactions on Computer and Automation Engineering,2009
[3] WANG Li-xin, YANG Shao-qing, ZHENG Hong-jun,” Temperature measurement method and temperature sensor”. Liaocheng Teachers College.2005, 12(01):32-34.
0 5 10 15 20
Response Time
0 10 20 30 40 50 60 70 80
[4] ZHANG Jin-min. “Application of single-bus digital temperature system based on DS18B20”. Chinese instruments. 2005(03):86-88.
[5] MA Jin, LI Xiao-guang, NING Wei. “Theory and development of several commonly used temperature sensors”. Chinese instruments.2004 (04) :1-4.
[6] WEI Ying-zhi.” Application of DS18B20 in temperature control.” Coal Mine Machinery 2005(03):92-94.
[7] S Kohout, J Roos and H Keller Physik-Institut,Universität Zürich,Winterthurerstrasse 190,8057Zürich,Switzerland “Automated operation of a homemade torque magnetometer using LabVIEW.”
[8] Quentin L. Willard, Austin M. Bartlett, Louis S. Harrington, and Jason C. McKay, Ernest Y. Wong, “A Systems Approach to Autonomous Space Exploration”, IEEE, EISBN : 978-1-4244-1286-0, April 2007, pages 1-5.
Shayama Subair got her degree in Electronics and Communication
engineering from College of Engineering, Trivandrum in 2012. She is currently pursuing her M.Tech in Signal Processing from the Department of Electronics and Communication Engineering, LBSITW, Trivandrum. She has participated in few national conferences and has published an embedded system and controller design paper.
Lizy Abraham is pursuing a PhD in satellite images, and is presently