ISSN (Print) : 2320 – 3765 ISSN (Online): 2278 – 8875
I
nternational
J
ournal of
A
dvanced
R
esearch in
E
lectrical,
E
lectronics and
I
nstrumentation
E
ngineering
(An ISO 3297: 2007 Certified Organization)
Vol. 4, Issue 4, April 2015
Performance Analysis of LTE Downlink
Dakuri Chiranjeevi, K Shresta, G Rajitha, Deepa
Dept.of ECE, Trinity College of Engineering and Technology, Karimnagar (TS), India
ABSTRACT-This paper analyzes the performance of down link of Long Term Evolution using System Level Simulator from [1]. The results obtained concern the sector throughput and BLER (Block Error Rate), the user throughput and the corresponding CQI (Channel Quality Indicator) during all simulation period. The scenarios considered SISO, different CLSM antenna configurations, five packet scheduling strategies and different number of users in the cell.
KEYWORDS- LTE, SISO, CLSM
I.
INTRODUCTIONLong Term Evolution (LTE) is the name given to a 3GPP (3 rd Generation Partnership Project) concerning UTRAN (Universal Terrestrial Radio Access Network) evolution to Meet the needs of future broadband cellular communications. This project can also be considered as a milestone towards 4G (Fourth Generation) standardization. The requirements set for LTE specified in envisage high peak data rates, low latency, increased spectral efficiency, scalable bandwidth, flat all-IP network architecture, optimized performance for mobile speed, etc. In order to fulfill this extensive range of requirements several key technologies have been considered for LTE radio interface of which the most important are: multiple-access through Orthogonal Frequency Division Multiple Access (OFDMA) in downlink and Single Carrier Frequency Division Multiple Access (SC-FDMA) in uplink and multiple-antenna technology.
II. OVERVIEW OF LTE DOWNLINK
The LTE down link is mainly characterized by OFDMA as multiple access scheme and MIMO (Multiple Input Multiple Output) technology. The benefit of deploying OFDMA technology on down link LTE is the ability of allocating capacity on both time and frequency, allowing multiple users to be scheduled at a time. The minimum resource that can be assigned to a user consists of two Physical Resource Blocks (PRBs) and it is known as chunk or simply Resource Block (RB). In downlink LTE one PRB is mapped on 12 subcarriers (180 kHz) and 7 OFDM symbols (0.5 ms) and this is true for non-MBSFN (Multimedia Broadcast multicast service Single Frequency Network) LTE systems and for normal CP (Cyclic Prefix). Scheduling decisions can be made each TTI (Time Transmission Interval) that in LTE is equal to 1 ms [2]. System performance and individual end user experience depend on the propagation conditions, the mobile device feedback, which is based on measurements, and the scheduling algorithm in the eNodeB (EvolvedNodeB).
The rest of the paper is organized as follows. Overview of LTE downlink is presented in section II. Description of System Level Simulation in the section III and Simulation and result discussion is presented in the section IV. Finally, section V concludes the paper.
III. LTE SYSTEM LEVEL SIMULATOR
ISSN (Print) : 2320 – 3765 ISSN (Online): 2278 – 8875
I
nternational
J
ournal of
A
dvanced
R
esearch in
E
lectrical,
E
lectronics and
I
nstrumentation
E
ngineering
(An ISO 3297: 2007 Certified Organization)
Vol. 4, Issue 4, April 2015
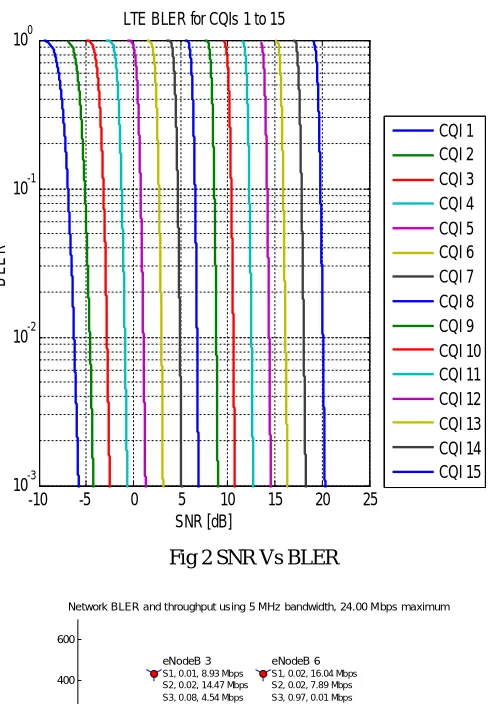
receiver SINR and the transmission parameters (e.g., modulation and coding)[3]. Fig. 2 shows LTE BLER for CQIs 1 to 15 based on the receiver SINR.
IV. SIMULATION AND RESULTS
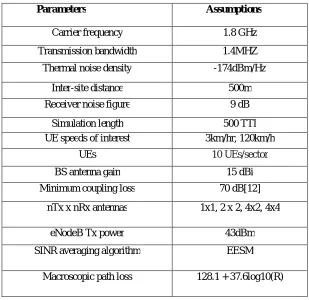
For the first scenario simulated it was selected 1.8 GHz as carrier frequency, 1.4MHz system bandwidth, SISO antenna technology, RR scheduler, 10 UE per eNodeB sector, means70 UEs, UEs speed 3km/h, Typical Urban as channel model, inter eNodeB distance 500 m. The UEs are randomly positioned in the cells.
TABLE I: SIMULATION PARAMETERS
ParamParameters eters AssumAssumptions
s
Carrier frequency 1.8 GHz
Transmission bandwidth 1.4MHZ
Thermal noise density -174dBm/Hz
Inter-site distance 500m
Receiver noise figure 9 dB
Simulation length 500 TTI UE speeds of interest 3km/hr, 120km/h
UEs 10 UEs/sector
BS antenna gain 15 dBi
Minimum coupling loss 70 dB[12]
nTx x nRx antennas 1x1, 2 x 2, 4x2, 4x4
eNodeB Tx power 43dBm
SINR averaging algorithm EESM
Macroscopic path loss 128.1 + 37.6log10(R)
ISSN (Print) : 2320 – 3765 ISSN (Online): 2278 – 8875
I
nternational
J
ournal of
A
dvanced
R
esearch in
E
lectrical,
E
lectronics and
I
nstrumentation
E
ngineering
(An ISO 3297: 2007 Certified Organization)
Vol. 4, Issue 4, April 2015
-10 -5 0 5 10 15 20 25
10-3 10-2 10-1 100
SNR [dB]
B
L
E
R
LTE BLER for CQIs 1 to 15
CQI 1 CQI 2 CQI 3 CQI 4 CQI 5 CQI 6 CQI 7 CQI 8 CQI 9 CQI 10 CQI 11 CQI 12 CQI 13 CQI 14 CQI 15
Fig 2 SNR Vs BLER
-600 -400 -200 0 200 400 600 800 1000
-600 -400 -200 0 200 400 600
eNodeB 1 eNodeB 2
eNodeB 3
eNodeB 4 eNodeB 5
eNodeB 6
eNodeB 7
Network BLER and throughput using 5 MHz bandwidth, 24.00 Mbps maximum
x pos [m]
y
p
o
s
[
m
]
S1, 0.00, 15.50 Mbps S2, 0.01, 14.40 Mbps S3, 0.00, 18.05 Mbps S1, 0.01, 10.52 Mbps S2, 0.03, 9.62 Mbps S3, 0.06, 3.20 Mbps
S1, 0.01, 8.93 Mbps S2, 0.02, 14.47 Mbps S3, 0.08, 4.54 Mbps
S1, 0.03, 16.72 Mbps S2, 0.03, 17.33 Mbps S3, 0.01, 14.07 Mbps S1, 0.01, 11.64 Mbps S2, 0.02, 11.93 Mbps S3, 0.09, 3.19 Mbps
S1, 0.02, 16.04 Mbps S2, 0.02, 7.89 Mbps S3, 0.97, 0.01 Mbps
S1, 0.10, 3.01 Mbps S2, 0.03, 0.84 Mbps S3, 0.10, 1.90 Mbps
ISSN (Print) : 2320 – 3765 ISSN (Online): 2278 – 8875
I
nternational
J
ournal of
A
dvanced
R
esearch in
E
lectrical,
E
lectronics and
I
nstrumentation
E
ngineering
(An ISO 3297: 2007 Certified Organization)
Vol. 4, Issue 4, April 2015
-600 -400 -200 0 200 400 600 800 1000
-600 -400 -200 0 200 400 600 eNodeB 1 eNodeB 2 eNodeB 3 eNodeB 4 eNodeB 5 eNodeB 6 eNodeB 7
Network BLER and throughput using 5 MHz bandwidth, 24.00 Mbps maximum
x pos [m]
y p o s [ m ]
S1, 0.72, 0.64 Mbps S2, 0.09, 1.04 Mbps S3, 0.36, 12.72 Mbps S1, 0.03, 7.84 Mbps S2, 0.80, 3.82 Mbps S3, 0.01, 10.17 Mbps
S1, 0.05, 5.30 Mbps S2, 0.02, 10.17 Mbps S3, 0.04, 3.15 Mbps
S1, 0.04, 3.74 Mbps S2, 0.02, 10.14 Mbps S3, 0.02, 9.23 Mbps S1, 0.04, 3.20 Mbps S2, 0.02, 8.08 Mbps S3, 0.03, 3.18 Mbps
S1, 0.03, 13.55 Mbps S2, 0.23, 14.12 Mbps S3, 0.08, 18.20 Mbps
S1, 0.04, 2.40 Mbps S2, 0.04, 18.08 Mbps S3, 0.03, 5.57 Mbps
Fig 4 Network BLER and throughput at 1.4MHz and UE speed at 100 km/h
1 2 3 4
5 0 5
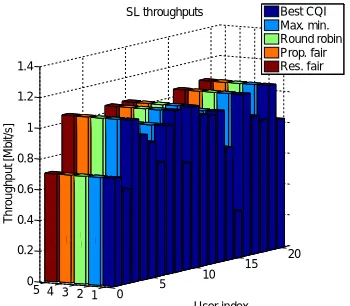
10 15 20 0 0.2 0.4 0.6 0.8 1 1.2 1.4 User index SL throughputs T h ro u g h p u t [M b it /s ] Best CQI Max. min. Round robin Prop. fair Res. fair
Fig 5 Comparison of algorithms
8 10 12 14 16 18 20 u g h p u t [M b /s ]
Throughput, 1.4 MHz
SISO 1x1 CLSM 2x2 CLSM 4x2 CLSM 4x4 0.4 0.5 0.6 0.7 0.8 0.9 1 F (x )
ISSN (Print) : 2320 – 3765 ISSN (Online): 2278 – 8875
I
nternational
J
ournal of
A
dvanced
R
esearch in
E
lectrical,
E
lectronics and
I
nstrumentation
E
ngineering
(An ISO 3297: 2007 Certified Organization)
Vol. 4, Issue 4, April 2015
Fig 5 shows the comparison of five scheduling algorithms against throughput and users.
Fig 6 shows comparison among the different antenna configurations. As it is expected that CLSM with 4x4 antenna configuration gives you the higher throughput it approximately it is 3 times higher than the SISO and 2 time higher CLSM 2x2. Spectral efficiency almost in reverse situation where CLSM 4x4 configuration is shown poor spectral efficiency than the other configurations.
V. CONCLUSION
This paper evaluates the mobility and interference of downlink LTE using System Level Simulator. First, it was analyzed the impact of the users speed, for that several simulations has been done with different user speeds and is presented in Fig. 3 and Fig. 4 with 5km/h and 100km/h, on comparing both figures, it is observed there was a strong decrease in user and sector throughput because the feedback cannot follow the fast fading. Second it was analyzed MIMO throughput. As it is expected that CLSM with 4x4 antenna configuration gives you the higher throughput it approximately it is 3 times higher than the SISO and 2 time higher CLSM 2x2. Finally it is observed that
Selection of scheduling algorithm shows considerable impact on the throughput. LTE performance depends on lots of parameters and configuration chosen, but through these simulations, several LTE expectations have been achieved.
REFERENCES
[1] J.C. Ikuno, M. Wrulich, M. Rupp, System level simulation of LTE networks, in Proc. 2010 IEEE 71st Vehicular Technology Conference, Taipi,
Tiawan, may 2010. Available at htt://public.tuwien.ac.at/files/PubDat_184908.pdf [2] Onna IOSIF, Ion BANICA, U.P.B. Sci. Bull., Series C, Vol. 75, Iss. 1, 2013
[3] Christian Mehlführer * , Josep Colom Ikuno, Michal Šimko, Stefan Schwarz, Martin Wrulich and Markus Rupp, The Vienna LTE simulators – Enabling reproducibility in wireless communications research, EURASIP Journal on Advances in Signal Processing 2011, 2011:29
[4] 3GPP TS 36.211 V8.5.0 (2008-12), “Evolved Universal Terrestrial Radio Access (EUTRA) Physical Channels and Modulation (Release 8)”. [5] 3GPP TS 36.212 V8.5.0 (2008-12) , “Evolved Universal Terrestrial Radio Access (EUTRA) Multiplexing and channel coding (Release 8)”. [6] Albert Serra Pagès , MSc Thesis ,,A Long Term Evolution Link Level Simulator”, University of Catalunya, February, 2009
[7] Technical Specification Group RAN, E-UTRA; LTE RF system scenarios, 3GPP, Tech. Rep.TS 36.942, 2008-2009