R E S E A R C H
Open Access
Performance analysis of generalized QAM
modulation under
η
−
μ
and
κ
−
μ
fading
Wamberto J L Queiroz
1,3, Francisco Madeiro
2*, Waslon T A Lopes
1,3and Marcelo S Alencar
1,3Abstract
This paper presents new closed-form expressions for the symbol error probability (SEP) ofθ-QAM modulation with maximum ratio combining (MRC) receiver underη−μandκ−μfading. The SEP formulae, obtained from the definite integrals of the moment generating function (MGF) of the signal-to-noise ratio (SNR) at the input of the MRC receiver, are written in terms of Lauricella functions. The numerical evaluation of the expressions is carried out for the
η−μdistribution, which includes important distributions as special cases, such as Hoyt, Nakagami-m, Rayleigh, and one-sided Gaussian, as well as for theκ−μdistribution, which includes Rice, Nakagami-m, Rayleigh, and one-sided Gaussian as special cases.
1 Introduction
Two-dimensional signal constellations with suppressed carrier, such as quadrature amplitude modulation (QAM) schemes, are widely used in communication systems in a variety of applications, such as modems with asyn-chronous transmission, digital television, and cooperative systems [1,2].
In [3], the rectangular QAM modulation schemes are evaluated with maximum ratio combining (MRC) receivers andη−μcorrelated fading, while in [4], these schemes are employed to evaluate the performance of the MRC receiver considering imprecise knowledge of the state of the Rician fading channel. In applications involving asymmetric digital subscriber lines and digi-tal video broadcasting-cable, cross QAM schemes have been adopted. The error probability of cross QAM with MRC reception over generalizedη−μfading channel was presented in [5].
Before 2002, the evaluation of the fading effects in the reception of the M-QAM schemes was performed by means of approximate mathematical expressions. In 2002, Cho and Yoon [6] found exact expressions for the bit error probability (BEP) of QAM schemes under addi-tive white noise. An extension of that work for Nakagami
*Correspondence: [email protected]
2Polytechnic School of Pernambuco, University of Pernambuco, Recife, Pernambuco, Brazil
Full list of author information is available at the end of the article
fading was presented in [7]. Then, the evaluation of struc-tures such as the MRC receiver withM-QAM was per-formed by means of exact expressions. The MRC receiver has been proposed in coherent demodulation schemes for environments with Rayleigh and Nakagami fading [8-10].
Since 1962, when the square QAM (SQAM) modu-lation was introduced [11], different geometries for the QAM constellation have been proposed. Motivated by aspects such as minimization of the symbol error prob-ability (SEP) and implementation complexity, a new con-stellation geometry was proposed in [12], the so-called triangular quadrature amplitude modulation (TQAM), for which the symbols associated with the transmitted sig-nals are located in the vertices of contiguous triangles [13].
As an attempt to improve the power gain, Park and Byeon presented in [14] an alternative configura-tion for the triangular constellaconfigura-tion and proposed con-stellations with irregularly distributed symbols while preserving the triangular structure. By means of the-oretical analysis and simulations, they showed how to obtain a 0.62-dB power gain with respect to the SQAM constellation and a 0.20-dB power gain with respect to the TQAM regular constellation for a 10−6 symbol error rate with 64-symbol constellations. The mathematical analysis of the effects of changing the QAM constellation angle θ gave rise to a modula-tion scheme referred to as parametric θ-QAM, which
includes the SQAM and TQAM schemes as special cases [15,16].
The calculation of exact expressions for the SEP or BEP of a modulation scheme under fading means, in many cases,that the expressions for additive white Gaussian noise are weighted by the probability density function of the signal-to-noise ratio for a given fading. One of the most used structures to improve the BEP and SEP of QAM schemes under different types of fading is the MRC receiver [17]. In [18], the effect of the diversity provided by that structure was evaluated, through the BEP parameter, for square M-QAM and rectangular R -QAM and different types of fading, modeled by distinct distributions.
The analysis of BEP and bit error (BER) in optical wireless links, also known as free-space optics (FSO), has received much attention in recent years. In [19], the authors show that the turbulence-induced fading caused by atmospheric conditions can be modeled as multiplica-tive random process which follows theKdistribution. The authors also present approximated closed-form expres-sions for the average BER of single-input multiple-output (SIMO) FSO systems. Alternatively, for FSO channels, the fading can be modeled by log-normal or gamma-gamma distributions [20,21].
This paper proposes the use of the MRC receiver jointly with θ-QAM modulation and gives new mathematical expressions for the SEP under η− μ and κ − μ fad-ing, modeled by κ − μ and η − μ distributions. The MRC receiver provides an additional degree of freedom for the performance control of the systems, and the prob-ability distributions used to model the fading provide a unification of the mathematical analysis since they char-acterize different types of fading. One of the contributions of this paper is the derivation of exact expressions for the SEP, written in terms of hypergeometric Lauricella functions.
The paper is organized as follows: In Section 2, the average SEP for an MRC receiver withNbranches is pre-sented in terms of the moment generating function (MGF) forη− μand κ −μ fading. In Section 3, the MGF of the signal-to-noise ratio (SNR) per branch of the MRC receiver is adjusted to the problem under consideration. In Sections 4 and 5, new SEP expressions are provided in terms of Lauricella functions. In Section 6, curves of SEP are presented for different sets of parameters. Section 7 presents the conclusions of the paper.
2 Symbol error probability under generalized fading
This section presents the calculation of the average SEP of aθ-QAM scheme underη−μandκ−μfading and MRC diversity. The main objective is to show that this
probability can be written in terms of definite integrals of the MGF of SNR per branch of the MRC receiver. In the family of θ-QAM schemes, presented in [15], the authors obtained the expression given in Equation 1 to evaluate the SEP under additive white Gaussian noise:
Ps(γ,θ,M)=c1c2
π+θ 2
π−θ 2
exp(−γ δ2csc2(φ))dφ
+c1c23
π−θ θ
exp(−γ δ2csc2(φ)sec2
θ 2
sin2(θ ))dφ
+c1c4
π
π−θ 2
exp(−γ δ2csc2(φ))dφ
+c1c5
π+2θ 2
π−θ 2
exp(−γ δ2csc2(φ))dφ
+c1c6
π
2θ
exp(−4γ δ2csc2(φ)sin2(θ ))dφ.
(1)
In Equation 1, the parametersc1,c2,c3,c4,c5, andc6are related to the geometry of the constellationθ-QAM and are given by the following [16]:
c1= 2π1M c2=4(
√
M−2)(√M−1)
c3=
√
2(√M−1) c4=4
√ M
c5=4(
√
M−2) c6=2(
√ M−2),
(2)
in whichMrepresents the number of constellation sym-bolssm,n, whose coordinates(xm,yn)are
xm=
2(n−1)+1−√M
d+[2mod(m, 2)−1]a 2
yn= −
2(m−1)+1−√M
b
2,
(3)
withm =1,· · ·,√M,n= 1,· · ·,√M,a= 2dcosθ, and b = 2dsinθ, and mod(x,y) denotes the modulus opera-tion after division ofxbyy. Half of the Euclidean distance between adjacent symbols of the constellation is given by
d=
√ 6Eav
√
and is related to the parameterδand to the average energy per symbol,Eav, through the expression
δ= √d
In order to determine the SEP of theθ-QAM modula-tion scheme underη−μandκ−μfading, for an MRC receiver, it is necessary to average the symbol error prob-ability under additive white Gaussian noise conditioned to the instantaneous SNRγ at the MRC input. This con-ditional probability, denoted by P(E|γ ), corresponds to Ps(γ,θ,M)forγ =Nk=1γkat the MRC output, in which
the random variablesγkrepresent the instantaneous SNR in each of the N branches of the MRC receiver. The MRC structure withN branches makes decisions based on the signalsαie−jθis(t)+n
i(t), fori = 1, 2,· · ·,N, in
whichαi andθirepresent, respectively, the fading atten-uations and phase variations in the ith receiver branch, s(t)represents the transmitted signal modulated withθ -QAM, andni(t)represents the complex AWGN with zero
mean and varianceN0/2. The fading attenuationαican be
modeled asη−μdistribution as well asκ −μ distribu-tion. The phase shiftsθi are uniformly distributed in the
interval(0, 2π].
Therefore, the SEP, represented by Pas, can be calculated averaging Ps(γ,θ,M) by the joint
prob-Substituting Equation 7 into Equation 6, the SEPPascan be written as follows:
Pas=c1c2
random variableγk.
From Equation 8, one can notice that if the variables γkare independent and identically distributed with corre-sponding MGFMγ(s), then the SEPPascan be written as
Underη−μfading, an exact expression forPascan be obtained by adjusting the integration intervals to the inter-val [ 0, 1] in Equation 9. This is equiinter-valent to modify the integrands of the integral representation of the Lauricella hypergeometric function as follows:
In [15], the BEP was computed using the product of con-stants and integral expressions. The integrals are related to the SEP of each decision region of the θ-QAM con-stellation, and the constants are concerned with the num-ber of different bits between decision regions. It was assumed that the decision errors occur very close to the borders of these regions. In [15], these constants were presented as follows:
The BEP approximation obtained so far is highly accurate for medium and high values of SNR. In [16], corrected constants for the BEP were presented
c4=4
Using these new constants in Equation 9, one can obtain the BEP with MRC diversity effect.
3 MGF forη−μandκ−μfading
The expression presented in Equation 9 is evaluated in this article for the fading models characterized byη−μandκ− μdistributions. Both these fading models are extensively treated in [22].
The MGFs of these distributions were presented in [23] in a more compact form than their expressions presented in [24],
To evaluate the SEP in Equation 9, one needs to cal-culate Mγ(s) fors = δ2csc2(φ), 4δ2sin2(θ )csc2(φ) and δ2sec2 θ2sin2(θ )csc2(φ)and perform the integrations in Equation 9.
The parametersh andH of Equation 13 can be writ-ten in terms of the parameter η, respectively, as h = (2+η−1+η)/4 andH = (η−1−η)/4 for format 1 and h = 1/(1−η2) and H = η/(1−η2) for format 2. In format 1, the parameterη, 0 < η < ∞, represents the scattered wave power ratio between in-phase and quadra-ture components of clusters of multipath. In format 2, the parameter η, −1 < η < 1, represents the correlation coefficient between scattered wave in-phase and quadra-ture components of clusters of multipath. The parameter
μ can be written as μ = 2V1 (α2)
1+ Hh2 forη− μ
distribution andμ = 1
V(α2)(11++2κ)κ2 forκ −μdistribution. The parameter κ represents the ratio between the total power of the dominant components and the total power of the scattered waves.
Since the Nakagami-m distribution can be obtained from the distribution κ −μforκ → 0 andμ = m, it is observed that the MGFMκ−μ(s)coincides exactly with the MGF expression for the Nakagami-mfading implicit in [15]. For this case, in which κ → 0 andμ = m, the expression of the SEP coincides exactly with expression 13 of [15]. Theκ −μdistribution also includes the Rice distribution forμ=1 andκ=k. Hence, the Rayleigh dis-tribution can be obtained from theκ−μdistribution for κ =0 andμ=1.
The Nakagami-mdistribution can also be obtained from η−μdistribution for μ = mandη → 0 in format 1 orη → ±1 in format 2 [22]. It can also be obtained for μ = m/2 and η → 1 in format 1 orη → 0 in format 2. Given that the Nakagami-mis obtained, the Rayleigh distribution can be obtained form=1.
Using a similar procedure, the Hoyt distribution can be obtained from theη−μdistribution forμ= 0.5. In this case, the parameterqof Hoyt is related toηby q2 = η in format 1 or byq2 = (1−η)/(1+η)in format 2. The Rayleigh distribution can be obtained from that result for μ=0.5 andη=1 in format 1 orη=0 in format 2.
4 Symbol error probability underη−μfading
Applying the expression of the MGF of Equation 13 in Equation 9 and adjusting the ranges of the integrals to Lauricella’s function integrals, it is possible to write the SEP expression as follows:
whereγ1 = 2(hγ δ−H2)μ,γ2 =
5 Symbol error probability underκ−μfading
The expression of the SEP forκ−μfading can be obtained by writing the exponential function of Equation 14 in terms of its series representation and following the same procedure applied for η− μ fading. In this case, after adjusting the interval of integration to [ 0, 1], it is possible to represent each of the integrals ofPasby means of sums of Lauricella functions:
Firstly, two important aspects of Equations 15 and 19 are highlighted. Despite the expression of SEP in terms of Equations 15 and 19 seems at a first glance more complex than Expression 9, it is not true since the Lau-ricella functions can be easily calculated by the inte-gral representation in the interval [ 0, 1]. For real num-bers, Lauricella functions, FDr(a,b1,· · ·,br,c,x1,· · ·,xr),
of terms using the quadrature Gauss-Legendre, for instance. In this case,
FD(a,b1,· · ·,br;c;x1,· · ·,xr)=
(c) 2(c−a)(a)
× Nt
l=1
wlf(0.5ξl+0.5),
(22)
in which
wl=
2
(1−ξl2)
PN
t(ξl)
2, (23)
ξl, for l = 1, 2,· · ·,Nt, are the roots of the Legendre
polynomialsPNtof orderNt, and
f(x)= x
a−1(1−x)c−a−1
(1−xx1)b1(1−xx2)b2· · ·(1−xxr)br
. (24)
The second aspect regards Equation 19. Although it is written in terms of an infinite series, its convergence is fast. In the present work, it was observed thatnranging from 0 to 10 suffices. Indeed, for the first term, one has
A1(n)
1
0
tβ−1(1−t)−21(1+tγ11)−μN
t
1+tγ11
n dt→0
(25)
since
t 1+tγ11
<1 (26)
andA1(n)is directly proportional to 22nB(β(+n2(β,1)+n!n))2(β+n).
6.1 SEP as a function ofθ
Figure 1 presents SEP curves as a function of the angle θ for theη−μmodel. Due to the symmetry of the geo-metric regions of theθ-QAM constellation, it suffices to take the angle θ between 45◦ and 90◦. The red curves were obtained considering the diversity order of the MRC receiver equal to 2, while the blue curves were obtained for diversity order equal to 3. In both cases the SNR was maintained equal to 10 dB. The assignment of parameter valuesηandμin Figure 1 provided the following types of fading: Nakagami-mforη= 0 andμ= 1.5, Rayleigh for η = 0 andμ = 0.5, one-sided Gaussian forη = 0 and μ=0.25, and Hoyt forη=0.65 andμ=0.5.
It is observed in Figure 1 that the spatial diversity of the MRC has a stronger influence in the SEP when compared to that of the optimum angleθ, for which the curves attain a minimum. This is an important aspect since it is not possible to perform an optimum Gray mapping for every value ofθ. All curves attain their minimum value for θ close to 60◦, and as one can see, there is a small difference in the SEP values whenθranges from 45◦to 60◦compared to the difference obtained increasing the diversity order by one.
In Figure 2, the curves were obtained from the model κ −μ. Similarly to Figure 1, red curves were plotted for N =2 and blue curves forN =3. The SNR was set at 10 dB, and the choice of the parametersκandμprovided the following types of fading: Nakagami-mforκ=0 andμ= 3.0, Rayleigh forκ =0 andμ= 1.0, one-sided Gaussian forκ =0 andμ=0.5, and Rice forκ=0.8 andμ=1.0.
The parameters used in the curves of Figure 2, except for Rice fading, provide the same curves presented in Figure 1. These parameters were properly chosen to show
0 0.05 0.1 0.15 0.2 0.25
45 50 55 60 65 70 75 80 85 90
Symbol error probability
Angle θ η=0.00, μ=1.50, N=2
η=0.00, μ=0.50, N=2 η=0.00, μ=0.25, N=2 η=0.65, μ=0.50, N=2 η=0.00, μ=1.50, N=3 η=0.00, μ=0.50, N=3 η=0.00, μ=0.25, N=3 η=0.65, μ=0.50, N=3
0 0.05 0.1 0.15 0.2 0.25
45 50 55 60 65 70 75 80 85 90
Symbol error probability
Angle θ κ=0.00, μ=3.00, N=2
κ=0.00, μ=1.00, N=2 κ=0.00, μ=0.50, N=2 κ=0.80, μ=1.00, N=2 κ=0.00, μ=3.00, N=3 κ=0.00, μ=1.00, N=3 κ=0.00, μ=0.50, N=3 κ=0.80, μ=1.00, N=3
Figure 2SEP curves forθ-QAM forM=16underκ−μfading.
that both the results of Equations 15 and 19 can be used in the calculation of the SEP under the main cate-gories of fading. The difference is that Hoyt (Nakagami-q) fading can only be modeled by the η − μ distribu-tion, and Rice fading can be modeled by the κ − μ distribution.
6.2 SEP as a function of SNR for a fixedθ
The curves in Figure 3 show the behavior of the SEP as a function of SNR, underη−μfading, for the parameter values used in Section 6.1. The curves were obtained for the order of the constellationM=64 and diversity orders N=1 andN =3.
As can be seen in Figure 3, regarding Nakagami fading obtained from theη−μmodel withη=0 andμ=1.5, the increase of the diversity order fromN =1 toN =3 pro-vides a gain in SNR of about 7.5 dB for a SEP fixed at 10−2. For all types of fading under consideration (Nakagami for η = 0 and μ = 1.5, Rayleigh for η = 0 and μ = 0.5, one-sided Gaussian forη=0 andμ=0.25, and Hoyt for η=0.65 andμ=0.5), one can note that a diversity order N=3 does not assure the SEP lower than 10−3for SNR< 20 dB. The curves in Figure 4 present the behavior of the SEP as a function of SNR underκ−μfading for the con-stellation orderM = 64 and diversity ordersN = 1 and N=3.
10−6 10−5 10−4 10−3 10−2 10−1 100
0 5 10 15 20 25
Symbol error probability
SNR (dB)
η=0.00, μ=1.50, N=1
η=0.00, μ=0.50, N=1
η=0.00, μ=0.25, N=1
η=0.65, μ=0.50, N=1
η=0.00, μ=1.50, N=3
η=0.00, μ=0.50, N=3
η=0.00, μ=0.25, N=3
η=0.65, μ=0.50, N=3
10−6 10−5 10−4 10−3 10−2 10−1 100
0 5 10 15 20 25
Symbol error probability
SNR (dB)
κ=0.00, μ=3.00, N=1
κ=0.00, μ=1.00, N=1
κ=0.00, μ=0.50, N=1
κ=0.80, μ=1.00, N=1
η=0.00, μ=3.00, N=3
η=0.00, μ=1.00, N=3
η=0.00, μ=0.50, N=3
η=0.80, μ=1.00, N=3
Figure 4SEP curves forθ-QAM withM=64underκ−μfading andθ=62◦.
The equivalence ofη−μandκ−μmodels, for appro-priated choices of the corresponding parameters, can be observed in Figures 3 and 4, for which the SEP curves for Nakagami, Rayleigh, and one-sided Gaussian fading are exactly the same.
In Figure 4, the results for Rice fading are obtained using κ = 0.8 andμ = 1.0. For all curves, a diversity orderN up to 3 does not guarantee a SEP lower than 10−3for SNR <20 dB.
The curves in Figure 5 are obtained for η−μfading, constellation orderM = 64, and diversity ordersN = 1 and N = 3. The angle θ was considered 62◦ near the
angle 60◦of the triangular QAM constellation. Consider-ing only the dashed curves forη = 0.1, one can observe that the SEP increases whenμdecreases from 2.5 to 1.5. This is expected because the corresponding fading inten-sity also increases. A similar behavior occurs forη= 0.8. For the parameters ranging from(η = 0.1,μ = 2.5) to (η = 0.80,μ = 1.5) andN = 3, about 3 dB of SNR is necessary to maintain the SEP at 10−4.
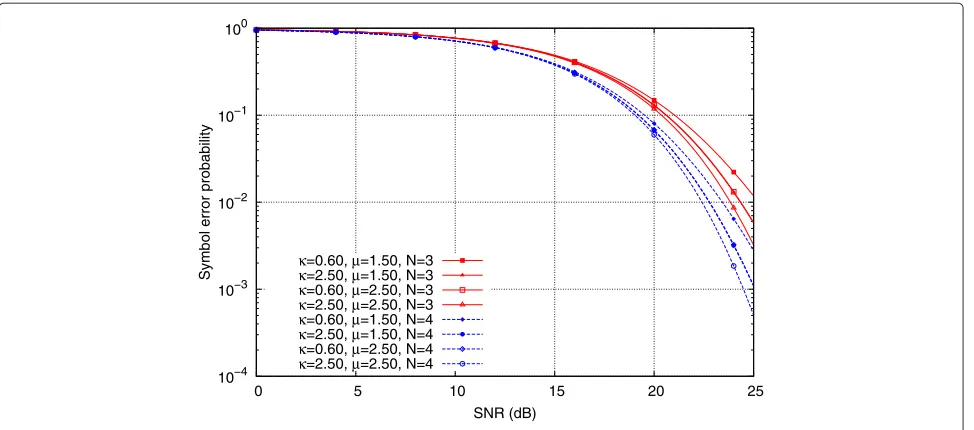
The curves in Figure 6 were obtained forκ−μfading, modulation orderM = 256 and diversity orderN = 3 andN = 4. The angleθ was maintained at 62◦. As one can note, even for diversity order ofN = 4, the curves
10−7 10−6 10−5 10−4 10−3 10−2 10−1 100
0 5 10 15 20 25
Symbol error probability
SNR (dB) η=0.1 μ=1.5 N=1
η=0.1 μ=2.5 N=1 η=0.8 μ=1.5 N=1 η=0.8 μ=2.5 N=1 η=0.1 μ=1.5 N=3 η=0.1 μ=2.5 N=3 η=0.8 μ=1.5 N=3 η=0.8 μ=2.5 N=3
10−4 10−3 10−2 10−1 100
0 5 10 15 20 25
Symbol error probability
SNR (dB)
κ=0.60, μ=1.50, N=3
κ=2.50, μ=1.50, N=3
κ=0.60, μ=2.50, N=3
κ=2.50, μ=2.50, N=3
κ=0.60, μ=1.50, N=4
κ=2.50, μ=1.50, N=4
κ=0.60, μ=2.50, N=4
κ=2.50, μ=2.50, N=4
Figure 6SEP curves forθ-QAM withM=256underκ−μfading.
of SEP remain above 10−2for values of SNR lower than 20 dB. This occurs because the higher-orderθ-QAM con-stellations are more susceptible to fading effects. For the parameters ranging from(κ = 2.50,μ = 2.50)to (κ = 0.60,μ=1.50)andN=4, about 1.25 dB must be invested in terms of the SNR to keep the SEP at 10−2.
7 Conclusions
This paper presents new and exact expressions for the SEP ofθ-QAM modulation considering the MRC receiver underη−μ andκ −μfading, modeled by η− μand κ−μdistributions. An important aspect of those distri-butions is the fact that they can provide a unified analysis of the influence of different types of fading in the per-formance of the communications system, such as Hoyt, Rice, Nakagami-m, Rayleigh, and one-sided Gaussian. The SEP expressions, obtained from the definite integrals of the MGF function of the SNR at the input of the MRC receiver, are written in terms of Lauricella functions. Expressions obtained in the paper show that the spatial diversity introduced by the MRC receiver has a strong influence for reducing the SEP, even for high-order stellations. As an example, considering 256-QAM con-stellation and a SEP of 10−2, savings of about 1.7 dB can be obtained when the diversity order is inscreased from N = 3 to N = 4. The SEP expressions can be use-ful to design and evaluate the performance of wireless communication systems, since they alleviate the need for Monte Carlo simulations. Future works include the effects of fading correlation and the impact of channel estimation errors on the performance of wireless systems.
Competing interests
The authors declare that they have no competing interests.
Author details
1Department of Electrical Engineering, Federal University of Campina Grande,
Campina Grande, Para´ıba, Brazil.2Polytechnic School of Pernambuco,
University of Pernambuco, Recife, Pernambuco, Brazil.3Institute for Advanced Studies in Telecommunications, Campina Grande, Para´ıba, Brazil.
Acknowledgements
The authors would like to express their thanks to CNPq for the financial support on this research.
Received: 12 September 2012 Accepted: 25 April 2013 Published: 14 May 2013
References
1. Y Lee, MH Tsai, Performance of decode-and-forward cooperative communications over Nakagami-mfading channels. IEEE Trans. Vehicular Technol.58(3), 1218–1228 (2009)
2. V Mahinthan, JW Mark, X Shen, Performance analysis and power allocation for M-QAM cooperative diversity systems. IEEE Trans Wireless Commun.9(3), 1237–1247 (2010)
3. V Asghari, DB da Costa, S Aissa, Symbol error probability of rectangular QAM in MRC systems with correlatedη−μfading channels. IEEE Trans. Vehicular Technol.59(3), 1497–1503 (2010)
4. FJ L ´opez-Mart´ınez, E Martos-Naya, JF Paris, U Fern´andez-Plazaola, Generalized BER analysis of QAM and its application to MRC under imperfect CSI and interference in Ricean fading channels. IEEE Trans. Vehicular Technol.59(5), 2598–2604 (2010)
5. H Yu, G Wei, F Ji, X Zhang, On the error probability of cross-QAM with MRC reception over generalizedη−μfading channels. IEEE Trans. Vehicular Technol.60(6), 2631–2643 (2011)
6. K Cho, D Yoon, On the general BER expression of one and two dimensional amplitude modulations. IEEE Trans. Commun.50(7), 1074–1080 (2002) 7. WJL Queiroz, WTA Lopes, F Madeiro, MS Alencar, An alternative method
to compute the bit error probability of modulation schemes subject to Nakagami-mfading. EURASIP J. Adv. Signal Process.2010, 1–12 (2010) 8. C Kim, Jeong Kim v G, H Lee, inProceedings of the IEEE International
Symposium on Personal, Indoor and Mobile Communications (PIMRC’95). BER analysis of QAM with MRC space diversity in Rayleigh fading channels, (Toronto, ON, Canada, 1995), pp. 482–485
9. J Lu, TT Tjhung, CC Chai, Error probability performance ofL- branch diversity reception of MQAM in Rayleigh fading. IEEE Trans. on Commun.
46, 179–181 (1998)
11. C Campopiano, B Glazer, A coherent digital amplitude and phase modulation scheme. IRE Trans. Commun.10, 90–95 (1962)
12. SJ Park, Triangular quadrature amplitude modulation. IEEE Commun. Lett.
11(4), 292–294 (2007)
13. G Foschini, R Gitlin, S Weinstein, Optimization of two-dimensional signal constellations in the presence of Gaussian noise. IEEE Trans. Commun.22, 28–38 (1974)
14. SJ Park, MK Byeon, inProceedings of the 19th Annual International Symposium on Personal, Indoor and Mobile Radio Communications (PIMRC’08). Irregularly distributed triangular quadrature amplitude modulation, Cannes, September 2008), pp. 1–5
15. KN Pappi, AS Lioumpas, GK Karagiannidis,θ-QAM: A parametric quadrature amplitude modulation family and its performance in AWGN and fading channels. IEEE Trans. Commun.58(4), 1014–1019 (2010) 16. J Lee, D Yoon, K Cho, Error performance analysis ofM-aryθ-QAM. IEEE
Trans. Vehicular Technol.61(3), 1423–1427 (2012)
17. GA Ropokis, AA Rontogianis, PT Mathiopoulos, K Berberidis, An exact performance analysis of MRC/OSTBC over generalized fading channels. IEEE Trans. Commun.58(9), 2486–2492 (2010)
18. WJL de Queiroz, MS Alencar, WTA Lopes, F Madeiro, Error probability in multichannel reception with M-QAM, M-PAM and R-QAM schemes under generalized fading. IEICE Trans. Commun.E93-B(10), 2677–2687 (2010) 19. TA Tsiftsis, HG Sandalidis, GK Karagiannidis, M Uysal, Optical wireless link
with spatial diversity over strong atmospheric turbulence channels. IEEE Trans. Wireless Commun.8(2), 951–957 (2009)
20. HE Nistazakis, GS Tombras, On the use of wavelength and time diversity in optical wireless communication systems over gamma-gamma turbulence channels. Optics Laser, Technol.44, 2088–2094 (2012) 21. SM Navidpour, M Uysal, M Kavehrad, BER performance of free-space
optical transmission with spatial diversity. IEEE Trans. Wireless Commun.
6(8), 2813–2819 (2007)
22. MD Yacoub, Theκ−μdistribution and theη−μdistribution. IEEE Antennas and Propagation Mag.49, 68–81 (2007)
23. NY Ermolova, Moment generating functions of the generalizedη−μand κ−μdistributions and their applications to performance evaluations of communication systems. IEEE Commun. Lett.12(7), 502–504 (2008) 24. DB da Costa, MD Yacoub, Moment generating functions of generalized
fading distributions and applications. IEEE Commun. Lett.12(2), 112–114 (2008)
doi:10.1186/1687-6180-2013-104
Cite this article as:Queirozet al.:Performance analysis of generalized QAM modulation underη−μandκ−μfading.EURASIP Journal on Advances in Signal Processing20132013:104.
Submit your manuscript to a
journal and benefi t from:
7Convenient online submission
7Rigorous peer review
7Immediate publication on acceptance
7Open access: articles freely available online
7High visibility within the fi eld
7Retaining the copyright to your article