R E S E A R C H
Open Access
User rate and power optimization for
HetNets under Poisson cluster process
Xinqi Jiang and Fu-Chun Zheng
*Abstract
Heterogeneous cellular networks (HetNets) consist of different tiers of base stations (BSs) to meet the ever-increasing mobile traffic demand. Due to the random deployment of BSs, Poisson point process (PPP) is often used to model the BS distribution. However, low power small cells are usually clustered around the popular areas, and PPP can not reflect such a feature. To this end, we in this paper consider base station (BS) cooperation and analyze user rate and energy efficiency of HetNets based on a Poisson cluster process (PCP). A calculable formula for the average data rate (or spectral efficiency) and its approximated closed form are derived. Based on this closed form, a power minimization solution with certain spectral efficiency constraint is proposed, and the optimal cooperation radii are derived. Furthermore, we analyze spectral efficiency under a limited number of cooperative BSs in a two-tier network. Finally, we propose a range expansion (RE) scheme and examine the impact of this scheme. The theoretical analyses are verified by simulation results.
Keywords: Heterogeneous networks, Poisson cluster process, Energy efficiency, User rate, Stochastic geometry, Range expansion
1 Introduction
Comprising macro base stations (BSs) overlaid with dense low power BSs (hence small cells) [1], heterogeneous net-works (HetNets) are being deployed to meet the rapid growth in data demand from wireless users, especially those users at the edge of macro cells. Due to the nature of dense deployment for HetNets and the power con-sumption of all the BSs, energy efficiency (EE) has now been considered as another key performance indicator (KPI) for future wireless networks (e.g., 5G) on top of the traditional KPI of data rate or spectrum efficiency. As a result, not only the data rate but also the EE has recently received enormous attention from the communications community [2–4].
BS locations in dense HetNets tend to be irregular and randomly placed compared with traditional cellu-lar networks, which makes the analysis of the HetNets’ performances much more intricate. Fortunately, for the user rate and energy efficiency analysis, some tools from stochastic geometry have proved to be powerful, such as
*Correspondence:[email protected]
School of Electronic and Information Engineering, Harbin Institute of Technology, Shenzhen, China
the probability generating functional (PGFL) of Poisson cluster process (PCP), the Palm characterization of PCP, and the Campbell-Mecke theorem. Indeed, these tools have made possible the theoretical analysis of many net-work metrics, such as average rate, energy consumption, as well as transmission delay.
One major challenge for HetNets is interference man-agement. Coordinated multi-point (CoMP) transmission [5] is an effective scheme to reduce interference by trans-forming interfering signals to useful signals or to increase space diversity, hence enhancing the performances of Het-Nets. As such, CoMP is expected to play a key role in future cellular networks as an effective means of meet-ing higher data rates as well as expandmeet-ing the indoor and cell-edge coverage. In [6,7], the authors apply CoMP transmission in HetNets to enhance performances of net-work, and simulation results illustrate that CoMP can significantly improve the average SE and EE compared to non-CoMP. Thus, a single-stream CoMP transmission scheme (also termed macro-diversity CoMP) is exploited in this paper.
1.1 Related work and motivations
As mentioned above, there has been much effort on applying stochastic geometry to modeling and analyzing HetNets. In most works so far, cellular networks have been modeled as a tractable distribution such as Poisson point process (PPP) [8–10]. In [10], the authors derived the spectral efficiency based on the PPP model and deter-mined the optimal received signal strength (RSS) thresh-olds under certain approximation. However, most small cells are usually clustered around densely populated areas, and PPP is not always suitable. Investigating a more accu-rate model therefore becomes imperative. To this end, the Laplace transform of the total interference in HetNets using a PCP was given in [11]. In [12], the authors com-pared PPP, aggregative point process, and repulsive point process to choose the optimal model for BS deployment in urban areas. In [13], it was stated that the PPP models in some case is more accurate than the hexagonal grid model, but the PCP is able to even more accurately model BS deployment. Assessing KPIs of HetNets based on the PCP model therefore becomes necessary. However, an inte-grated characterization for aggregate interference as well as the PGFL, based on the PCP network model, has not been reported, although such a characterization is crucial to the theoretical analysis of network performances, such as SE and EE.
Indeed, as both EE and SE are now viewed as crucial per-formance metrics in 5G networks, analysis of EE and SE has gained much attention recently. Reference [14] pro-posed a new cooperative multiple-input multiple-output (MIMO) scheme to improve the spectrum efficiency while maintaining the same spatial multiplexing and diversity gains as traditional MIMO schemes. Reference [15] stud-ied the EE and area SE with respect to the number and size of microcells. References [16,17] studied the perfor-mances of cross-tier cooperation scheme based on the PPP network model, and the numerical results illustrate that such a cooperation strategy can significantly boost ergodic capacity and reduce outage probability. Cross-tier cooperation scheme is expected to be a major technique to provide higher data rates. However, none of the above works has applied this cooperation schemes to a PCP network. As a result, Reference [18] derived new ana-lytical expressions for the coverage probability and area spectral efficiency on clustered device-to-device millime-ter wave networks. In [19], the authors investigated the outage probability, the coverage probability, and the aver-age achievable rate based on a tractable lower bound of the PGFL when the nodes follow a PCP. Reference [20] found that the coverage probability in [19] is not always accurate for analyzing PCP network performances. However, the EE and SE of PCP modeled HetNets, based on cross-tier cooperation, have not been analyzed so far.
Over the above situation, this paper targets at the single-stream CoMP over a PCP HetNet, where cross-tier cooperation is based on the RSS threshold. From the per-spectives of EE and SE, we derived a tractable result for SE based on PCP and then proposed an energy optimization solution. Moreover, we also analyzed spectral efficiency in case of the limited number of cooperative BSs in a two-tier HetNet and proposed a range expansion (RE) scheme based on CoMP, which balances the load of macro BS.
1.2 Contributions
The main contributions of this paper are therefore as follows: (1) a computationally efficient formula for spec-tral efficiency is derived under the PCP model, and then approximated as a closed form; (2) a comprehensive com-parison with the corresponding PPP results is carried out; (3) a power optimization scheme is proposed by optimiz-ing the cooperative radius of each tier; and (4) a scheme based on a limited number of cooperative BSs and a range expansion (RE) strategy are proposed, which can ease the load of macro BS and enhance the network EE.
1.3 Paper organization
The remainder of this paper is structured as follows. In Section3, we give a brief description on a particular PCP model and present the downlink system model. The for-mula of spectral efficiency is derived based on PCP and an optimal solution for each tier’s cooperative radius is deter-mined in Section4. In Section5, we propose an effective BS cooperation and RE strategy based on CoMP. Section6 presents the numerical results and related illustrations. A list of major symbols and their meanings are shown in Table1.
2 Methods/experimental
The methods and analysis in this paper are based on stochastic geometry and are described in Section3, while the verification is based on Monte Carlo simulations as presented in Section 6. This paper contains no experi-ments.
3 PCP and downlink system model 3.1 Poisson cluster process (PCP)
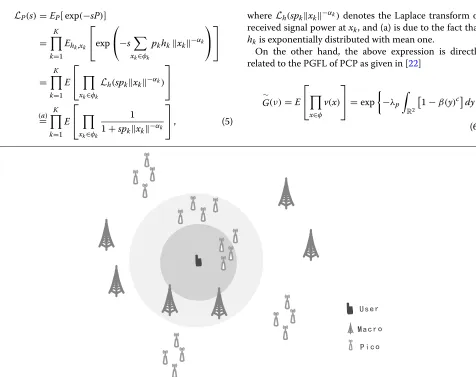
by PCP. This special PCP model and the PPP model are illustrated in Fig.1. In each cluster of thekth tier, the num-ber of daughter nodes is fixed to beck, the mean density of thekth tier is thereforeckλp,k. The probability density function of such PCP daughter nodes is given by
f(d)=
1
πRa2 ||d|| ≤Ra
0 otherwise, (1)
wheredis a daughter node’s position relative to the cluster center, and||d||is the distance between the daughter node and the center of the relevant cluster.
3.2 System model
We consider a general model of downlink HetNets which includes K network tiers, and the BS positions of each tier form a PCP denoted byonR2. BSs across tiers are distinguished by their deployment mean density ckλp,k, transmit powerpk, and path loss exponentsαk. User den-sity is denoted byλu. Both BSs and users are equipped with a single antenna. Without any loss of generality, the general path loss is given by PL(x) = x−αk, where
x indicates the distance between a typical user at the origin and BS atx. Inspired by [10], we also consider a user-centric cross-tier BS collaboration scenario. Figure2 illustrates a two-tier HetNet involving a mix of macro and pico BSs, where the typical user can be served by cooperative BSs from both tiers.
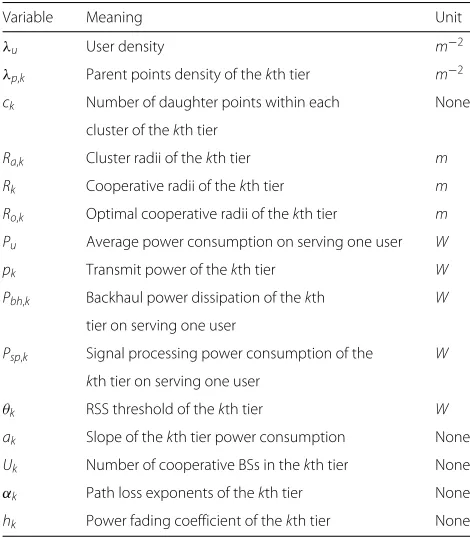
Table 1Major symbols used in this paper
Variable Meaning Unit
λu User density m−2
λp,k Parent points density of thekth tier m−2
ck Number of daughter points within each None
cluster of thekth tier
Ra,k Cluster radii of thekth tier m
Rk Cooperative radii of thekth tier m
Ro,k Optimal cooperative radii of thekth tier m
Pu Average power consumption on serving one user W
pk Transmit power of thekth tier W
Pbh,k Backhaul power dissipation of thekth W
tier on serving one user
Psp,k Signal processing power consumption of the W
kth tier on serving one user
θk RSS threshold of thekth tier W
ak Slope of thekth tier power consumption None
Uk Number of cooperative BSs in thekth tier None
αk Path loss exponents of thekth tier None
hk Power fading coefficient of thekth tier None
We employ the Palm measure [21] to characterize the total signal and the aggregate interference at the typical user located at the origin and served by cross-tier coop-erative BSs. For convenience, the set of coopcoop-erative BSs is denoted byCC. BSs in theCC transmit the same data to the typical user (hence a non-coherent macro-diversity CoMP strategy) and the RSS at the user exceeds some RSS threshold. Namely, for the kth tier, the BS located atxk belongs to the cooperative groupCCifpkhkxk−αk ≥θk, where θk is the RSS threshold for the kth tier, and hk denotes the power fading coefficient of thekth tier.
Assuming that the cooperative region in each tier is circular, the cooperative radiusRkcan then be given by
Rk = the signal-to-interference-plus-noise ratio (SINR) at the typical user is given by
SINR=
whereσ2is the noise power.
4 Spectral efficiency and power optimization In this section, we derive and optimize two key metrics, i.e., the spectral efficiency (SE) and energy efficiency (EE) based on the probability generating functional (PGFL) of the Poisson cluster process in aK-tier HetNet. Both met-rics depend on the SINR in [3]. As in [10], the Laplace transform is used to characterize the aggregate interfer-ence (the denominator) and the total signal power (the numerator plus the denominator). For comparison, the same denotations have also been employed as in [10].
4.1 Laplace transform of the total signal power
For the proposed PCP model, the number of daughter nodes in each cluster is assumed to be fixed, and the parent points are not included. All cooperative BSs are assumed to transmit the same signal to the “typical user" at the origin. The total signal power (the signal plus the interference) received at this user is given by
P=
Fig. 1The PCP model and PPP model with the same average intensityλ=1 for comparison.aPoisson cluster process (λp=0.1,c¯=10).bPoisson
point process (λ=1)
LP(s)=EP[ exp(−sP)]
=
K
k=1
Ehk,xk ⎡ ⎣exp
⎛ ⎝−s
xk∈φk
pkhkxk−αk ⎞ ⎠ ⎤ ⎦
=
K
k=1
E
⎡
⎣
xk∈φk
Lh(spkxk−αk) ⎤ ⎦
(=a)K
k=1
E
⎡
⎣
xk∈φk
1 1+spkxk−αk
⎤
⎦, (5)
where Lh(spkxk−αk)denotes the Laplace transform of received signal power atxk, and (a) is due to the fact that
hkis exponentially distributed with mean one.
On the other hand, the above expression is directly related to the PGFL of PCP as given in [22]
∼
G(ν)=E
⎡
⎣
x∈φ
v(x)
⎤ ⎦=exp
−λp
R2
1−β(y)cdy
,
(6)
where
β (y)=
R2
v(x−y)f(x)dx,
and c denotes the number of daughter nodes in each cluster.
The lower bounded PGFL and the upper bounded con-ditional PGFL of the PCP are given by [19]. In order to evaluate accurately the spectral efficiency, we derive below the precise expression by algebraic operations.
Lemma 1The Laplace transform (i.e.,(5)) of total signal power P is estimated as
LP(s)= (b) follows from the polar representation.
Then by substituting (8) into (6) and then (5), we obtain (7) in Lemma1. Computing the integral in (6) numerically is a very arduous task, but (7) in Lemma1is now much more computationally efficient.
4.2 Spectral efficiency
From the information theory, we can achieve Shannon boundln(1+SINR)for an instantaneous SINR. Thus, the spectral efficiency in units of nats/s/Hz is calculated as
τ =ESINR[ln(1+SINR)]
wherePandIdenote the total signal power and aggregate interference power, respectively.
Theorem 1In a K-tier HetNet, the spectral efficiency of a typical user at the origin under the proposed model can be evaluated as
ProofPlease see Appendix1.
Although it is not a closed form, the above integral can be analysed numerically. AsBk(y)ck −1<0, the spectral efficiency is an increasing function of the cooperative radii
Rk. As such, we can design a larger cooperative region of BS in HetNets to meet higher data rates (subject to the overhead incurred).
In order to compare the performances (i.e., SE and EE) under PPP and PCP, we adopt the same setup for a typ-ical user as in a PPP model. Assuming fading coefficient
h ∼ exp(1), the spectral efficiency under PPP [10] with
and(·)denotes the gamma function.
the noise (interference is the dominated issue in a dense HetNet).
Lemma 2Ignoring the noise in dense HetNets, Eq.(10)
can be simplified as follows
τ(≈a)q−lnf, (12)
ProofPlease see Appendix2.
Note thatqis not related to the cooperative radii, and it is a constant for a given deployment density and trans-mit power. As shown in Appendix 2,q−ln(f)is in fact the lower bound of τ in (10). When Rk becomes larger, however, the gap between (10) and q−ln(f) rapidly tapers off, hence the close approximation of (12) for τ. Equation (12) is a closed formula, which makes the follow-ing optimization problem easier to solve.
4.3 Minimizing energy consumption via optimizing cooperative radii
For the proposed model, the BSs inside the cooperative clusters can communicate with the typical user located at the origin, and the average power consumption when serving such a user is given by [10]
wherePbh,kis the backhaul power dissipation when serv-ing one user (i.e., the typical user) in the kth tier, Psp,k denotes the corresponding signal processing power con-sumption, andakdenotes the slope of thekth tier power consumption with respect to transmit powerpk. The sec-ond term ofPuin (13) denotes the average static power for serving one user, and it is independent of the load of BSs.
In the following, we will provide a solution for opti-mizing the average power consumption of the HetNet for the typical user in (13). In reality, it is very important to determine the network parameters which can mini-mize the network power consumption. Since the average energy consumption Pu per user and the average con-sumed energy Pav are related with Pav = λu × Pu,
minimizing Pu is critical to designing an energy-saving network.
For a given cooperative radius R1 of the first tier, we want to find out the optimal cooperative radius R2 of the second tier in a two-tier HetNet, which minimizes the energy consumption while ensuring a certain rate to the typical user. Note that the energy consumption in (13) increases with the cooperative radii, which suggests that we should determine the minimum cooperative radii while guaranteeing the minimum user rate. Intuitively, the user rate should increase with cooperative areas, and the rate in (10) is indeed an increasing function of the cooperative radii. Assuming that the first-tier cooperative radiusR1is known, we can determine the optimal value of the second-tier cooperative radiusR2through dichotomy. The problem will be transformed into a simple problem with a single variable (with the constraint from (10)):
minR2
The above problem formulation can be solved by the well-known dichotomy algorithm1.
Now, we want to form the general problem to determine the optimal values forR1,R2,· · ·,RK in aK-tier network, which minimize the power consumption in (13) while satisfying the minimum spectral efficiency requirement. Note that the second term ofPuin (13) is independent of
R1,R2,···,RK, and can be ignored. Hence, by applying (12) and (13), the optimization problem can be formulated as follows:
Clearly, both the constraint condition and the optimiza-tion objective funcoptimiza-tion are of closed form. The problem can then be solved easily by a linear programming method as follows.
Theorem 2The optimal cooperative radii approximately satisfy
Ro,k =
whereRo,kdenotes the optimal value of thekth tier coop-erative radius, andPa,i = Pbh,i+Psp,i+aipidenotes the total power dissipation when serving a typical user in the
ith tier.
ProofPlease refer to Appendix3.
Combining (16) and (17), the optimal value of each tier can be determined by solving the resultant system of non-linear equations for a given data rateτ0, which optimizes the PCP networks’ energy consumption.
Once the powerPu has been minimized, the network energy efficiencyηee, defined as the ratio of the average spectral efficiency to the average power consumption, can be calculated as
ηee= τ
Pu
. (18)
5 Limited BS number and range expansion In this section, we examine two implementation variations of the above collaboration strategy: (a) limited number of cooperative BSs and (b) range expansion (RE).
5.1 Limited number of cooperative BSs
In order to accommodate the ever-increasing traffic demand, low power BSs are densely deployed in HetNets. The number of cross-tier cooperative BSs for each user may be too high in popular areas, due to the overhead incurred and the marginal rate increase.
As a result, the number of associated BSs at a typical user should be limited to an acceptable level. Therefore, we now propose a cooperation tactic where the number of cooperative BSs is restricted toN (N ≤ 4). In other words, the typical user at the origin communicates with
NBSs based on maximum RSS, and all other BSs become noncooperative. Of course, the SE always increases when a new BS is added to the cooperative BS set, but the SE gain becomes more and more marginal and the overhead still increases linearly. Hence, there exists a tradeoff between SE and the overhead (including designing costs of BS and energy consumption). It is therefore meaningful to put a limit on the number of cooperative BSs, which can opti-mize EE and the overhead cost efficiency. As an example, we consider a two-tier HetNet, and the cooperative BSs number in this case is given by
2
k=1
Uk =N (N≤4) (19)
whereUkis the number of cooperative BSs in thekth tier. The effect of this BS constraint will be shown via simulation.
5.2 Range expansion
In HetNets, deployment of macro BSs are for large cover-age ranges, which may lead to a heavy load for macro BSs in crowded areas, and the energy consumption also heav-ily depends on the loading of macro BSs due to macro BSs’ high power consumption. Therefore, we now propose a range expansion (RE) scheme based on CoMP to alleviate the loading of macro BSs and improve the EE.
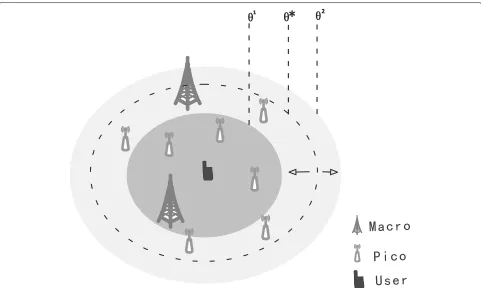
Generally, the transmission power of macro BSs is much larger than that of pico BSs, and as a result, many users will still receive the strongest signal from the macro BS even in hotspots. The RE scheme is to favor the selection of low power BSs by introducing a bias to the association thresh-old for low power BSs [23]. Due to the smaller coverage, lower power BSs can provide more resource blocks to each user than macro BSs. References [23–25] have shown that RE can achieve load balancing and enhance performances of networks without a loss of average user throughput. For example, in a two-tier HetNet, due to the bias, users are more likely to connect to the pico BSs than the macro BSs even ifp1h1r1−α1 >p2h2r2−α2. Figure3illustrates how the typical user is served based on the RE scheme in such an example. Here, we consider a two-tier HetNet comprising macro BSs and pico BSs, which follow a PCP. Conse-quently, the macro BSs can collaborate to serve the typical user at the origin only whenp1h1x−α1 ≥ε1θ∗and the pico BSs can serve this user ifε2p2h2x−α2 ≥ θ∗, where
θ∗denotes normalized RSS threshold (each tier then still has the same RSS threshold),ε1andε2are the first power bias and the second power bias, respectively. Therefore, the cooperative radii after biasing are given by
R∗1=
whereR∗1 andR∗2 denote the modified macro-tier radius and modified pico-tier radius after utilizing a power bias, respectively.
Fig. 3The typical user is served by macro and pico BSs, where the dashed circle denotes the normalized RSS thresholdθ∗, whileθ1andθ2denote the macro-tier and pico-tier RRS thresholds, respectively
6 Numerical results and discussions
In this section, we present some numerical results of the user rate and energy efficiency for a two-tier HetNet con-sisting of macro and pico BSs. The PCP cluster radii of this two-tier HetNet areRa,1 = 200mandRa,2 = 100m, respectively. Unless otherwise specified, the parameters are those from [26]: the transmit powerp1= 20W,p2 = 0.13W, and the slope of the power consumption: a1 = 4.7,a2 = 4. We now compare the results under the same parameters for two different point processes: PCP and PPP.
6.1 Validation of Laplace transform on PCP model
Figure 4 shows simulation and numerical results of the Laplace transform for a two-tier HetNet computed (i.e., (7)) under the PCP model. The PCP parameters are λp,1=1/(π×3002),λp,2=1/(π×2002),p1=40W,p2= 0.13W,c1 = 1,c2 = 10, and the cooperative radiiR1 = 400m,R2=100m. The simulation results match well with the analytical integrations in the whole range ofsand dif-ferent path loss exponents (assumingαk =αhere), which verifies the validity of the derived Laplace transform of the aggregate interference and total signal powers. The reason for the differences among theαcurves is that for larger a α value, the total interference attenuates more, while the Laplace transform is an exponentially decaying function.
6.2 Comparison between PPP and PCP
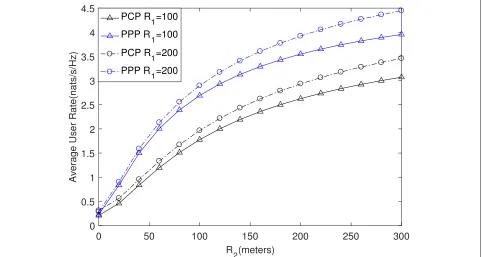
Figure5compares the spectral efficiency (SE) versus the first-tier and the second-tier cooperative radii for PPP and PCP models. In order to compare PCP and PPP, we have chosen some parameters as in [10] :λ1 = 1/(π × 2502),λ2 = 1/(π × 502), α1 = 4.3,α2 = 3.8, and set
c1 = 1,c2 = 4. As can be seen from Fig.5, the average user rate of PCP is worse than that of PPP, and the rea-son is that the main interferers are more likely to be closer to the typical user for PCP network (hence the higher interference level) than in the case of PPP. Furthermore, the spectral efficiency increases with the macro-tier coop-erative radius and the pico coopcoop-erative radius, and this is due to the number of cooperative BSs increasing for larger cooperative regions. We note that the pico-tier BSs after some sufficiently large distance contribute very marginally to the user rate. Therefore, the RSS threshold of the second tier should not be too low (to limit the num-ber of the second-tier cooperative BSs), considering the corresponding collaboration overhead.
Fig. 4The Laplace transform for PCP with differentα.aThe Laplace transform of the total signal power.bThe Laplace transform of the aggregate interference
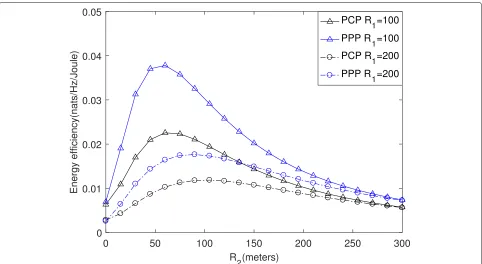
has an optimal value for a given R1 which leads to a maximum EE. The case is similar to that of PPP, but the EE of PCP is poorer compared with that of PPP, since the average rate of PPP is better than that of PCP, and energy consumption of the two cases are the same due to the same mean network density. Note that the EE is a decreasing function of the macro-tier cooperative radius, and this is because a large cooperative area of a macro-tier results in an increase in the number of the
cooperative macro BSs, while the main energy consump-tion is heavily dependent on the number of cooperative macro BSs.
6.3 Validity of Lemma 2
Figure 7 shows that the optimal and the upper bound cooperative radius values of the second tier versus the minimum user rate for two different cooperative radii of the first tier . By utilizing (12), we can acquire the upper
Fig. 6The energy efficiency of a two-tier network as a function of the first-tier and the second-tier cooperative radius for PPP and PCP
bound curves, and the optimal radius can be calculated approximately by applying the binary search algorithm to (14). It can be seen that the optimal radius increases with the minimum rateτ0, since the increase of the min-imum rateτ0means that more BSs need to be connected to the user, which results in an increase of cooperative radius. Furthermore, the gap between the optimal radius in the case ofR1 = 300mand that in the case ofR1 = 600mincreases with the minimum rateτ0. This is because the macro BSs in a specific cooperative area contribute limited impact on user rate, and more pico BSs are there-fore needed to satisfy the increment of the τ0. As τ0 increases, the upper bound increasingly approaches the optimal value, which testifies that the derived closed form is effective, especially for high data rates.
6.4 Limited number of cooperative BSs and range extension
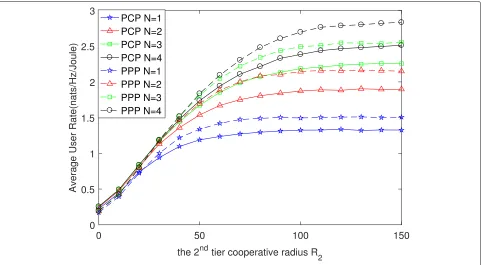
Figure 8 shows the average achievable rate versus the second-tier cooperative radius for a different number of cooperative BS based on PPP and PCP. We can see that the achievable rate of PCP is still worse than that of PPP for a fixed number of cooperative BSs, and the reason is the same as for Fig.5. It can be seen that the achievable rate does not change when R2is greater than a specific value, which reveals that the achieved rate has an upper bound for a given number of cooperative BSs, under either PPP or PCP. The reason is that the number of coopera-tive BS reaches the set limitN in the cooperative areas.
Moreover, the increase in the number of associated BSs can improve the achievable rate, but the rate gain incre-ment is a decreasing function of N. In the meantime, adding one additional BS means more energy consumption. As a result, BSs located at the edge of cooperative areas is likely to decrease the EE, which also justifies limiting the number of cooperative BSs.
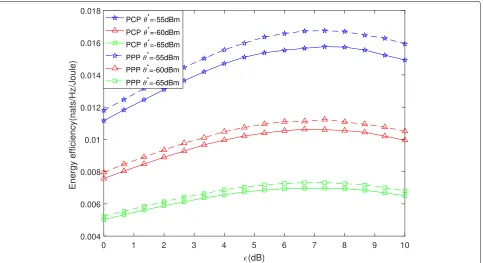
Figure9presents the simulation results of the EE based on RE with respect to power bias. Here, we assume that the two-tiers’ power biases are both equal toε. It can be seen that the EE is a concave function of the bias. No matter PCP or PPP, there exists an optimal bias (approx-imatelyε =7 dB) and it seems to be nearly independent of the normalized RSS threshold. This figure reveals the RE can improve EE as a consequence of decreasing the macro BS loading in comparison with the non-RE scheme (i.e., ε = 0 dB). Equivalently, it is obvious that the EE decreases with the normalized RSS thresholdθ∗ decreas-ing because of more cluster edge BSs. It is interestdecreas-ing to observe that forθ∗= −65 dBm, the biasεhas a relatively weaker effect on the EE (due to the large pre-expansion collaboration range). These curves also reveal that the EE of PCP is always lower than that of PPP, as the major interfering BSs in a PCP network are more likely to be closer to the user, which worsens the performances.
7 Conclusions
Fig. 7The optimal cooperative radius as a function of the minimum rate with two different cooperative radii of the first tier
interference and total signal power for PCP HetNets. By using these formulas, we have derived the spectral efficiency and the energy efficiency expressions for a typ-ical user. We have demonstrated that the performances of PCP networks are worse than those of PPP networks.
The optimal cooperative radii are also determined under the condition of a minimum rate, which minimizes the energy consumption. Additionally, we examined the case of limited number of cooperative BSs and the RE scheme (to balance the load between macro BSs and pico BSs).
Fig. 9The simulation results of the energy efficiency based on RE with the cooperative bias factorsε
In terms of energy efficiency, we observed that there exists an optimal solution for the bias, which maximizes the energy efficiency.
Appendix 1. Proof of Theorem 1
From [27], we have the following useful lemma
ln(1+x)=
∞
0 1
t(1−e
−xt)e−tdt
=
∞
0 1
t
!
e−t−e−(x+1)t
"
dt ∀x>0. (22)
By applying (22) to (9), the rate is given by
τ =EP,I
∞
0 1
t
exp(−t)−exp
−P+σ2
I+σ2t
dt
(a)
=EP,I
∞
0
e−sσ2
s [ exp(−sI)−exp(−sP)]ds
=
∞
0
e−sσ2
s [LI(s)−LP(s)]ds, (23)
where (a) follows by substitutingt=s(I+σ2), andLI(s) denotes the Laplace transform of the aggregate interfer-ence power of HetNets.
The group of interfering BSs is denoted byCI =\CC, and the aggregate interference range is outside the cir-cle with radiusRk. Therefore, following a similar process
to Lemma 1, we can express approximately the Laplace transform of aggregate interference as
LI(s)=EI(exp(−sI))
(a)
≈
K
k=1 exp
λp,k2π
∞
Rk
[Bk(y)ck−1]ydy
, (24)
where (a) follows from the fact that BS position can be approximated by the relevant cluster center.
Finally, by substituting (7) and (24) into (23), we can obtain (10) in Theorem1.
Appendix 2. Proof of Lemma 2
Proof A useful result from [28] is given by
∞
0
exp#−vxp$−exp#−μxp$dx
x =
1
pln
μ
v, (25)
∞
Then, by substituting (26) into (10), we ignore the noise and focus on the interference, and the spectral efficiency is approximately calculated as
τ ≥ ∞
Appendix 3. Proof of Theorem 2
By applying the Lagrangian multiplier method [29], we can establish the objective function as follows:
min respectively, we can obtain
∂F
Obviously, we can select one equation arbitrarily from (29) to determine the coefficientζ:
ζ =fPa,i
BS: Base station; CoMP: Coordinated multi-point; RSS: Received signal strength; EE: Energy efficiency; HetNets: Heterogeneous cellular networks; KPI: Key performance indicator; MCP: Matern cluster process; MIMO: Multiple-input multiple-output; PCP: Poisson cluster process; PGFL: Probability generating functional; PPP: Poisson point process; RE: Range expansion; SE: Spectral efficiency; SINR: Signal-to-interference-plus-noise ratio
Authors’ contributions
F-CZ proposed the main ideas and directions, supervised the research, and modified and rewrote some sections of the paper. XJ performed simulations and wrote a draft of the paper. Both authors read and approved the final manuscript.
Funding
This work was supported in part by a Shenzhen city/HITSZ start-up grant entitled “Energy-Efficient Low-Latency Wireless Networks,” the Shenzhen Science and Technology Innovation Commission under Grant
JCYJ20180306171815699, the National Basic Research Program of China (973 Program) under grant 2012CB316004, and the UK Engineering and Physical Sciences Research Council under Grant EP/K040685/2.
Availability of data and materials
Data sharing is not applicable to this article as no datasets were generated or analyzed during the current study.
Competing interests
The authors declare that they have no competing interests.
Received: 30 July 2018 Accepted: 11 September 2019
References
1. M. Kamel, W. Hamouda, A. Youssef,Ultra-Dense Networks: A Survey, vol. 18, (2016), pp. 2522–2545
2. Y. Jiang, Q. Liu, F. Zheng, X. Gao, X. You, Energy-efficient joint resource allocation and power control for D2D communications. IEEE Trans. Veh. Technol.65(8), 6119–6127 (2016)
3. T. Zhang, J. Zhao, L. An, D. Liu, Energy efficiency of base station deployment in ultra dense HetNets: A stochastic geometry analysis. IEEE Wirel. Commun. Lett.5(2), 184–187 (2016).https://doi.org/10.1109/LWC.2016.2516010 4. S. Khan, S. A. Mahmud, inIEEE International Conference on Computer and
Information Technology; Pervasive Intelligence and Computing, Liverpool. Power Optimization Technique in interference-limited femtocells in LTE and LTE advanced based femtocell networks, (2015), pp. 749–754.https:// doi.org/10.1109/cit/iucc/dasc/picom.2015.110
5. S. Geirhofer, P. Gaal, in2012 IEEE Globecom Workshops. Coordinated multi point transmission in 3GPP LTE heterogeneous networks, (Anaheim, 2012), pp. 608–612.https://doi.org/10.1109/glocomw.2012.6477643
6. R. Irmer, et al., Coordinated multipoint: Concepts, performance, and field trial results. IEEE Commun. Mag.49(2), 102–111 (2011)
7. A. He, D. Liu, Y. Chen, T. Zhang, inAnnual International Symposium on Personal, Indoor, and Mobile Radio Communication (PIMRC). Stochastic geometry analysis of energy efficiency in HetNets with combined CoMP and BS sleeping, (Washington DC, 2014), pp. 1798–1802.https://doi.org/ 10.1109/pimrc.2014.7136461
8. J. G. Andrews, F. Baccelli, R. K. Ganti, A tractable approach to coverage and rate in cellular networks. IEEE Trans. Commun.59(11), 3122–3134 (2011) 9. R. W. Heath, M. Kountouris, T. Bai, Modeling heterogeneous network
interference using Poisson point processes. IEEE Trans. Signal Proc.61(16), 4114–4126 (2013)
11. V. Suryaprakash, J. Mφller, G. Fettweis, On the modeling and analysis of heterogeneous radio access networks using a Poisson cluster process. IEEE Trans. Wirel. Commun.14(2), 1035–1047 (2015)
12. Q. Ying, Z. Zhao, Y. Zhou, R. Li, X. Zhou, H. Zhang,Characterizing spatial patterns of base stations in cellular networks, (Shanghai, 2014), pp. 490–495. https://doi.org/10.1109/iccchina.2014.7008327
13. C.-H. Lee, C.-Y. Shih, Y.-S. Chen, Stochastic geometry based models for modeling cellular networks in urban areas. Wirel. Netw.19(6), 1063–1072 (2013)
14. C. Kong, et al.,VSMC MIMO: A spectral efficient scheme for cooperative relay in cognitive radio networks, (2015), pp. 2137–2145.https://doi.org/10.1109/ infocom.2015.7218599
15. M. Demirtas, A. Soysal, inIEEE 81st Vehicular Technology Conference (VTC Spring). Energy and spectral efficient microcell deployment in
heterogeneous cellular networks, (2015), pp. 1–5.https://doi.org/10.1109/ vtcspring.2015.7145803
16. Y. Lin, W. Yu, Ergodic capacity analysis of downlink distributed antenna systems using stochastic geometry. Proc. IEEE Int. Conf. Commun. (ICC), 3338–3343 (2013).https://doi.org/10.1109/icc.2013.6655062 17. J. Zhao, Q. Wang, Y. Dong, W. Wei, inIEEE Wireless Communications and
Networking Conference. Performance analysis for cross-tier cooperation in heterogeneous cellular networks: A stochastic geometry approach, (Doha, 2016), pp. 1–6.https://doi.org/10.1109/wcnc.2016.7564964
18. W. Yi, Y. Liu, A. Nallanathan, Modeling and Analysis of D2D Millimeter-Wave Networks With Poisson Cluster Processes. IEEE Trans. Commun. 65(12), 5574–5588 (2017).https://doi.org/10.1109/TCOMM.2017.2744644 19. Y. J. Chun, M. O. Hasna, A. Ghrayeb, Modeling heterogeneous cellular
networks interference using Poisson cluster processes. IEEE J. Sel. Areas Commun.33(10), 2182–2195 (2015)
20. Y. Wang, Q. Zhu, Modeling and analysis of small cells based on clustered stochastic geometry. IEEE Commun. Lett.21(3), 576–579 (2017) 21. S. N. Chiu, D. Stoyan, W. S. Kendall, J. Mecke,Stochastic Geometry and Its
Applications, 3rd ed. (Wiley, Hoboken, 2013)
22. R. K. Ganti, M. Haenggi, Interference and outage in clustered wireless ad hoc networks. IEEE Trans. Inf. Theory.55(9), 4067–4086 (2009)
23. L. Zhang, S. Zhao, P. Shang, J. Liu, F. Han, inIEEE 85th Vehicular Technology Conference (VTC Spring). Distributed adaptive range extension setting for small cells in heterogeneous cellular network, (Sydney, NSW, 2017), pp. 1–7.https://doi.org/10.1109/vtcspring.2017.8108474
24. Q. Ye, B. Rong, Y. Chen, M. Al-Shalash, C. Caramanis, J. G. Andrews, User association for load balancing in heterogeneous cellular networks. IEEE Trans. Wirel. Commun.12(6), 2706–2716 (2013)
25. H. S. Jo, Y. J. Sang, P. Xia, J. G. Andrews, Heterogeneous cellular networks with flexible cell association: A comprehensive downlink SINR analysis. IEEE Trans. Wirel. Commun.11(10), 3484–3495 (2012)
26. G. Auer, et al., How much energy is needed to run a wireless network? IEEE Wirel. Commun. Mag.18(5), 40–49 (2011)
27. K. A. Hamdi, Capacity of MRC on correlated Rician fading channels. IEEE Trans. Commun.56, 708–711 (2008)
28. A. Jeffrey, D. Zwillinger,Table of Integrals, Series, and Products. (Academic, New York, 2007)
29. S. Boyd, L. Vandenberghe,Convex Optimization. (Cambridge Univ Press, Cambridge, 2004)
Publisher’s Note