R E S E A R C H
Open Access
Building interior layout reconstruction from
through-the-wall radar image using MST-based
method
Bo Chen, Tian Jin
*, Biying Lu and Zhimin Zhou
Abstract
In order to reconstruct the building interior layout from the through-the-wall radar image, this paper proposes a method based on minimum spanning tree (MST) which comes from the graph theory. The building layout graph (BLG) model is firstly established using the wall-wall-floor trihedrals inside the building. The vertex set and the edge set including the weight between any two nodes of the graph are defined afterwards. Then, the MST-based method is used to reconstruct the building interior layout. We have also improved the traditional method by applying the MST model with restricted conditions to solve the reconstruction problem when there exist interference targets in a building. The anechoic chamber measurements are carried out to demonstrate the suitability and efficacy of the MST-based method.
Keywords:Through-the-wall radar image (TWRI); Minimum spanning tree (MST); Building layout graph (BLG); Graph theory
1. Introduction
Sensing through walls is an emerging technology in re-cent years. Through-the-wall radar imaging (TWRI) is considered to be very effective to achieve the objectives of ‘seeing’ through walls using electromagnetic waves. TWRI is highly desirable for a range of organizations, including police, rescue personnel missions, surveillance, first responders, and defense forces [1,2]. Most through-the-wall radars in use often require a close position to the wall or they have to be pressed against the wall. Moreover, TWRI mainly focuses on behind-the-wall tar-get. These systems only have the single-wall penetrating ability, providing range, cross-range, and motion infor-mation of behind-the-wall targets [3-5].
In recent years, some research institutes in America and Europe are focusing on through-the-wall radar systems which have the ability of reconstructing the interior layout of a building. These systems will greatly improve security, response time, covertness, and reli-ability of the firefighting and law enforcement tasks. Typical systems include the SAPPHIRE system designed
by the Netherlands Organization for Applied Scientific (TNO) and the Visibuilding program sponsored by the Defense Advanced Research Projects Agency (DARPA). The operating principle of SAPPHIRE is detecting and identifying the principal scatterers inside a building, and then deducing the interior layout [3,4]. Visibuilding program uses model-based signal processing method to reconstruct the building layout. In addition, the Army Research Laboratory (ARL) had conducted several field experiments to image an abandoned barrack. During the experiment, the radar system moves along two mutual vertical sides and the two radar images are synthesized coherently to reconstruct the interior layout [6,7].
For specific building interior layout reconstruction methods in literatures, they are divided into two types: the first one is using multi-look fusion approach to through-the-wall radar images from multi-view measure-ments, such as the experimental system of ARL men-tioned above; the other one is analyzing through-the-wall radar image and extracting the principal scatterers inside the building, namely, obtaining the position and orienta-tion from region of interest (ROI) of the wall-wall-floor trihedral, then using reasonable deducing method to infer the interior layout, such as SAPPHIRE system. Comparing * Correspondence:[email protected]
College of Electronic Science and Engineering, National University of Defense Technology, Changsha, Hunan 410073, China
with the first type, the advantage of the second type lies in using the electromagnetic scattering characteristics suffi-ciently, keeping away from the influence of clutter and multi-path propagation and ensuring robustness [8].
In our previous work [9], a method of acquiring the attributes of a trihedral is presented. The orientation in-formation of all the trihedrals in a through-the-wall radar image can be obtained by a virtual aperture im-aging model [10]. In addition, the estimation accuracy satisfies the requirements of reconstructing the building interior layout. Therefore, this paper mainly focuses on designing the reconstruction method. If the position and orientation information of all the trihedrals ap-peared in through-the-wall radar image are known, the whole building interior layout can be obtained immedi-ately by direct artificial judgment on one-time [3,11]. However, they are based on simulation data only and lack high automation.
The problem of the one-time artificial judgment is that the reconstruction accuracy depends greatly on the signal-to-noise ratio (SNR) of through-the-wall radar image. Once there exist interference targets or un-detected wall-wall-floor trihedrals, the reconstructed layout will be different from the true layout. Therefore, some researchers propose an iterative reconstruction method based on electromagnetic scattering model [8,12]. This method is formed by prediction stage and test stage. The prediction stage in the iterative proced-ure is the same as one-time reconstruction process. The predicted radar image can be obtained according to the predicted layout using electromagnetic modeling method. During the test stage, the measured radar image and the predicted radar image should be compared to modify the predicted building model, making a more accurate de-scription of the building. Each iteration will add absent walls or cut out extra walls so as to be closer to the true layout of the building, comparing with the pre-iteration process. Then the positions of the wall-wall-floor trihe-drals will be more accurate after compensation of the wall parameters [13]. To improve the computation efficiency of the iterative reconstruction method, prevent manual inter-vention during the reconstruction process and realize on-line computation, an effective building interior layout auto-reconstruction method need to be investigated.
Without loss of generality, this paper focuses on com-mon building designs with regularity and rectilinearity. The interior walls are either perpendicular or parallel to the exterior walls. In addition, any closed structure is not allowed to be existed if the exterior walls of the building are eliminated. The graph-based reconstruc-tion method proposed in this paper comes from recent papers on the subject of floor plan estimation [14,15]. They also employ graph theory in its problem formula-tion. This paper proposes a graph-theoretical building
interior layout reconstruction method using the proto-type of their method. However, the way that graphs are employed in this paper is different: the edges of the graph are used to indicate the walls that are present or absent, and the nodes are used to represent the wall-wall-floor trihedrals inside the building.
This paper is organized as follows: Section 2 gives a brief description of the experimental system in the an-echoic chamber. Section 3 develops a graph-theoretical model for a rectangular floor plan which is called build-ing layout graph (BLG). After the graph elements and the weight of each edge are defined, the minimum span-ning tree (MST) method is used to reconstruct an ex-perimental building using the radar system mentioned in Section 2. Section 4 probes into how to improve the MST-based reconstruction method when there exist interference targets in the building and also presents the experimental results. Section 5 gives some remark-able conclusions.
2. Overview of the experimental system
Before we introduce the MST-based method, we will de-scribe the experimental system at first in this section. The proposed MST-based method is validated by the real data collected in an anechoic chamber, as is shown in Figure 1. The experimental system is composed of a vector network analyzer (VNA) and two horn antennas. The horn anten-nas fixed on the position system move from left to right, forming an aperture with 3.8 m in length. The azimuth interval is 0.05 m and the system covers the frequency band from 2 to 4 GHz with a step of 2 MHz.
3. MST-based reconstruction method for building layout
The building interior layout reconstruction algorithm presented in this paper is based on MST which belongs to the graph theory. In this section, we will define the el-ements in BLG and establish the relationship between the building interior layout reconstruction problem and the MST.
3.1 Elements in BLG and MST
Actually, if the walls are treated as the connected lines between a couple of nodes, the building interior layout can be treated as a weighted undirected graph. This graph will be named as BLG for short in the following text. A graph is usually denoted asG(V,E), whereVis the node set (or vertex set) and E is the weighted edge set which connects all the nodes. The node set, edge set, and other nomenclatures are defined as follows:
(ii) Edges: Walls existing between two adjacent nodes, all the edges in BLG are undirected.
(iii)Degree: It is used to describe a node. It means the number of walls which relates to the current wall-wall-floor trihedral node. For undirected graph, in-degree and out-degree are both treated as uniform degree with no difference. The degree of nodevis denoted asD(v).
(iv)Order: It is used to describe a graph. It means the number of trihedral nodes in the building graph and is denoted as |V|.
Positions and orientations of the wall-wall-floor trihe-drals are attributes of the node set. A weighted undirected graph can be developed if we have got all the trihedrals in-cluding their attributes through radar measurements. How to acquire these attributes has been researched. From [9], we have known that the pose angles of all the trihedrals in a radar image can be estimated by using a virtual aperture imaging model. It will not be discussed in this paper to avoid unnecessary repetition.
If a graph with any pair of nodes being connected by at least one edge, it is called connected graph. In a complete graph, any two nodes is connected by an edge. Therefore, a weighted complete undirected graph must be a connected graph. Given a weighted complete undirected graph G(V, E) with |V| =N, the number of trees (a sub-graph of G without closed loops) that connects all the nodes of the graph isNN−2. The MST is the tree with the minimum total weight, defined as the sum of the weight of each tree's edge.
As is mentioned afore, in a radar measurement data set consisting of reflected signals from principal scatterers, we consider the wall-wall-floor trihedrals as the nodes of a graph, the horizontal or vertical wall lines being the edges joining the nodes. Any possible layout predicted according to present nodes corresponds a spanning tree of the
weighted complete undirected graph BLG. If we have de-fined reasonable edge weight, we could make the total weight of the spanning tree corresponding to the correct interior layout to be minimum. By this way, we can trans-late the building interior layout reconstruction process into searching the MST of the complete weighted undir-ected graph. Therefore, how to construct the edge weight becomes the key of the reconstruction process.
3.2 Definition of edge weight in BLG
The purpose of defining edge weight is making equiva-lence between the correct building interior layout and the MST in BLG. Before we define the edge weight, we will give the definition of angle range of each trihedral node in advance. Figure 2 gives the angle range definition when the degree of a trihedral node equals 2, 3, and 4.θs means the starting angle andθemeans the ending angle. The angle range is denoted as [θs, θe]. Due to the rect-angular shape of the building, the orientation of trihedrals is divided into four quadrants.
Next, we will define the edge weight between a couple of trihedral nodes. To make correspondence between correct building interior layout and the MST in BLG,
0, 2
3 0, , 2
2 2
0, 2
( ) 2
D v D v( ) 3 D v( ) 4
2 , 3
3 2 2,
0,
3 2, 2
2 ,
Figure 2Definition of angle range of a node.
VNA: Agilent N5242A Control PC
Position System RF Cable
Port1 Port2
Ethernet Line
Control Cable
Transceiver Antennas Transceiver Antennas VNA
Position System
(a) (b)
the definition of the edge weightd(i,j) between a couple of nodes which are denoted as vi and vj should subject
to the following four conditions:
(i) Due to the rectangular shape of the building, if an edge connecting two nodes is closer to the horizontal or vertical direction than another edge, the weight of this edge should be smaller. In contrast, if an edge is farther from the node angle range which is defined above, the weight should be larger.
(ii) The edge weight should monotonically increase with its Euclid distance. Namely, one of two edges whose Euclid distance is smaller should also be smaller in weight if they have the same node angles.
(iii) If the edge weight is defined as an exponential form, the base number should not be equal to 1, and the power exponent should not be equal to 0. Otherwise, the weight cannot be distinguished from angle range and Euclid distance.
(iv) Considering that the positions of the nodes may be departed from their true positions and the position errors will influence the reconstructed interior layout, the edge weight should have a certain fault-tolerant ability for this error. In other words, the edge weight function should be continuous at the boundary of the angle range. It is not allowed to have a sudden jump in value at the starting angle
θsand the ending angleθe.
From the above four conditions, we could see that the edge weight between a couple of nodes should consider not only their Euclid distance but also the angle constraint. If we have constructed an edge weight that is satisfying the above four conditions, the building interior layout reconstruction process can be translated into searching the MST of BLG. The edge weight for the nodes vi and vj is defined in
(1) with (xi, yi) and (xj, yj) representing their position
where lij is the Euclid distance between node vi and
nodevj:
shown in Figure 3. L represents the perimeter of the building outline which is known in advance. The intro-duction ofL is to keep the base number from equaling to 1, matching the third condition. Otherwise, the edge weights will have no difference for Euclid distance.
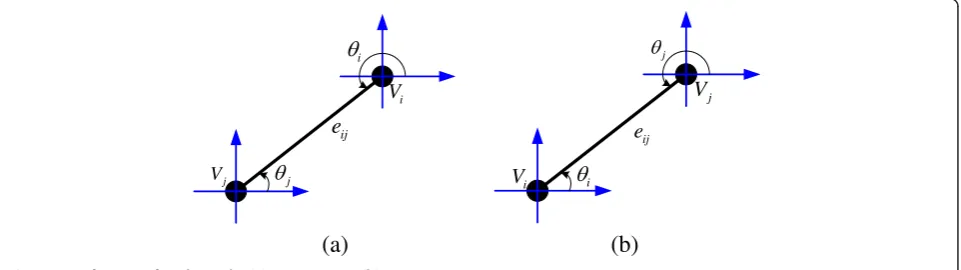
Considering the geometry relationship between any two nodes shown in Figure 3, the node angle is defined as follows:
In the edge weight definition, we will make some ana-lysis on the exponential formax(0 <a< 1). If 0 <a2<a1< 1
and power exponentx> 0,a2x<a1xwhenxis fixed. This
and 2π, making the edge weight between these two nodes get the minimum value. As a result, trigonomet-ric function is the basic form of the power exponent
γ(θi,θj) we considered, satisfying the first condition. According to the above description and conditions, the exponential term of the edge weight d(i, j) in the node angle range can be expressed as follows:
γ θð Þ ¼−jsin 2ð Þθ j þβ ðθ∈½θs;θe;β>1Þ ð4Þ
and
γ θi;θj
¼γ θð Þ þi γ θj ð5Þ
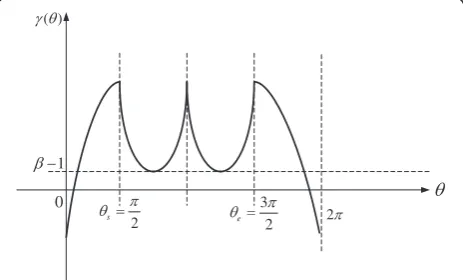
There is a variableβin the definition of power exponent
γ(θi,θj).βis introduced in order to keep the exponential term above zero. Thus,d(i,j) will increase with the Euclid distance when θi and θj are within the angle range. This feature matches the second condition.
In addition, edge weight should also keep symmetry out of the angle range, satisfying the fourth condition. Combining with (4), the power exponent definition shown in Figure 4 is considered. We take the starting angle θs=π/2 and the ending angle θe= 3π/2 as an ex-ample. The power exponent is in trigonometric form within the node angle range and in parabolic form out of the angle range. It will be similar when angle range adopts other values.
3.3 MST searching method
We have given the definition of edge weight of the BLG and made equivalence between the correct build-ing interior layout and the MST. Now we should focus on how to find the MST of the building graph so as to obtain the interior layout of the building.
The frequently used MST searching algorithms are the Kruskal algorithm and the Prim algorithm [16-18]. Both of these two algorithms come from greedy ideas. How-ever, proof has been shown that these algorithms would obtain the global optimization results instead of being
driven to the local optimization results. The Kruskal method needs to sort the edge weight only one time, while the Prim method needs to sort the edge weight more than one time. As a result, we have used the algo-rithm of Kruskal to construct our MST for computation ef-ficiency. The process of the Kruskal algorithm in building interior layout reconstruction is described with four steps:
Step 1: Using definition in (1) ~ (5), sort the edge weight of the weighted undirected building graph in ascending order;
Step 2: Seti= 1 and let the initial edge beE0=∅; Step 3: Select an edgeeiof minimum weight value not
inEi−1such thatTi= <Ei−1∪{ei} > is acyclic and defineEi=Ei−1∪ei. If no such edge exists, letT= <Ei> and stop;
Step 4: Replacei+ 1 byi. Return to step 3.
After N−1 iterations, where N is the order of the building layout graph, the complete MST is found. Thus, the building interior layout is obtained subsequently.
3.4 Experimental results
In the above sections, we have translated the building layout reconstruction problem into the MST searching problem. With the edge weight defined as (1) ~ (5) and the Kruskal algorithm, some simulations have been im-plemented and some valuable results are obtained. We have known that after the outmost trihedrals located on the outline which are called priori nodes are removed, the MST of the graph formed by the remaining nodes represents the interior layout of the building [19].
To validate the above MST method in real radar meas-urement data, we have constructed some experiments in the anechoic chamber using the radar system depicted in section 2. Figure 5a gives the photograph of the radar imaging scene. Figure 5b is the back projection (BP) result of the radar echo acquired by the VNA.
The ROI of the principal scatterers can be acquired by using constant false alarm rate (CFAR) detection method and morphology operation to the building radar image shown in Figure 5b. Hereto, we have obtained all the nodes in BLG including their position attributes. Due to the rectangular characteristics of the building, the orienta-tion of the wall-wall-floor trihedral has definite four types. As a result, the orientation attribute of the trihedral can be determined as soon as we have gotten their position at-tributes. Figure 6 is the MST result using the Kruskal method based on the extracted nodes from radar image as well as attribute information except priori nodes. Different colors represent different orientations of the node.
The result in Figure 6 represents the correct interior lay-out of the building in the anechoic chamber. Combining
3 2
e
2
s
( )
1
0
2
the priori outline information (shown by the dashed line), the whole layout of the building can be obtained.
4. Reconstruction of building layout with interferences
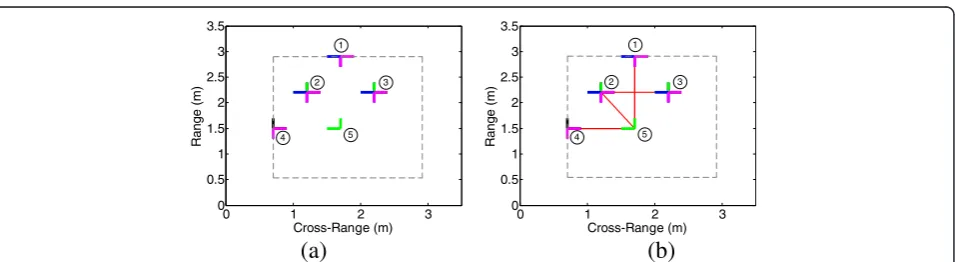
4.1 Drawback of the traditional MST-based method In practical radar measurements, there will usually be targets which are not principal scatterers such as human targets inside the building. These targets tend to bring about some interference target appearance in the radar image which do not belong to wall-wall-floor trihedral, resulting in some interference nodes in BLG and affect-ing the final reconstructed interior layout subsequently. Figure 7 presents the photograph of the anechoic cham-ber measurement scene with interference targets and the back projection (BP) imaging results of the radar return. Two metal cylinders are placed in the imaging area to simulate the interference targets inside the building.
The following figure is the reconstructed result using the classical Kruskal algorithm based on all the nodes except those priori nodes and their corresponding orientation
information. The orientation of the cylinder is considered to be omnidirectional, namely covers all the four quadrants. Figure 8a gives the nodes distribution in this case and they are denoted from 1 to 5. The generated MST is shown in Figure 8b.
4.2 Improved MST-based method
It is clear that the generated MST is different with the cor-rect building interior layout when the interference targets exist. As a result, we need to make some improvements of the traditional MST-based method. Considering the rectangular-shape assumption of the building, the inter-ior layout reconstruction procedure with interference nodes is improved as follows:
Step 1: Extract the trihedral nodes and dihedral edges information in the radar image;
Step 2: Search the MST with restricted conditions based on the nodes and edges information, denote the restricted MST asT1;
Step 3: Traverse every nodes ofT1and calculate the node angle;
Step 4: Pick out the nodes whose angle is not divisible byπ/2;
Step 5: Apply Kruskal algorithm to the remaining nodes. The generated MSTT2represents the final structure of the building.
Since the method of acquiring the principal scatterers such as dihedral and trihedral has been given in [8], how to extract the nodes and edges information of the BLG will not be discussed in this paper. We will focus on how to apply the MST-based method in building recon-struction when there exist some interference targets. From the procedure shown above, the key to this prob-lem is how to solve the MST with restricted conditions [20]. The restricted conditions are the nodes and edges information obtained from the building radar image. An edge extracted from the radar image means that the two
Figure 6MST of the anechoic chamber building.
(a)
(b)
nodes which are related to this edge should be con-nected in the final generated MST definitely. This prob-lem is described as follows using mathematical language. Assume G(V, E) is a weighted undirected connected graph,G1(V1,E1),…,Gr(Vr,Er) are thersubtrees which do
not intersect with each other. If a spanning treeT= (V,E') of the graph G contains all the existed subtree, namely, Ei⊂E' (i= 1, 2, …, r), moreover, the sum of all the edge
weight ofTis the minimum, thenTis called the MST of Gwith restricted conditionsG1,…,Gr.
For convenience, thersubtrees are merged into a forest T0= (V1∪…∪Vr,E1∪…∪Er),d(u,v) represents the weight
of the edge (u,v) connecting nodeuand nodev. The fol-lowing text gives the detailed construction method of MST with restricted conditions. The method is divided into two steps. iteration untilWn= 0. The forest characteristics will not be broken in the above iteration process due to the link of only one edge when adding nodes toUkeach time. Moreover, we have not carried connection inside the forest, so the number of trees in the forest keeps unchanged. When the recursion stops,Tn= (Un,Bn) will be a forest covering all the nodes inG. The originalGiwill be expanded intoG
0
Step 2: Add some appropriate edges toTnto make
it a spanning tree ofG. DenoteU00¼V01;W00¼V−
constructed, there existw0 inV
0
Figure 8MST with interference targets. (a)Node distribution.(b)MST generated by the Kruskal algorithm.
(a)
(b)
iteration will add one edge which connects two isolated tree. The spanning treeT ¼V;B0r−1ofG will be available when the iteration stops.
4.3 Experimental results with interferences
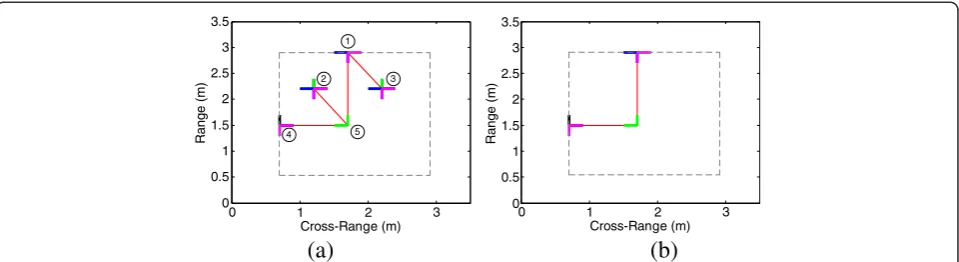
In [20], it has been proved that the spanning tree T obtained by the above two steps is the MST satisfying the restricted conditions. For the radar image shown in Figure 7b, it is clear that the final MST should contain the edge formed by node 4 and node 5 according to the extracted edge information. Moreover, the final MST should not contain the edge formed by node 2 and node 3 since the edge does not appear in the radar image. In order to apply the improved method, the weight between node 2 and node 3 is assumed to be in-finite. Figure 9a gives the MST generated by the above method. It is denoted asT1.
After we have gotten T1, the angle attribute of each
node can be calculated according to the definition in section 3.2. Those nodes which do not satisfy the horizon-tal or perpendicular conditions are picked out. Assume the degree of nodeviisp, its angle attribute is denoted as
(θi1,θi2,…,θip). If
mod θik;π 2
≠0;ðk¼1;2;⋯;pÞ ð8Þ
where mod(·) is the remainder operator, then node vi is
considered to be an interference node. It should be re-moved. In Figure9a, node 2 and node 3 are considered to be interference nodes and removed from the BLG. Finally, the Kruskal algorithm is used to the remaining nodes to generate a new MST which is denoted as T2. This
refreshed MST shown in Figure9b represents the final in-terior layout of the building. Therefore, the MST-based method can also be applied in building interior layout reconstruction even if there exist interference targets.
5. Conclusions
We have proposed a building interior layout recon-struction algorithm assuming that complete positions
and orientations information of the graph nodes have been obtained. The proposed MST-based method can also deal with the case when there exist interference targets. It is hoped that based on these preliminary re-sults, we are able to predict the building interior layout using radar measurements. However, in practical situ-ation, some trihedral nodes may not be detected in the radar image. Extension of this work is to solve this problem. It is presently under study and the results will be presented in our future research work.
Competing interests
The authors declare that they have no competing interests.
Acknowledgements
This work was supported by the National Natural Science Foundation of China under Grants 61271441, 61372161 and the Foundation for the Author of National Excellent Doctoral Dissertation of China under Grant 201046.
Received: 16 December 2013 Accepted: 27 February 2014 Published: 12 March 2014
References
1. EJ Baranoski, Through wall imaging: historical perspective and future directions, inProc. IEEE ICASSP, 2008, pp. 5173–5176
2. SE Borek, An overview of through the wall surveillance for homeland security, inProceedings of the 34th Applied Imagery and Pattern Recognition Workshop (AIPR05), 2005, p. 6
3. JJM de Wit, WL van Rossum, FMA Smits, SAPPHIRE: a novel building mapping radar, inProceedings of the 39th European Microwave Conference, 2009, pp. 1896–1899
4. JJM de Wit, L Anitori, WL van Rossum, RG Tan, Radar mapping of buildings using sparse reconstruction with an overcomplete dictionary, inProceedings of the 8th European Radar Conference, 2011, pp. 9–12
5. F Soldovieri, R Solimene, Through-wall imaging via a linear inverse scatter-ing algorithm. IEEE Geosci. Remote Sens. Lett.4(4), 513–517 (2007) 6. C Le, T Dogaru, L Nguyen, MA Ressler, Ultrawideband (UWB) radar imaging
of building interior: measurements and predictions. IEEE Trans. Geosci. Remote Sens.47(5), 1409–1420 (2009)
7. T Dogaru, A Sullivan, C Kenyon, C Le, Radar signature prediction for sensing-through-the-wall by Xpatch and AFDTD, inDoD High Performance Computing Modernization Program Users Group Conference, 2009, pp. 339–343
8. E Ertin, RL Moses, Through-the-wall SAR attributed scattering center feature estimation. IEEE Trans. Geosci. Remote Sens.47(5), 1338–1348 (2009) 9. B Chen, T Jin, Z Zhou, B Lu, Estimation of pose angle for trihedral in
ultrawideband virtual aperture radar. Prog. Electromagn. Res.
138, 307–325 (2013)
10. T Jin, J Lou, Z Zhou, Extraction of landmine features using a forward-looking ground penetrating radar with MIMO array. IEEE Trans. Geosci. Remote Sens.
50(10), 4135–4144 (2012)
11. P Chinling Chang,Near zone radar imaging and feature capture of building interiors. Thesis, The Ohio State University, 2008
12. N Subotic, E Keydel, J Burns, A Morgan, K Cooper, B Thelen, B Wilson, W Williams, S McCarty, B Lampe, B Mosher, D Setterdahl, Parametric reconstruction of internal building structures via canonical scattering mechanisms, inProc. IEEE ICASSP, 2008, pp. 5189–5192
13. T Jin, B Chen, Z Zhou, Image-domain estimation of wall parameters for autofocusing of through-the-wall SAR imagery. IEEE Trans. Geosci. Remote Sens.51(3), 1836–1843 (2013)
14. EM Lavely, Y Zhang, EH Hill III, Y Lai, P Weichman, A Chapman, Theoretical and experimental study of through-wall microwave tomography inverse problems. J. Frankl. Inst.345(6), 592–617 (2008)
15. G Hickman, JL Krolik, A graph-theoretic approach to constrained floor plan estimation from radar measurements. IEEE Trans. Signal Process.
57(5), 1877–1888 (2009)
16. RJ Allison, SP Goodwin, RJ Parker, SFP Zwart, R de Grijs, MBN Kouwenhoven, Using the minimum spanning tree to trace mass segregation. Mon. Not. R. Astron. Soc.395, 1449–1454 (2009)
17. S Sundar, A Singh, A swarm intelligence approach to the quadratic minimum spanning tree problem. Inf. Sci.180, 3182–3191 (2010) 18. R Campana, E Massaro, D Gasparrini, S Cutini, A Tramacere, A minimal
spanning tree algorithm for source detection inγ-ray images. Mon. Not. R. Astron. Soc.383, 1166–1174 (2008)
19. B Chen, T Jin, B Lu, Z Zhou, P Zheng, A graph-theoretic approach to building layout reconstruction from radar measurements, in2013 International Symposium on Antennas and Propagation (ISAP2013), 2013, pp. 1276–1279 20. X Wang, G Wang, On the least generated tree with restricted conditions.
J. Naval. Aeronaut. Eng. Acad.14(3), 235–236 (1999)
doi:10.1186/1687-6180-2014-31
Cite this article as:Chenet al.:Building interior layout reconstruction from through-the-wall radar image using MST-based method.EURASIP Journal on Advances in Signal Processing20142014:31.
Submit your manuscript to a
journal and benefi t from:
7 Convenient online submission
7 Rigorous peer review
7 Immediate publication on acceptance
7 Open access: articles freely available online
7 High visibility within the fi eld
7 Retaining the copyright to your article