Scholarship@Western
Scholarship@Western
Electronic Thesis and Dissertation Repository
1-19-2015 12:00 AM
Geography Aware Virtual Machine Migrations and Replications for
Geography Aware Virtual Machine Migrations and Replications for
Distributed Cloud Data Centers
Distributed Cloud Data Centers
Sakif Shahriar Pritom
The University of Western Ontario
Supervisor
Dr. Hanan Lutfiyya.
The University of Western Ontario Graduate Program in Computer Science
A thesis submitted in partial fulfillment of the requirements for the degree in Master of Science © Sakif Shahriar Pritom 2015
Follow this and additional works at: https://ir.lib.uwo.ca/etd Part of the Computer Sciences Commons
Recommended Citation Recommended Citation
Pritom, Sakif Shahriar, "Geography Aware Virtual Machine Migrations and Replications for Distributed Cloud Data Centers" (2015). Electronic Thesis and Dissertation Repository. 2682.
https://ir.lib.uwo.ca/etd/2682
This Dissertation/Thesis is brought to you for free and open access by Scholarship@Western. It has been accepted for inclusion in Electronic Thesis and Dissertation Repository by an authorized administrator of
(Thesis format: Monograph or Integrated Article)
by
Sakif Shahriar Pritom
Graduate Program in Computer Science
A thesis submitted in partial fulfillment of the requirements for the degree of
Master of Science
The School of Graduate and Postdoctoral Studies The University of Western Ontario
London, Ontario, Canada
ii
Abstract
Cloud computing provides access to computing resources for a fee. Client applications and
services can be hosted in clouds. Cloud computing typically uses a network of data centers
that are geographically dispersed. The distance between clients and applications is impacted
by geographical distance. The geographical distribution of client requests can be random and
difficult to predict. This suggests a need to reconsider the placement of services at run-time
through migration. This thesis describes a framework based on software-defined networking
(SDN) principles. It demonstrates algorithms that are periodically executed and determine
candidate services to migrate and replicate as well as target data centers to migrate to and
replicate to and an evaluation. The evaluation shows that effectiveness of the algorithms.
Keywords
Cloud Computing, Data Centers, Virtual Machine Migration, Virtual Machine Replication,
iii
Acknowledgments
First and foremost, I would like to express my heartiest gratitude to the Almighty, most
gracious, and most merciful, for providing me with the ability and patience to accomplish
this thesis successfully.
I would like to thank Dr. Hanan Lutfiyya for her constant guidance and supervision. Without
her strong motivation, valuable inspiration and esteemed guidance and support, this work
could not have been completed.
I would like to thank my wife, father, mother, and sister for their constant support and
encouragement. I would also like to thank all my teachers, friends and relatives for their
iv
Table of Contents
Abstract ... ii
Acknowledgments... iii
Table of Contents ... iv
List of Tables ... vii
List of Figures ... viii
List of Algorithms ... x
List of Appendices ... xi
Chapter 1 ... 1
1 Introduction ... 1
1.1 Background ... 1
1.2 Problem Statement ... 1
1.3 Thesis Focus... 3
1.4 Thesis Outline ... 4
Chapter 2 ... 5
2 Related Work ... 5
2.1 Background on Data Centers ... 5
2.2 Background on Software Defined Networking (SDN) ... 8
2.2.1 Architecture of SDN ... 10
2.3 Related Work for Data Center and Network Management through SDN ... 12
2.3.1 Load Balancing through SDN ... 12
2.3.2 Intra Data Center Management through SDN ... 13
2.3.3 SDN based Data Center Management Middleware ... 14
2.3.4 Policy Enforcement in Networks through SDN... 15
v
2.6 Reducing Latency to Virtual Machines ... 17
2.7 Discussion ... 18
Chapter 3 ... 19
3 Proposed System Framework ... 19
3.1 SDN Controller ... 20
3.2 The Classifier Module... 21
3.3 The Selector Module ... 22
3.4 The Migration Module ... 23
3.5 The Replication Module ... 23
Chapter 4 ... 25
4 Proposed Algorithms ... 25
4.1 Selector Algorithm 1 for Migration ... 25
4.2 Selector Algorithm 2 for Migration ... 27
4.3 Selector Algorithm for VM Replication ... 28
4.4 Summary ... 31
Chapter 5 ... 32
5 Experimental Design and Results ... 32
5.1 Simulation Environment ... 32
5.2 Simulation Parameters and Scenarios ... 32
5.3 Metrics for Evaluation ... 33
5.4 Results of VM migration algorithms ... 34
5.5 Results of VM replication algorithm ... 44
5.6 Discussion on the Experiments ... 50
Chapter 6 ... 52
vi
Appendices ... 60
vii
List of Tables
viii
List of Figures
Figure 1: A three-tier data center network [30] ... 6
Figure 2: Fat tree based data center network [30] ... 7
Figure 3: Fat DCell data center network [30] ... 7
Figure 4: Illustration of control and data elements in traditional networks and Software Defined Networks [4] ... 9
Figure 5: SDN Architecture [34] ... 11
Figure 6: Proposed System Framework ... 19
Figure 7: Interconnected SDN controllers of data centers ... 23
Figure 8: Scenario 1. Each data center has 5000 VMs ... 35
Figure 9: Scenario 1. Each data center has 1000 VMs ... 36
Figure 10: Scenario 1. Each data center has 200 VMs ... 37
Figure 11: Scenario 1. Percentage of candidate VMs for migration identified by Selector Algorithm-1... 37
Figure 12: Scenario 2: Each data center has 1000 VMs ... 39
Figure 13: Scenario 2: Each data center has 200 VMs ... 39
Figure 14: Scenario 3: Each data center has 1000 VMs ... 40
Figure 15: Scenario 3: Each data center has 200 VMs ... 41
Figure 16: Scenario 4: Each data center has 1000 VMs ... 42
Figure 17: Scenario 4: Each data center has 200 VMs ... 42
ix
Figure 20: Scenario 1. Each data center has 5000 VMs ... 45
Figure 21: Scenario 1. Each data center has 1000 VMs ... 46
Figure 22: Scenario 1. Each data center has 200 VMs ... 47
Figure 23: Scenario 1. 200 VMs per DC ... 48
Figure 24: Scenario 4. 1000 VM per DC ... 49
Figure 25: Scenario 4. 200 VMs per DC ... 49
x
List of Algorithms
Algorithm 1: Selector Algorithm 1 ... 26
Algorithm 2: Selector Algorithm 2 ... 28
xi
List of Appendices
Appendix A: Percentage of Expected Improvement for Migration Algorithms ... 60
Appendix B: Percentage of candidate VM identified for Migration Algorithms ... 91
Appendix C: Percentage of Expected Improvement for Replication Algorithm ... 96
Chapter 1
1
Introduction
1.1 Background
A data center is a collection of networked computational and storage resources. Cloud
computing uses a network of data centers to provide access to computing resources for
client applications on a pay-per-usage basis. Access to computing resources is enabled by
virtualization technology, which allows access to computing resources by renting virtual
machines (VMs). Applications and services can be hosted in data centers through the use
of virtual machines [19].
Cloud computing offers infrastructure, platform and software as a service to its clients on
a pay per usage basis. Many of the small, large and medium scale organizations are
shifting their infrastructure into cloud in order to reduce operational and maintenance cost
and overhead. Various web based service and applications are offered through Cloud
Computing. Cloud computing has been widely adopted with Cisco predicting that by
2017 nearly two thirds of all workloads will be processed in the cloud [19].
Clients of the applications communicate with the services hosted in the VMs. Many
applications have clients all over the world. An application is expected to provide faster
access and transmission of data to its clients if it is geographically close to its clients, as
some of the research work suggests that geographical distance has impact on quality of
service (QoS) [7,8,12]. In order to provide a faster access and data transfer, applications
which have clients all over the world should be hosted in a data center, which is on
average close to its clients geographically.
1.2 Problem Statement
A cloud service provider that manages multiple and geographically distributed data
centers needs to carefully consider the placement of VMs. The VMs should be placed in
data centers that are close to its clients. The quality of service for clients is dependent on
Lampe et al. [8], and Satyanarayanan et al. [12] show that geographical distances impacts
latency. Satyanarayanan et al. [12] and Lampe et al. [8], illustrate that latency has an
impact on the user experience for interactive and gaming applications. This suggests that
for a client, the time it takes to receive a response to a request is impacted by the distance
of the client from the data center, which is currently hosting the VM that the client is
sending its request to. To some degree the work also suggests that the impact of latency
increases with higher amounts of data being transferred.
However, the clients of application services hosted by the cloud provider are not always
known a priori and the geographical distribution of requests from clients can be random
and difficult to predict. Web based services and applications such as social networking,
online gaming, virtual tour guide, mail clients etc. have clients from a variety of locations
and countries. For such applications, the complete client list is not known as a priori.
Clients may be anywhere in the world. An application may have worldwide popularity
with a high number of clients but the distribution of clients from different parts of the
world may not be even. For example, the US has the highest number of users in the world
for both Facebook and Twitter. However, China has the largest population in the world
and its population is more than four times of that in the US and yet China is not found in
top ten Facebook or Twitter user countries by number of users as they use local social
networks such as Qzone and Renren [22, 23, 24].
In recent years there has been a huge growth in mobile applications [48]. Mobile devices
have limited storage capacity, slow processors and limited battery life. One approach for
enabling users of mobile devices to be able to use resource-intensive applications is to
have part of the application run on remote servers, which may be part of a cloud
infrastructure. The application component that executes on the remote server typically
has high computational needs and/or requires access to data [28]. These high
computational needs are not easily available on the mobile device. Regardless of the
network distance between the cloud infrastructure and the mobile device, the use of a
remote service is well suited for mobile device applications with relatively little data to
make this approach unsuitable for applications that require larger amounts of data to be
transferred and/or have a high level of interactiveness with the user.
Popular mobile device platforms such as Android, iOS, Windows etc. are widely used all
over the world and so a cloud based mobile application can have users from all over the
world [29]. Many such applications are available in online application markets, e.g.,
Google Play Store, Apple App, store for installation. As an example, a cloud based
encyclopedia or English to English dictionary can be downloaded and installed by anyone
at any time, so the complete client list is not possible to retrieve a priori before launching
the application in market. This implies that an initial placement may not be optimal over
time since the clients and the distribution of clients will probably change.
There is a need to monitor communication patterns between the VMs and their
corresponding clients in order to update the client list of the VMs. If needed VMs could
be migrated to other data centers if it is determined that migrating the VM to some other
data center will result in reduced time to access and transfer data. With an increase in
workload and clients, a replica of the VM can be also beneficial if the VM owner is
willing to pay for the extra VM. The new replica of the VM should be also placed in a
data center that will reduce the access and data transfer time of its clients significantly.
1.3 Thesis Focus
There is a body of work that considers geographical distance in reducing latency and thus
improves performance. For example, Alicherry et al. [2] minimizes the maximum
distance between data centers hosting multiple dependent VMs. Little work considers the
distance of VMs from its users.
This thesis focuses on decreasing the average distance of the clients from the VMs that
the client is using through VM migration. Two new VM migration algorithms were
developed that reduce time to data access and transfer for the clients of a VM by
When warranted replication of a VM is used. Replicating a VM and hosting the
replicated VM in the same data center that hosts the primary VM does not help to reduce
the time to access and transfer data for the clients, as all the requests will be served from
the same data center. We have also proposed a VM replication algorithm that creates a
copy of the VM in a suitable data center. The replication algorithm has similar goals to
the migration algorithms.
We exploited the programmable network architecture of Software Defined Networking
(SDN) to propose a framework to deploy our algorithms in the network of connected data
centers.
1.4 Thesis Outline
The thesis is organized as follows: Chapter 2 describes the related and relevant works
about this area. Chapter 3 describes our proposed framework for deploying our proposed
algorithms. Chapter 4 describes our proposed algorithms for VM migration and
replication in order to reduce load-distance of the clients from the VM. Chapter 5
describes the experiments and presents the results of the experiments. Chapter 6 discusses
Chapter 2
2
Related Work
This thesis describes a novel approach to dynamically placing VMs geographically close
to its clients. There is a body of work that considers geographical distance in reducing
latency and thus improves performance. For example, Alicherry et al. [2] minimizes the
maximum distance between data centers hosting multiple dependent VMs. Little work
considers the distance of VMs from its users. The proposed approaches to address the
problem stated in Chapter 1 are based on a Software Defined Networking (SDN)
framework. This chapter describes data center organization and Software Defined
Networking in Section 2.1 and 2.2. Section 2.3 describes innovative work that uses SDN
to facilitate data centers and network management. Sections 2.4 and 2.5 illustrate some of
the uses of VM migration and VM replication Section 2.6 describes some of the work
that focuses on reducing latency. Section 2.7 discusses and summarizes the related work.
2.1 Background on Data Centers
A data center is a pool of connected computational, storage and network resources. The
data center network has a pivotal role for the overall performance, efficiency and
effectiveness of the data center as it connects the data center computing and storage
resources to each other. A cloud refers to a set of interconnected data centers.
Data center networks are typically organized as layers where each layer is assigned a
specific functionality. The layered model facilitates the management of the data center
network. For example, troubleshooting is easier when the network is segmented.
A data center network use one of these layered models: three-tier network, fat tree
network or DCell Network [30]. Three-tier data center networks are the most widely used
[31]. In a a three-tier data center network, servers in racks are directly connected to a
switch that are called either edge layer switches or Top of Rack (TOR) switches. The
aggregation switches are responsible for interconnecting multiple edge layer switches
connected to every aggregation switch to ensure fault tolerance and to prevent a single
point of failure. A major disadvantage of the three-tier data center network is that it is
extensively power hungry and it suffers from oversubscription of available bandwidth.
[30]. Figure 1 depicts a three tier data center network.
Figure 1: A three-tier data center network [30]
The fat tree architecture was proposed as a mechanism to increase end-to-end bandwidth
with a lower cost and lower energy consumption [30]. The network structure is composed
of n pods where each pod contains n servers and n switches. For each pod, switches are
organized in aggregation and edge layers with n/2 switches in each layer. Every lower
layer switch in the pod is connected to n/2 hosts in the pod and n/2 upper layer switches
of the pod. There are (n/2)2 core level switches, each connected to one aggregation layer
switch from each of the pods [30]. Each aggregation switch is connected to a core layer
switch Figure 2 depicts a fat tree data center network for n=4.
In a DCell data center network, the data center is organized as a hierarchy of cells or
pods. It is regarded as a highly scalable as well as complicated structure [30]. The
building block of the system is called DCell0. A DCell0 unit consists of n servers and a
mini network switch [30]. Each server is connected to the switch of its cell and a server
of another cell of the same level. Higher levels of cells are built by connecting multiple
lower level cells. Each DCelln-1 is connected to all other DCelln-1 within the same
DCelln. As an example, DCell1 is comprised of multiple DCell0 units where each DCell0
unit is connected to all of the other DCell0 units within the same DCell1. Figure 3
Figure 2: Fat tree based data center network [30]
Data centers are expected to provide sufficient resources to client applications while
minimizing power consumption. Resource allocation algorithms for data centers should
consider policies for allocating virtual machines (VMs), the physical distribution of
servers, adequate networking bandwidth and the physical location of data.
2.2 Background on Software Defined Networking (SDN)
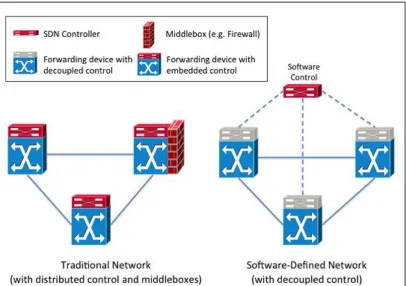
Computer networks typically have these network devices: (i) Routers forward data
packets between computer networks; and (ii) Switches that link network segments. Each
network device has a control plane that makes decisions on the next communication link
to be used to transfer data, and a data plane that is responsible for forwarding the packet
according to the control logic. Traditional network devices have the control plane and
data plane coupled to each other. Software Defined Networking is a networking
architecture where control logic is physically decoupled from the data plane.
Software Defined Networking (SDN) allows the network administrator to handle lower
level network services and functionalities through abstraction [4]. SDN requires special
network elements and an SDN controller to be deployed in the network. The role of an
SDN controller is to provide the intelligence of the network where other network
elements are used only for packet forwarding. An SDN controller has control over the
data plane or the forwarding elements. SDN controllers can be physically distributed or
centralized but logically centralized. With this physical separation of the control plane
from the data plane, SDN aims to control network devices programmatically. A
comparison of control and data elements between traditional networking and SDN is
Figure 4: Illustration of control and data elements in traditional networks and
Software Defined Networks [4]
Network administrators provide the network policies, e.g. maximum throughput or
minimum delay, via the controller through a programmatic approach. The controller
communicates with underlying network elements. Controllers need special protocols to
communicate with underlying network elements and the network elements must have the
mechanism to receive instructions from the controller to act accordingly. Two of the
protocols found in the literature are the Openflow [33] and ForCES (Forwarding and
Control Element Separation) [32].
The controller can be compared to an operating system or network operating system.
Applications are written on top of the controller and communicate with the controller by
a specific API. Network administrators are users of those applications and enforce
management policies through a Graphical User Interface. The controller has modules that
receive upper level instructions that are converted into Openflow commands and hence
The deployment of SDN can facilitate computer networking in numerous ways by
allowing a wide range of services and applications to be deployed. The controller is able
to communicate with a set of network elements and hence it can monitor the network
status and receive information on network traffic, link or device failure, inclusion and
exclusion of devices etc. Moreover, an SDN controller can monitor the network on a per
flow basis. This information can be exploited to deploy new and innovative services such
as power optimization of the network or a more efficient load balancing etc.
2.2.1
Architecture of SDN
An SDN architecture has three basic layers: Application layer, Control Layer and
Infrastructure Layer. The network is programmed through the applications in the
Application layer, where applications use an SDN controller (Control Layer) to
configure network devices (Infrastructure Layer). Thus, the Control Layer has to
communicate with the Application Layer as well as the Infrastructure Layer.
Communication between the Application Layer and Control Layer is known as
Northbound communication while Control Layer to Infrastructure Layer
communication is known as Southbound communication. Figure 5 depicts the SDN
Figure 5: SDN Architecture [34]
The Application layer is the topmost layer of this three layered architecture. The
application layer of SDN consists of various network applications designed for both
various services or to enforce management policies. Applications use SDN controllers to
achieve desired network behavior. Applications receive network level information and
statistics such as packet arrival rate, link or device failure etc., specify their
requirements programmatically to the SDN controller and receive feedback on its
desired action. An application can be written to enforce network management policies
e.g., balance the load on all the servers in the data center. The range of possible
applications is huge with the potential for a great deal of innovation in networking [4].
The Control layer consists of SDN Controllers. The SDN controller translates
requirements of network applications (e.g. a network application may request a shortest
available path to be used) to configure the forwarding devices. The controller needs
special protocols to communicate with the forwarding devices. The controller is
compared to a Network Operating System as its functionalities mimics the
functionality of an operating system. The infrastructure layer consists of the network
support SDN architecture, specialized hardware and devices are required which are
dynamically programmable through an SDN controller. These devices do not have a
control plane as the control part is consolidated in the SDN controller and act only
as forwarding devices.
2.3 Related
Work
for
Data
Center
and
Network
Management through SDN
There has been considerable research that focuses on supporting the functionality of data
center management and network management through SDN. This section will describe
some of the research work conducted in order to facilitate network management, data
centers and clouds using SDN.
2.3.1
Load Balancing through SDN
Many online services, e.g. webserver, search engine, social networking, replicate services
across multiple physical servers. The use of replication allows for better reliability and
greater throughput. A front-end load balancer directs each client request to one of the
servers with the goal of balancing traffic across the servers. Dedicated load balancers are
expensive, become overloaded since all requests go through the load balancer and are a
single point of failure. SDN and Openflow can be used for load balancing for both
structured networks such as data centers [16] and unstructured networks such as
enterprise and campus networks [35].
OpenFlow provides an approach to load balancing based on packet-handling rules
installed by an SDN controller. However, installing separate rules for each connection
may lead to a huge number of rules in switches and may result in a heavy load for the
switches and the controller. Openflow does not support hashing for load balancing and
thus Wang et. al. [16] proposed to exploit the use of wildcard rules for a scalable solution
for handling large volumes of traffic and proposed an algorithm for load balancing which
automatically adjusts to changes in load balancing policies.
The proposed Openflow load balancer described in Wang et al. [16] proactively installs
involving the controller. Dynamic redistribution of traffic only requires the installation of
new rules in switches.
Handigol et. al. [35] proposed the “Plug-n-Serve”, a load balancing scheme for
unstructured network such as enterprise and campus network. “Plug-n-Serve” is based on
customized flow routing and attempts to minimize the response time through effective
load balancing across the servers. Plug-n-Serve considers loads on servers and available
routing paths in order to minimize response time of servers. A prototype of the proposed
load balancer was tested in the Computer Science building at Stanford University. The
test includes the scenarios of inclusion/removal of servers, varying the traffic load and
changing the load balancing algorithm.
2.3.2
Intra Data Center Management through SDN
In a data center, almost 70% of the power consumption is due to servers and about 10%
of the power is consumed for energy conversion and data center maintenance. However,
network elements (e.g., switches, routers, links) consume almost 20% of the power [37].
Thus power saving practices that involve network devices could result in notable power
savings. The general practice with the network resources is to always keep devices on.
However network traffic is dynamic and changes over months, weeks, days and even
hours. Power consumption of network devices are not energy proportional which means
that the network devices consume energy at a rate that does not vary much even as
network traffic load varies greatly [37]. Thus significant energy savings cannot be done
by changing network demand.
ElasticTree [37] provides a mechanism that dynamically adjusts a set of active network
elements, e.g., links and switches, such that the current network load can be satisfied with
minimum power consumption. This is defined as the minimum powered network subnet.
The minimum power network subset is the set of network elements which must be kept
activated in order to satisfy network performance and fault tolerance goals while keeping
the power consumption minimal. ElasticTree is based on three logical modules as
applying ElasticTree to the data center network is 25% to 40%, which implies up to 8%
of overall consumed energy of data center.
Another approach is seen with Hedera [38]. If more than one long lived flow passes
through same output port, there will be a drastic drop in bisection bandwidth1 utilization
as both the flows will be transmitting through the same link simultaneously. However,
intelligent flow placement could prevent the collision of flows in the same link. Hedera
introduces a new dynamic flow scheduling algorithm which is scalable and maximizes
the utilization of bisection bandwidth [38]. Hedera collects flow information from
switches and computes non-conflicting paths for all flows exploiting the redundant paths.
Hedera is based on three basic steps. (1) It detects large flows (a flow that consists of a
large number of packets) at the TOR switches. (2) It estimates the natural demand2 of
large flows. (3) It uses placement algorithms to compute non-overlapping paths for them,
and then these paths are installed on the Openflow switches through an SDN controller.
To distribute the traffic in as many as possible core switches, a packet’s path is
non-deterministic from edge to core switch, and is non-deterministic returning from the core
switches to its destination edge switch.
2.3.3
SDN based Data Center Management Middleware
Researchers have proposed middleware that needed to support dynamic resource
allocation. Several examples are Meridan [3], LiveCloud [39] and NOX [14].
The proposed middleware allow cloud service providers to provide complex services
where customers are provided with network layer constructs and can configure the virtual
topology for deployment of their applications. Deployment of such complex applications
and dealing with numerous resources (e.g. computing, storage, network etc.) makes data
center management difficult and challenging, as well as requires sophisticated network
1
The bisection bandwidth of a network is the minimum bandwidth along all possible bisections of the network.
2 A TCP flow’s natural demand is defined as the rate it would grow to in a fully non-blocking network,
and resource management architecture. Any management scheme should address issues
related to visibility, orchestration and provision. Visibility refers to the continuous
monitoring of network states, resources and quality of service. Orchestration refers to
Quality of Service (QoS) aware resource allocation and coordination. Traditional
solutions may suffer due to limited support for network resources in orchestration as most
of the cloud management lack in integration of network resources. SDN based network
and resource management scheme can provide more programmability and fine grained
monitoring and control over the network, computing and storage resources.
2.3.4
Policy Enforcement in Networks through SDN
Network applications can have various Quality of Service (QoS) requirements such as
latency, throughput, jitter etc. Service Level Agreements (SLA) is established to ensure
QoS requirements of such applications are maintained. Policy based network
management is a network management framework where a network manager uses
Service Level Agreements and service level objectives to deduce network level policies
which afterwards are mapped into device level primitives. Traditional policy based
network management approaches require installation of specialized software or hardware
component in the network. Bari et. al. [40] proposed PolicyCop which is an autonomic
QoS policy enforcement framework exploiting the network programmability of SDN.
PolicyCop consists of a Data Plane, Control Plane and Management Plane. The
underlying network is required to be built from OpenFlow switches. PolicyCop was used
for reacting to link failures and throughput requirements to being satisfied at runtime.
Experiments show that PolicyCop is able to re-route the flows to an alternate route in
case of a link failure. When two or more flows with specific throughput requirements
collide in a single link, it can re-route the flows to some alternate route in order to restore
the required throughput.
2.4 Virtual Machine Migration
VM migration is the strategy of transferring a VM from one host machine to another.
Some of the works uses VM migration to optimize power efficiency, minimize traffic
Shrivastava et. al. [15] proposed a VM migration strategy in data centers that considers
the network topology and the dependencies between VMs in order to decrease network
traffic between VMs. The work focuses on using VM migration to reduce network traffic
between VMs rather than considering multiple clients, multiple data centers and client
data access and transfer time.
Foster et. al. [6] proposed a method for dynamically switching between management
strategies where they used VM migration in order to prevent Service Level Agreement
(SLA) violation as well as keeping the power consumption of the data center minimum.
The resource demand of a VM is dynamic and changes with time, which indicates that
static allocation of VMs over servers, may cause the server to be over utilized or
underutilized at different time stamp. This work focuses on migration VMs from
underutilized hosts in order shut down the host in order to save power. The proposed
strategy also migrate VMs from over loaded hosts to prevent SLA violation.
Hirofuchi et. al. [42] proposed a live migration of VMs over wide area network. Live
migration of virtual machines can affect the I/O performance of the running service. This
works aims to minimize the impact on I/O performance while migrating the VM over a
wide area network.
2.5 Virtual Machine Replication
VM replication is the process of creating a replica of a VM, usually done to distribute
load across multiple VMs to present performance issues due to overloaded VMs as well
as preventing a single point of failure. VM replication can improve fault tolerance,
reliability as well as accessibility of a service. The workload of processing client requests
is shared among the VMs.
Keller et. al. [43] suggests that when the combined resource needs of the VMs of a
physical host exceeds the resource availability (stressed situation), VM migration and
replication can be used to improve the situation. The conducted experiments suggest that
when a VM is in a stressed situation, VM replication is preferred over VM migration and
Goudarzi et. al. [44] proposed a possible use of VM replication for energy efficiency in
cloud computing. Creating multiple copies of a VM and distributing workloads between
these VMs helps in reducing resource requirements of each copy of a VM. This work
suggests that such VMs with low resource requirements can be managed to utilize the
servers more efficiently in order to reduce energy consumption.
Yuyang Du et. al. [46] proposed a VM replication strategy to improve reliability of a
running VM. The work proposes to frequently replicate the state of a primary VM and
thus the replicated VM can take over for any failure or crash of the primary VM.
2.6 Reducing Latency to Virtual Machines
Alicherry et al. [2] proposed their algorithm, which aims to minimize the maximum
distance between data centers hosting multiple dependent VMs. Their algorithm
considers the inter data center distance between distributed data centers and aims to
minimize the distance between any two data center for dependent VM placement in
multiple data center. This work does not consider the location of clients. This approach
is aimed to reduce inter VM communication time, but overlooks the communication time
between clients and corresponding VMs.
Sharkh et. al. [1] proposed two heuristic algorithms to reduce the average tardiness of a
client’s request of connecting a VM to another VM or a client node. The work described
in [1] attempts to schedule resources (CPU, memory, storage) minimizing the average
tardiness of the request as well as minimizing resource blocking. The work proposes the
possible use of an SDN controller in order to keep track of the resources as well as
handling newly arriving requests. However, multiple clients and the geographical
location of the client were not considered.
Piao et. al. [9] assumed that data accessed by VMs are stored in distributed federated
storage. This work also assumes that different hosts in a single data center have different
access times for different storage units. Based on the requirements of accessing storage of
algorithm in order to reduce time to access storage. It does not consider multiple clients
nor access or data transfer time of the clients.
None of the work considers multiple clients from different geographical location
communicating with the same VM.
2.7 Discussion
Various web based services and applications are shifting into cloud data centers, which
have multiple clients from different geographical regions. Some of the work in the
literature considers the distance between dependent VMs, as well as distance between
VMs and data storage. However, after the computation is done by the VM, the output is
eventually sent back to the client. As a result, the distance between the clients and the
VM is expected to play a vital role in order to provide a faster service, especially for data
intensive applications. To the best of our knowledge, none of the related work considers
Chapter 3
3
Proposed System Framework
This chapter describes a framework for a system that identifies potential candidate VMs
to migrate or replicate to target data centers. This work assumes that a geographic area
is partitioned into N geographical regions denoted by R0, …, Rn-1, where region Ri is
served by data center DCi. Each request is classified into a region based on the origin of
the request. A request from a client entering the data center results in a flow, where a
flow is defined as a sequence of packets traversing a network that share a set of header
field values. The classification is used as input to an algorithm that determines if a VM
should be migrated or replicated to a different data center. Figure 6 depicts the
framework. The framework assumes the use of Software-Defined Networking (SDN).
SDN can be used to develop innovative management system e.g., [3,10,14].
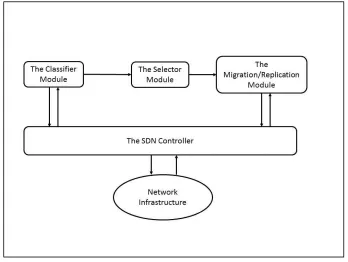
Figure 6: Proposed System Framework
Our proposed framework comprised of an SDN controller, the classifier module, the
module or replication module is used to support migration or replication respectively
along with the rest of the modules. Section 3.1 describes the functionality of an SDN
controller in the framework. Section 3.2 describes the classifier module. Section 3.3
outlines the selector module. Section 3.4 and 3.5 describes the migration module and the
replication module respectively.
3.1 SDN Controller
Software Defined Networking (SDN) is a network architecture where the control plane is
physically decoupled from the data plane and thus the network is directly programmable
through a controller, known as an SDN controller [4]. An SDN controller controls a set of
network devices through a well-defined API. Routers and switches have flow tables with
entries that specify conditions (rules) that if true result in defined actions. Conditions can
use wildcards on source and destination IP addresses to reduce the number of flow entries
[16].
The proposed framework assumes that there is an SDN controller associated with each
data center. A boundary router receives all flows to the data center. For the first packet
of the first flow that arrives from a region, the packet is forwarded to the controller since
there is no flow rule installed. A flow entry for that region and destination is sent to the
boundary router by the SDN controller. A flow entry includes statistics related to the
packets that are received. This allows for the flow of a load to be determined. This does
not scale for large systems as noted by Wang et al. [16]. Data centers would require a
huge flow table. Wang et al. proposes the use of a wildcard to reduce the number of
entries. However, this results in loss of flow information. Wette [17] proposes an
approach that requires an extension of OpenFlow to address this issue.
An SDN controller can update forwarding tables of switches and routers and redirect the
flows to support live migration of VMs [16]. If a migration is triggered, the SDN
controller of the data center that currently hosts the VM will alter the flow tables and
redirect the flows to the target data center in order to prevent any loss in communication
install corresponding flow entries for the incoming VM. If a replication is triggered, the
SDN controller of the target data center will install corresponding flow entries in the
switches and routers of the target data center to support routing to the newly created VM.
3.2 The Classifier Module
This module is responsible for classifying each flow to a geographical region. One
possible approach to identifying a region is to use the source IP address of the flow. An
SDN controller can be used to gather flow information as described in [17].
The Classifier module collects information on the flows and the origin3 and the
destination4 IP of each flow from the boundary router of the data center through the SDN
controller. It maintains a separate list containing the origin, load and region of each flow
for every VM in the data center in order to classify each flow into a region. To identify
the region by source/destination IP of the flow, a pre-existing geographical vicinity list of
countries and corresponding regions that states the rule for classification in a predefined
manner based on geographical vicinity is maintained. In such a list, a matching rule is
provided of IP addresses for region classification and thus region is determined locally
avoiding the network overhead. Assume that, the cloud service provider has three data
centers in Canada, India and Australia. This implies three regions. Flows originating
from any country will by classified into the region which is geographically nearest to the
origin using the pre-existing geographical vicinity list.
The pre-existing vicinity list will contain the list of countries and corresponding regions
based on geographical vicinity. Upon arrival of a flow, the country of origin of the flow
can be obtained by from the IP address of the flow [47]. The vicinity list should have
possible corresponding entries for each country that results in a specific region. Thus the
region of a flow can be obtained using the IP address.
3
By origin of a flow, we refer to the source IP address of a flow which is destined for a VM in the data center.
4 By destination of a flow, we refer to the destination IP address of a flow which is originated from a VM in
3.3 The Selector Module
The selector module is responsible for identifying the potential candidate VMs for
migration using the classification provided by the classifier module. The module can also
suggest a target data center for creating a replica of the VM at the discretion of the VM
owner (Another replica of the VM may improve response time but incurs additional cost).
Chapter 4 presents several algorithms that use the load-distance metric, which is
calculated for each flow. The load-distance for a flow from a VMi is the product of the
distance between VMi and the requestor that initiated the flow and the load. If the set of
flows associated with VMi is fi then fij represents a single flow. This load-distance metric
can be calculated for any flow, fij, and is calculated as product of the load and the
distance between the VM and origin of the flow. Assume there are M flows that
communicate with a VM and the distances are di0, …. di,M-1 and the loads are li0 … li,M-1 .
The average load-distance is calculated as follows:
∑
⁄
The product is referred to as the weighted distance.
As noted earlier the geographical distance impacts latency, which may impact the user
experience. The distance in itself is not sufficient since it does not take into account the
number of packets sent, which we use to represent the load of a flow. Distance can be
measured as the hop count of the source IP of a flow from the data center or the
turn-around time, and the number of packets is information that can be gathered from a
switch. The Selector module invokes the migration module with the information of
potential candidate VMs and their corresponding target data centers to carry out a live
migration of the candidate VMs in corresponding target data centers. The VM can be
replicated given that the owner will pay the additional cost of the new VM (which is a
clone or replica of the primary VM). In such cases, the selector module will invoke the
3.4 The Migration Module
The migration module receives the set of candidate VMs for migration. For each
candidate VM, the migration module invokes a migration request to the resource
managers of the target data center. The resource managers of the target data center
checks the resource availability of the data center to determine whether it can support the
migration. If the target data center acknowledges that it has sufficient resources, and thus
can accommodate the candidate VM, the migration module initiates the migration
through the use of the SDN controller that programmatically removes the matching
forwarding entries of the switches for migrating VMs and redirects the flows to the
appropriate data center. Both data centers update their resource status after each
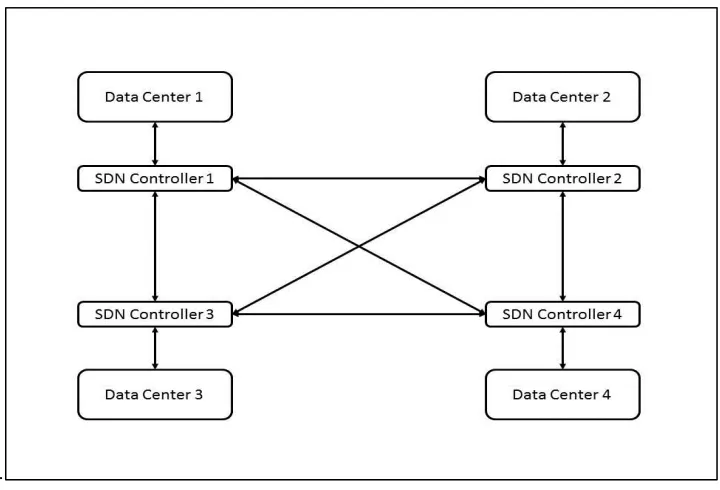
migration takes place. This requires inter SDN controller communication as shown in
Figure 7. However, a migration will not be possible if the target data center does not
have sufficient computing, storage or network resources for hosting the migrating VM.
.
Figure 7: Interconnected SDN controllers of data centers
3.5 The Replication Module
The Replication module is responsible for creating a replica of the candidate VM in a
corresponding target data centers for replication. For each candidate VM, the replication
module invokes a replication request to the resource managers of the target data centers
The resource managers of the target data center checks the resource availability of the
data center to determine whether it can host a copy of the candidate VM. If the target data
center acknowledges that it has sufficient resources, and thus can accommodate a replica
of the candidate VM, the replication module of the target data center creates a replica of
the candidate VM. Target data centers update their resource status after each replication
takes place. Like the migration module, the replication module also requires inter SDN
controller communication as prior to the replication taking place, there is a need to know
that whether the target data center has the required resources to host a copy of the
candidate VM. A replication is not be possible if the target data center does not have
sufficient computing, storage or network resources for hosting a replica of the candidate
Chapter 4
4
Proposed Algorithms
This chapter presents two algorithms for selecting VMs to migrate and target data centers
and one algorithm for replicating a VM. All three algorithms are executed periodically.
Sections 4.1 and 4.2 describe the migration algorithms, Section 4.3 describes the
replication algorithm and Section 4.4 discusses and summarizes the proposed algorithms.
4.1 Selector Algorithm 1 for Migration
This algorithm considers a VM to be a candidate VM if there is a prediction that moving
the VM to another data center would improve the client experience by moving the VM to
data center in a region that is considered, on average, closer to its clients.
This algorithm takes as input the set of virtual machines and set of flows F, that occurs
during a time period. The set of flows associated with virtual machine, vi, is denoted by fi
and fij represents a single flow in fi. The output, MC, is a set of pairs, where each pair is a
virtual machine to be migrated and the data center that the virtual machine is to be
migrated to. The function load returns the load of the input flow. The function region
can either take as input a flow or a VM. For a flow, the function returns the region of the
flow’s origin and for a VM it returns the region of the data center that the VM is located
in. The function distance calculates the distance between two regions.
The algorithm calculates for each virtual machine the average load-distance, which is
denoted by d0. The for loop starting at line 7 sums the weighted load distance of flows to
virtual machine, vi. This allows for the calculation of the average load distance in line 13.
The variables, C and L, represent counter and load lists where C[j] represents the number
of flows that originate in region j, and L[j] represents the load generated by the requests
originating in region j. These counters are initialized in Lines 3 through 5. For each
virtual machine lines 7 through 12 determines the number of requests for each region and
Selector Algorithm 1 Input: F,V
Output: MC
1. for each vi in V
2. d
0 0
3. for j 0,N-1 do 4. C[j], L[j] 0 5. end for
6. r
vmregion(vi)
7. for each flow fij of fi
8. r
flowregion(fij)
9. d
0 d0 + distance(rflow,rvm)*load(fij )
10. C[r
flow] C[rflow]+l
11. L[r
flow] L[rflow]+load(fij )
12. end for 13. d
0 d0 /| fi |
14. t = i j C[j]L[j] C[i]L[i], 0 ≤i,j≤ N-1 15. d
1 0
16. for each flow fij of fi 17. r region(f
ij)
18. d
1 d1 + distance(r, t)*load(fij )
19. end for 20. d
1 d1 /| fi |
21. if d0 > d1
22. MC MC {(v
i, t)}
23. end if 24. end for
Algorithm 1: Selector Algorithm 1
The product of the flow counter and load counter reflects the traffic originating from a
region. Higher values suggest many packets are flowing from the region. This is used to
select the data center of the region with the maximum value of the product as a possible
target data center for migration (Line 14). This in itself is not sufficient for selecting a
target data center since a high value could be the result of many flows or perhaps few
flows with heavy load. Essentially this represents load from a region, but does not
consider distance. The potential target data center selected in Line 14 requires a
calculation (Lines 15 to 19) of the average load distance of the flows of the time period,
ti, that assumes that the VM being considered for migration is in the data center selected
in Line 14. This uses the flow information gathered in the time period. If the average
load-distance using the data center selected in Line 14 is less than the current data center
then the data center in Line 14 is chosen to migrate the VM to (Lines 21 to 23).
4.2 Selector Algorithm 2 for Migration
The algorithm described in Section 4.1 considers only one data center while the algorithm
described in this section considers all data centers. The inputs and output are the same as
that for Selection Algorithm 1. Lines 1 to 8 of Selector Algorithm 2 calculate the
average load distance for a virtual machine. The calculation is similar to that of Selection
Algorithm 1. Lines 10 to 22 of Selector Algorithm 2 is similar to Lines 16 to 20 of
Selector Algorithm 1 except that the calculation is done for each data center and the data
Selector Algorithm 2 Input: F,V
Output: MC
1. for each vi in V 2. d
0 0
3. r
vmregion(vi)
4. for each flow fij of fi 5. r
flowregion(fij)
6. d
0 d0 + distance(rflow,rvm)*load(fij )
7. end for 8. d
0 d0 /| fi |
9. t = rvm 10. d
1 0
11. for each DCk in DC 12. d
m d0
13. for each flow fij of fi 14. r
flowregion(fij)
15. d
m dm + distance(rflow,k)*load(fij )
16. end for 17. d
m dm /| fi |
18. if (dm < d1) 19. d
1 dm
20. t k 21. end if 22. end for 23. if d0 > d1
24. MC MC {(v
i, t)}
25. end if 26. end for
Algorithm 2: Selector Algorithm 2
4.3 Selector Algorithm for VM Replication
The Selector Algorithm for VM Replication is similar to the algorithm described in
Section 4.1 that identifies a target data center. However, rather than predicting the
load-distance if a VM is migrated, it predicts the load-load-distance if a copy of the VM is
replicated in a target data center. To calculate the predicted load-distance, it assumes that
a flow will be served by the VM which is geographically closest to the origin of the flow.
This algorithm also calculates the predicted load ratio for each VM which specifies the
executed along with the migration algorithm when the owner of the VM agrees to rent
extra VM.
Lines 1 to 15 of Selector Algorithm for VM Replication calculate the average load
distance of a virtual machine and identify a target data center. This is similar to Selector
Algorithm 1. The calculation of the predicted load distance is different from Selector
Algorithm 1 in Selector Algorithm for VM replication, as the flows are expected to be
distributed among the original and the replicated copy of the VM. The predicted
load-distance is calculated assuming that, after a replica of the VM is hosted in the target data
center, client requests will be served by the VM which is geographically the closest to the
client (Assuming that the DNS will return the IP address of the closest VM [49]).
In lines 16-18, variables lc, lt, load_ratio are initialized to 0. These variables represent the
predicted load in the original VM, the predicted load in the replicated VM and the load
ratio obtained from dividing lc by lt respectively. Lines 19 to 29 calculate the average
load distance of the flows that assumes that the VM will be replicated in the potential
target data center selected in Line 14 of the flows received in the time period, ti. The
distance of the flow’s origin to the original data center and flow’s origin to the target data
centers are compared. The smaller distance is weighted by the flow load and added to d1.
This approach means that the calculated average load distance is based on flows being
sent to the nearest data center. The expected load for the potential target data center and
Selector Algorithm for VM Replication
Input: F,V
Output: MC
1. for each vi in V 2. d
0 0
3. for j 0,N-1 do 4. C[j], L[j] 0 5. end for
6. r
vmregion(vi)
7. for each flow fij of fi 8. r
flowregion(fij)
9. d
0 d0 + distance(rflow,rvm)*load(fij )
10. C[rflow] C[rflow]+l 11. L[r
flow] L[rflow]+load(fij )
12. end for 13. d
0 d0 /| fi |
14. t = i j C[j]L[j] C[i]L[i], 0 ≤i,j≤ N-1 15. d
1 0
16. l
c 0
17. l
t 0
18. load_ratio 0
19. for each flow fij of the fi 20. r
flowregion(fij)
21. if (distance(rflow,rvm)> distance(rflow, t)) 22. d
1 d1 + distance(rflow,t)*load(fij )
23. l
tlt+ load(fij )
24. else 25. d
1 d1 + distance(rflow,rvm)*load(fij )
26. lclc+ load(fij ) 27. end if
28. end for 29. d
1 d1 /| fi |
30. load_ratio= lc / lt 31. if d0 > d1
32. MC MC {(v
i, t)}
33. end if 34. end for
Algorithm 3: Selector Algorithm for VM Replication
A VM replication in the target data center can reduce the load-distance for its flows
(hence reduces data access and transfer time for its clients) along with serving the
primary goals of VM replication such as increasing reliability, preventing single point of
failure and distribution of load. Moreover, an SDN controller can forward the flows to the
Line 30 calculates load ratio as lc/lt. The load ratio provides an idea of how the load is
expected to be distributed between the VMs if shortest path routing is applied (We
assume that the geographically closest VM has the shortest path from the origin of the
flow). From the load ratio, the cloud provider can determine the processing capacity and
resource requirement of the replica VM. Lines 31 to 34 are the same as lines 21 to 24 of
Selector Algorithm 1. A cloud resource manager can use the load-ratio to adjust resources
allocated to the primary VM and its replica. The predicted load ratio could result in a
decision results in a migration and VM replication. If the predicted load-ratio suggest that
most of the requests will be served by either of the VM rather than a uniform distribution,
only migration can be beneficial rather than using two VMs. However, if the VM is
stressed with overload and a single VM is not sufficient to serve its clients, a replication
along with a migration can be triggered to the target data center when the distribution of
load is not uniform. When more than one VM is hosted by a single data center, the load
can be distributed between the VMs by the method described in [16].
4.4 Summary
This Chapter presented two possible migration algorithms and a possible replication
algorithm. The use of the migration and replication algorithms depends on various
factors e.g., the willingness of the owner to pay for additional VMs, expected distribution
of the load between the primary VM and its replica etc. For example, a migration
algorithm may only be used if the owner is not willing to pay for an additional VM.
Although not a primary focus of the thesis it is possible to apply both migration and
replication algorithms that could result in a replica and a migration when the predicted
Chapter 5
5
Experimental Design and Results
This chapter describes the performance of the algorithms proposed in chapter 4. Section
5.1 describes the simulator environment, section 5.2 describes the simulation parameters
and scenarios, section 5.3 describes simulation metrics for evaluation, section 5.4
describes the experimental results of VM migration algorithms (Selector Algorithm 1 and
Selector Algorithm 2) and section 5.5 describes the experimental results of the VM
replication algorithm (Selector Algorithm for Replication).
5.1 Simulation Environment
A simulation tool was developed using the Java programming language on Netbeans
IDE. The simulation tool has the output described for Selector Algorithms 1 and 2 and
Selector Algorithm for Replication. A geographic area is represented using a grid. The
grid space is divided into regions based on the position of the data centers based on
Voronoi diagrams [27]. With a Voronoi diagram, if N seed points are given, the given
space is divided into N regions corresponding to the seed points in such a way that all
points in a region is closest to the seed point of its own region. We used the location of
the data centers as seed points to divide the grid space into regions.
Flows can be randomly generated by randomly generating the origin, load, data center
and VM. The distance of a flow to a data center is calculated using the Euclidian distance
of the origin of the flow from the data center. The simulation tool randomly selects load
based on a range from .1 to 1 for each flow, where 1 represents the maximum possible
load of a flow and .1 represents the minimum possible load of a flow.
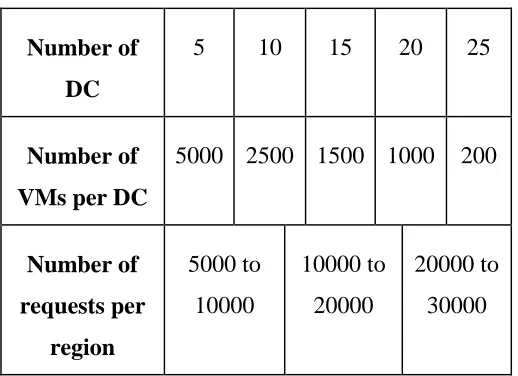
5.2 Simulation Parameters and Scenarios
The simulation parameters include the number of data centers, the number of VMs to be
hosted in a data center, and the range of the number of flows for each region. The
number of flows is randomly generated but the number is within the range. The values
grid are 2000x2000. Space considerations do not allow us present all the results in this
chapter but results not in this chapter are in the appendices. The results presented in this
chapter are representative.
Number of
DC
5 10 15 20 25
Number of
VMs per DC
5000 2500 1500 1000 200
Number of requests per region 5000 to 10000 10000 to 20000 20000 to 30000
Table 1: Simulation Parameters
Several scenarios were considered: (1) Scenario 1 assumes that all requests are randomly
generated; (2) Scenario 2 assumes all flows come from a single region; (3) Scenario 3
divides the grid into four equal quadrants with all flows from the upper left quadrant; (4)
Scenario 4 assumes that 50% of the total flows are from the upper left quadrant of the
grid and rest of the flows are randomly generated from the entire grid space.
5.3 Metrics for Evaluation
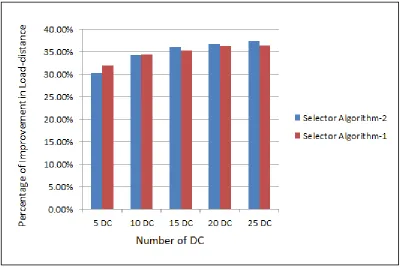
We used three metrics for evaluation for our experiments as described below.
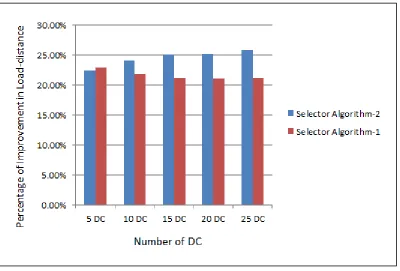
Percentage of Expected Improvement:For each VM in a data center, the percentage of
expected improvement is defined as: ((d0-d1) /d0)*100%. This metric provides a measure
of how much of the current load-distance will be reduced if the VM is migrated to the
target data center.
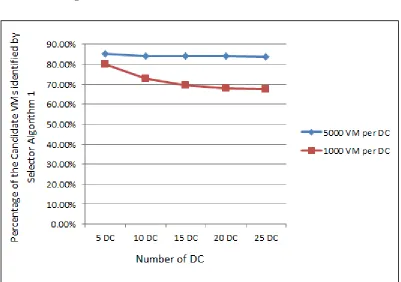
Percentage of candidate VMs identified:Selector Algorithm 2 is designed to search all
data centers (region) to find the data center that is expected to best improve load-distance.
![Figure 1: A three-tier data center network [30]](https://thumb-us.123doks.com/thumbv2/123dok_us/7766752.1277205/18.612.108.545.166.310/figure-tier-data-center-network.webp)
![Figure 2: Fat tree based data center network [30]](https://thumb-us.123doks.com/thumbv2/123dok_us/7766752.1277205/19.612.136.589.318.640/figure-fat-tree-based-data-center-network.webp)
![Figure 5: SDN Architecture [34]](https://thumb-us.123doks.com/thumbv2/123dok_us/7766752.1277205/23.612.110.541.72.326/figure-sdn-architecture.webp)