DEVELOPMENT OF SHORT TERM VALIDATION TEST
FOR THERMO-FORMED NYLON TUBES
Elvira Saenz¹, Jorge Pedrozo²
Jaime Sanchez³
¹ ² ³ Instituto Tecnológico DE CD. Juárez, Chihuahua (México)
ABSTRACT
There are few or none investigations on short-term validation test to verify whether a thermoforming process of
nylon tubes is robust or not. Analysis of variance allows us to identify significant factors in the validation of
thermoforming process to establish or develop a short term validation test. Parametric study t-student analysis
was used to compare a long term testing established within the automotive industry in thermoformed plastic
with a proposal short term test to be used on a production environment. These experiments guide us to
understand that the temperature and time factors are not significant on a validation test for Nylon 6
thermoforming process when working in a lower range of yield temperature, and the testing period can be
reduced significantly.
Keywords: Analysis of variance, parametric study t-student, Thermoforming process, Validation
Test.
I. INTRODUCTION
During the last decades the application of plastic components in the automotive industry has been increasing. Following this evolution, specifically talking about thermo-forming nylon tubes, the designs have become very complex geometries, and this requires having more robust manufacturing processes to ensure that the tubes will maintain their shape under operating and different environmental conditions; as a result the product validation tests become an indispensable tool to ensure the quality of the parts. Unfortunately the testing for nylon parts has not been improving according with this evolution, the automotive industries have only long –term validation tests that are not optimal for use in a production environment, this situation led us to the need of developing short-term tests that are equivalent to those already defined and validated by the automotive customers. Some polymers or plastics such as Nylon 6 have a property called shape memory, this feature is the ability of the material to remember its original shape when is affected by external stimulus that alter some of its properties [1], as long as these do not reach the temperature of formation (yield temperature) the plastic will maintain the form [2], this feature of the material will provide the basics for the definition of the parameters on the proposed testing.
1.1 Thermoforming process
tubes of the desired diameter configuration. The next process is the thermoforming of tubes, also known as bending process, in which the tube is routed into a mold that will give the required form, the first step is the heating cycle is carried out by injecting compressed hot air at high temperature (700⁰F) and at a considerable speed [1], so that the necessary heat energy is transferred to modify the modulus of elasticity and hardness of the plastic tube and reach the yield temperature [2], after reaching this temperature the material tends to become a rubberized state. Once the yield temperature is reached to form the tube, hot air injection is stopped and stability cycle starts. Follow by a coolant period using injection of air at room temperature, until gets the original rigidity and retain the shape and geometry set by the mold. The yield temperature, determined that it became the most critical parameter during the process of thermoforming, when this temperature is not achieved the tube will not be able to overcome the memory of the material and will tend to recover its original shape over time, this feature of the material is called relaxation. There are several internal and external factors that could affect the thermoforming process to not reach the yield temperature, some of them can be controlled and some not, due to the nature of this process the implementation of a verification test becomes an important part to ensure the tube has been bent correctly and will maintain the form under any environmental condition or temperature changes. When the tube does not maintain its geometry or specific form and presents relaxation, it could cause installation problems to the end customer. The present work has as its central theme the definition of a short test for thermo-formed nylon tubes adapted to a production environment.
1.2 Long Term Validation Test
Long term formed bend tube- relaxation test procedure consist in expose the tube to a hot air soak of 105°C - 110°C for one hour minimum. Measure bend angle within 5 minutes of removal from the hot air exposure. Requirements of acceptability: the angle of the bend when measured in Free State must not exceed the tolerance specified before or after heat soak. Normal tolerance specified +/- 10 grades of relaxation [5]
This is the specification test required by some automotive customers and will be used as a base line to develop an equivalent testing reducing the testing time.
II. MATERIAL AND EXPERIMENTAL METHODS
2.1 Materials
GCA Precision Mechanical Convection Oven will be used to perform the long term Validation test. And metal angle meter will be used to measure the tube angles. The relaxation angle will be calculated measuring the tube angle before testing with metal angle meter and subtracting the value of the measurement of the same tube angle after testing. Two different geometric tubes were used to perform several experiments detailed below.
2.2 Experimental Methods
was used the Student t-test for testing a hypothesis on the basis of an equal sample mean between two populations for the long term test and suggested hydro test as an optional short testing method.
III. RESULTS
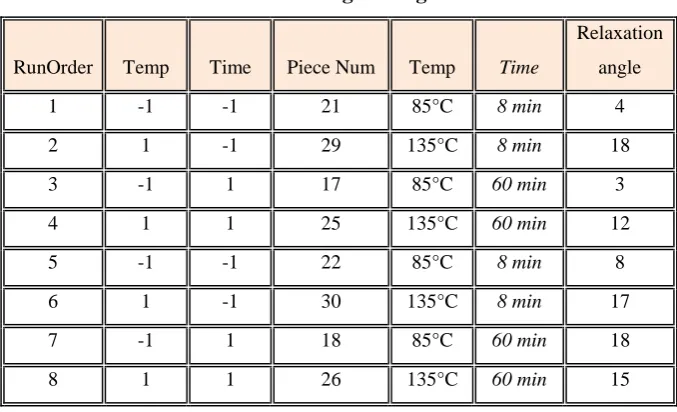
Table (1) shows the Factorial Design 2² used on tube A (complex geometry Tube A) to determine if the factors temperatures and time have significant effect on the variable response relaxation angle using the long term validation test. To perform the experiment it was confirmed that the data values of relaxation angle follow a normal distribution; the decision rule for normality is P-value greater than 0.05 with a confidence level of 95%. In this case the P-value was 0.229, so we conclude that the data was normal an ANOVA assessment was determined feasible.
Table 1. Factorial Design- Long Test Tube A
RunOrder Temp Time Piece Num Temp Time
Relaxation angle 1 -1 -1 21 85°C 8 min 4 2 1 -1 29 135°C 8 min 18 3 -1 1 17 85°C 60 min 3 4 1 1 25 135°C 60 min 12 5 -1 -1 22 85°C 8 min 8 6 1 -1 30 135°C 8 min 17 7 -1 1 18 85°C 60 min 18 8 1 1 26 135°C 60 min 15
Table 2: Results of Factorial Design – Long Test Tube A
Estimated Effects and Coefficients for Relaxation Angle
Term Effect Coef SE Coef T P
Constant 11.875 1.98 6.00 0.004
Temp 7.250 3.625 1.98 1.830 0.141 Time 0.250 0.125 1.98 0.060 0.953
Temp*Time -4.250 -2.125 1.98 -1.070 0.344 S =5.60134 PRESS = 502
R-Sq = 52.97% R-Sq (pred) = 0.00% R-Sq (adj) = 17.70%
Analysis of Variance for ANG RELAJ (coded units) Last Squares Means
Source DF Seq SS Adj SS Adj MS F P TEMP Mean SE Mean
Main Effects 2 105.250 105.250 52.625 1.68 0.296 -1 8.250 2.801
Temp 1 105.125 105.125 105.125 3.350 0.141 1 15.500 2.801 Time 1 0.125 0.125 0.125 0.000 0.953 TIME
2-Way Interactions1 36.125 36.125 36.125 1.150 0.344 -1 11.750 2.801
Temp*Time 1 36.125 36.125 36.125 1.150 0.344 1 12.000 2.801 Residual Error 4 125.500 125.500 31.375
Pure Error 4 125.500 125.500 31.375 Total 7 266.875
Figure 1: Shows the main effects and Surface plot: Temperature and time factors long test Tube A
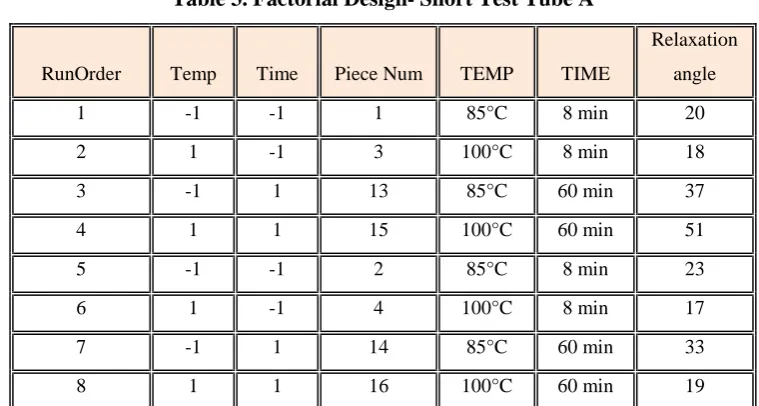
Table 3. Factorial Design- Short Test Tube A
RunOrder Temp Time Piece Num TEMP TIME
Relaxation angle 1 -1 -1 1 85°C 8 min 20 2 1 -1 3 100°C 8 min 18 3 -1 1 13 85°C 60 min 37 4 1 1 15 100°C 60 min 51 5 -1 -1 2 85°C 8 min 23 6 1 -1 4 100°C 8 min 17 7 -1 1 14 85°C 60 min 33 8 1 1 16 100°C 60 min 19
Analyzing the results of full factorial experiment, it is determined that the levels identified for both time factor and temperature factor were not significant (P value>0.05). It was concluded that both experiments with long and short test for the factor level selected the temperature and time were not significant to the variable response for tube A,
Estimated Effects and Coefficients for Relaxation Angle
Term Effect Coef SE Coef T P Constant 27.250 4.05 6.73 0.003
Temp -2.000 -1.000 4.05 -0.025 0.817 Time 15.500 7.750 4.05 1.910 0.128 Temp*Time 2.000 1.000 4.05 0.250 0.817 S =11.4564 PRESS = 2100
R-Sq = 48.60% R-Sq (pred) = 0.00% R-Sq (adj) = 10.06%
Analysis of Variance for ANG RELAJ (coded units) Last Squares Means
Source DF Seq SS Adj SS Adj MS F P TEMP Mean SE Mean Main Effects 2 488.500 488.500 244.250 1.86 0.268 -1 28.250 5.728
Temp 1 8.000 8.000 8.000 0.060 0.817 1 26.250 5.728 Time 1 480.500 480.500 480.500 3.660 0.128 TIME
2-Way Interactions1 8.000 8.000 8.000 0.060 0.817 -1 19.500 5.728 Temp*Time 1 8.000 8.000 8.000 0.060 0.817 1 35.000 5.728 Residual Error 4 525.000 525.000 131.250
Figure 2: Shows the main effects and Surface plot: Temperature and time factors
One of the main issues observed during these two experiments was that the relaxation angle data shows that the tube exceed the acceptance criteria defined on the long term test, therefore the bending process was not adjusted properly. The tube A used on these experiments it is a tube made of nylon 6 with a complex geometric and a length over 600 mm, it was considered necessary to perform both experiments to a different tube with simple complexity in order to compare results.
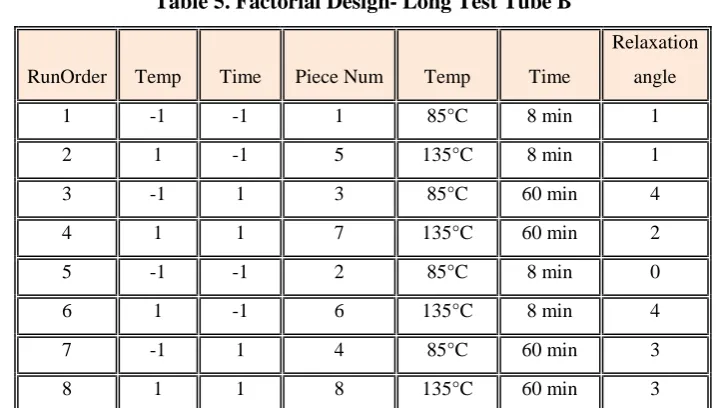
Same process was performed to a second tube B, nylon 6 with one simple bend of 90° angle, the Table (5) shows the Factorial Design 2² used to evaluate the same factors temperatures and time and see if they have significant effect on the variable response relaxation angle using first the long term validation test. To perform the experiment it was confirmed that the data values of relaxation angle follow a normal distribution; In this case the P-value was 0.466, so we conclude that the data was normal an ANOVA assessment was determined feasible.
Table 5. Factorial Design- Long Test Tube B
RunOrder Temp Time Piece Num Temp Time
Relaxation angle 1 -1 -1 1 85°C 8 min 1 2 1 -1 5 135°C 8 min 1 3 -1 1 3 85°C 60 min 4 4 1 1 7 135°C 60 min 2 5 -1 -1 2 85°C 8 min 0 6 1 -1 6 135°C 8 min 4 7 -1 1 4 85°C 60 min 3 8 1 1 8 135°C 60 min 3
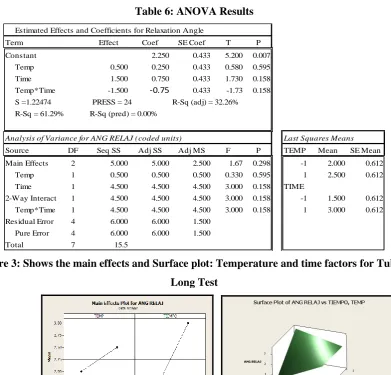
Table 6: ANOVA Results
Estimated Effects and Coefficients for Relaxation Angle
Term Effect Coef SE Coef T P
Constant 2.250 0.433 5.200 0.007
Temp 0.500 0.250 0.433 0.580 0.595
Time 1.500 0.750 0.433 1.730 0.158
Temp*Time -1.500 -0.75 0.433 -1.73 0.158
S =1.22474 PRESS = 24 R-Sq (adj) = 32.26%
R-Sq = 61.29% R-Sq (pred) = 0.00%
Analysis of Variance for ANG RELAJ (coded units) Last Squares Means
Source DF Seq SS Adj SS Adj MS F P TEMP Mean SE Mean
Main Effects 2 5.000 5.000 2.500 1.67 0.298 -1 2.000 0.612
Temp 1 0.500 0.500 0.500 0.330 0.595 1 2.500 0.612
Time 1 4.500 4.500 4.500 3.000 0.158 TIME
2-Way Interactions1 4.500 4.500 4.500 3.000 0.158 -1 1.500 0.612
Temp*Time 1 4.500 4.500 4.500 3.000 0.158 1 3.000 0.612
Residual Error 4 6.000 6.000 1.500
Pure Error 4 6.000 6.000 1.500
Total 7 15.5
Figure 3: Shows the main effects and Surface plot: Temperature and time factors for Tube B
Long Test
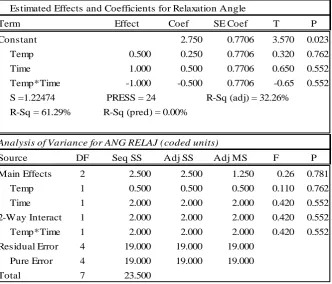
The Table (6) shows the last Factorial Design 2² performed on tube B to determine if the factors temperatures and time have significant effect on the variable response relaxation angle using the short term validation test (proposed Hydro test as an alternative to the long test). To perform the experiment it was confirmed that the data values of relaxation angle follow a normal distribution, the decision rule for normality is P-value greater than 0.05 with a confidence level of 95%, and then the data was normal. In this case the P-value was 0.683, so we conclude that the data was normal an ANOVA assessment was determined feasible. Analyzing the results of full factorial experiment, it was determined that at the levels identified for both time and temperature factors were not significant (P value>0.05) as well for Tube B running with the short test.
Table 6. Factorial Design- Long Test Tube B
RunOrder Temp Time
Piece
Num Temp Time
Relaxation Angle 1 -1 -1 1 85°C 8 min 3 2 1 -1 3 100°C 8 min 1 3 -1 1 13 85°C 60 min 2 4 1 1 15 100°C 60 min 2 5 -1 -1 2 85°C 8 min 0 6 1 -1 4 100°C 8 min 5 7 -1 1 14 85°C 60 min 5 8 1 1 16 100°C 60 min 4
Table 7: ANOVA Results
Estimated Effects and Coefficients for Relaxation Angle
Term Effect Coef SE Coef T P Constant 2.750 0.7706 3.570 0.023
Temp 0.500 0.250 0.7706 0.320 0.762 Time 1.000 0.500 0.7706 0.650 0.552 Temp*Time -1.000 -0.500 0.7706 -0.65 0.552 S =1.22474 PRESS = 24 R-Sq (adj) = 32.26%
R-Sq = 61.29% R-Sq (pred) = 0.00%
Analysis of Variance for ANG RELAJ (coded units)
Source DF Seq SS Adj SS Adj MS F P Main Effects 2 2.500 2.500 1.250 0.26 0.781
Temp 1 0.500 0.500 0.500 0.110 0.762 Time 1 2.000 2.000 2.000 0.420 0.552 2-Way Interactions1 2.000 2.000 2.000 0.420 0.552 Temp*Time 1 2.000 2.000 2.000 0.420 0.552 Residual Error 4 19.000 19.000 19.000
Figure 4: Shows the main effects and Surface plot: Temperature and time factors for Tube B
Short Test
In order to finalize the development of the short term test validation, we need to probe that the relaxation angle under the long term validation test has similar or equal results than the proposed short test. To develop this experiment it was decided to use the Tube B due to the bending process was considered stable to produce good parts. 60 samples were taken to run the long term validation test and the short test with a significant sample size of 30 samples used on each test to determine if both of them have same effect on the relaxation angle.
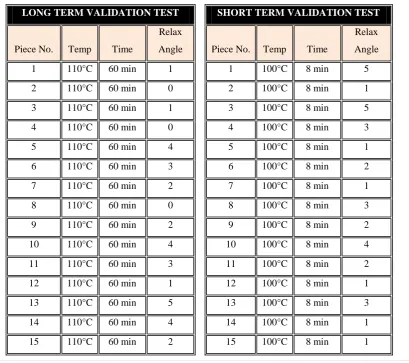
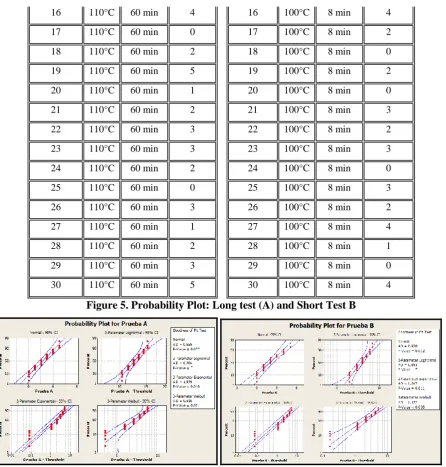
See Table (8) below with the relaxation angle data results for both tests. Applying a parametric test requires normality of the observations for each of the groups. So the data was analyzed using Minitab. The following Fig. 5 show the test results and both of them are normal due to P-value>0.05.
Table 8. Relaxation angle applying Long and Short term validation test to tube B
LONG TERM VALIDATION TEST SHORT TERM VALIDATION TEST
Piece No. Temp Time
Relax
Angle Piece No. Temp Time
16 110°C 60 min 4 16 100°C 8 min 4 17 110°C 60 min 0 17 100°C 8 min 2 18 110°C 60 min 2 18 100°C 8 min 0 19 110°C 60 min 5 19 100°C 8 min 2 20 110°C 60 min 1 20 100°C 8 min 0 21 110°C 60 min 2 21 100°C 8 min 3 22 110°C 60 min 3 22 100°C 8 min 2 23 110°C 60 min 3 23 100°C 8 min 3 24 110°C 60 min 2 24 100°C 8 min 0 25 110°C 60 min 0 25 100°C 8 min 3 26 110°C 60 min 3 26 100°C 8 min 2 27 110°C 60 min 1 27 100°C 8 min 4 28 110°C 60 min 2 28 100°C 8 min 1 29 110°C 60 min 3 29 100°C 8 min 0 30 110°C 60 min 5 30 100°C 8 min 4
Figure 5. Probability Plot: Long test (A) and Short Test B
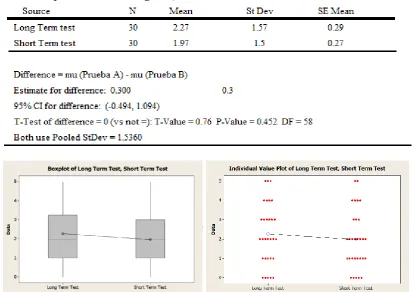
Table 9: Two-Sample T-Test and CI: Long and Short Test
Based on the P-Value that it is greater than 0.05, we can conclude that there is evidence that there is no difference in mean Relaxation angle using Long term and short term Validation Test, therefore the test method of tubes Immersed in water at high temperature with a defined time of 8 minutes have equal results to the long test defined by the automotive customer using 60 minutes to a temperature of 110 ° C.
IV. CONCLUSION
The main conclusions are based on the analysis of all experiments results. We can have two important results summarized as follows:
The temperature and time are two critical factors in the processes of thermo-formed plastic, but these are not significant factors for the development of a verification test for thermoforming process, when working in a lower range to yield temperature point.
It is further concluded that the test method immersed product in water at a temperature of 100 ° C with a time of 8 minutes has the same results as the test method defined by customers at a temperature of 110 ° C and a time of 60 minutes.
REFERENCES
[1] Solidos, U. E. (2007/2008). Polimeros con Memoria de Forma.
[3] Montgomery, D. (2002) Design and Analysis of Experiments.
[4] Harper, C. A. (1999). Modern Plastics Handbook. USA: McGraw-Hill Co.
[5] Diener, K (1982) ES-E37E-9e498-AA Enginering Specification: Specification connection Assy-Emission Vacuum Control.
[6] Brown, R. (1999). Handbook of Polymer Testing: Physical Methods. CRC.