An Evaluation of Information Technology of Gene
Expression Profiles Processing Stability for Different
Levels of Noise Component
Sergii Babichev1∗
1 Department of Informatics, Jan Evangelista Purkyne University in Usti nad Labem, Czech Republic;
* Correspondence: [email protected]; Tel.: +420-777-843-785
Abstract: The paper presents the results of the research concerning an evaluation of information technology of gene expression profiles processing stability with the use of gene expression profiles with different levels of noise component. The information technology is presented as a structural block-chart, which contains all stages of the studied data processing. The hybrid model of objective clustering based on SOTA algorithm and the technology of gene regulatory networks reconstruction have been studied to evaluate the stability to the level of the noise component. The results of the simulation have shown that the hybrid model of objective clustering has high level of stability to noise component and vice versa, the technology of gene regulatory networks reconstruction is very sensitivity to level of noise component. The obtained results indicate the importance of gene expression profiles preprocessing at early stage of gene regulatory network reconstruction in order to remove background noise and non-informative genes in terms of used criteria.
Keywords:objective clustering, biclustering, gene regulatory networks, reconstruction, validation, gene expression profiles, noise component, systems stability.
1. Introduction
Relevance of the problem is determined by the current works in the field of gene expression profiles processing for purpose of gene regulatory networks reconstruction. Gene regulatory network is a set of genes, which interact with each other and with other elements in the cells to control the specific cells functions [1–3]. Qualitatively reconstructed gene regulatory network promotes to better understanding of the genes interaction mechanism in order to develop new methods to early diagnostics and treatment of complex diseases and for making new effective medicines. The gene expression profiles, which are obtained by DNA microarray experiments [4,5] or by RNA-molecules sequencing technology [6,7] are the basis for gene regulatory networks reconstruction. High dimension of feature space in all cases and existence of complex noise component in the case of DNA-microarray technology use are the distinctive peculiarities of the studied data. The reconstruction of gene networks based on the whole dataset of gene expression profiles is very complicated task due to the following aspects: it requests large computer resources; complexity of the obtained networks complicates the obtained results interpretation. Therefore, it is necessary at the early stage of gene regulatory network reconstruction to process the gene expression profiles with the use of current computational and information technologies of complex data processing. This process includes data filtering in the case of DNA-microchip experiment performing, non-informative genes in terms of the used criteria reducing, data clustering and biclustering in order to allocate mutually correlated genes and samples.
In [8,9] authors present the results of the research concerning the use of wavelet filter for noise data processing. The authors have shown the advantages of this technology to compare with the fast Fourier transform in the case of remove the noise component from the studied data. Bicluster analysis is relevant to allocate the mutually correlated genes and samples nowadays [10–13]. However, it should
be noted that the main disadvantages of this technology direct implementation are the large quantity of small biclusters and large amount of useful information loss at the stage of biclusters formation. In [14] authors proposed the information technology of step by step gene expression profiles processing in order to reconstruct gene regulatory networks. Practical implementation of this technology involves gene expression profiles clustering with the use of DBSCAN clustering algorithm [15] at the first step and SOTA clustering algorithm [16,17] at the second step. Further, biclustering process should be implemented on the obtained clusters. Based on the authors’ research, the implementation of this technology allows us to save more useful information due to paralleling of the studied data processing. The objective clustering inductive technology was proposed in [18–20] to determine the optimal parameters of the appropriate clustering algorithm. The results of the research concerning evaluation of the stability of the objective clustering inductive technology based on k-means clustering algorithm with the use of data containing different levels of noise component were presented in [21]. However, k-means clustering algorithm is not effective for gene expression profiles clustering. The issues concerning creation of the method of fuzzy clustering task for multi-variate short time series with unevenly distributed observations were investigated in [22]. Proposed method allows authors to process the time series in both the batch mode and sequential on-line mode. However, it should be noted that authors’ researches are primarily focused on low-dimensional data processing. High-dimensional data processing are not considered in these works. Thus, it should be noted that in spite of the achieved successful results in this subject area the evaluation of the stability of the technology of gene expression profiles processing for different levels of noise component has not been sufficiently investigated to the present time.
The aim of the paper is an evaluation of the stability of both the hybrid model of objective clustering based on self-organizing SOTA clustering algorithm and the technology of the gene regulatory networks reconstruction based on the obtained biclusters to the level of the noise component in the case of the gene expression profiles use.
2. Materials and Methods
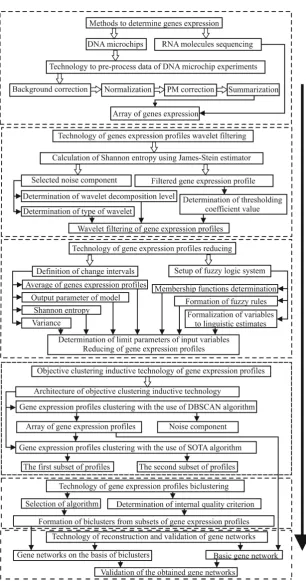
The structural block-chart of the information technology of gene expression profiles processing for purpose of the gene regulatory networks reconstruction and validation of the obtained models is presented in Figure 1 [14]. The implementation of this technology involves the following stages:
Stage I.Formation of gene expression profiles array in the case of DNA microchip experiments
Figure 1.Structure flow chart of the information technology of the gene expression profiles processing for purpose of gene regulatory network reconstruction.
Stage II.Wavelet filtering of the gene expression profiles
within the framework of the proposed information technology, involves determination of the wavelet filter optimal parameters on the basis of concurrent evaluation of Shannon entropy for both the filtered data and allocated noise component. The type of mother wavelet, type of wavelet from the family of appropriate mother wavelet and level of wavelet decomposition are determined based on the maximum value of Shannon entropy for the allocated noise component and optimal value of thresholding coefficient is determined on the basis of the minimum value of Shannon entropy for the filtered data. The algorithm works in such a way that if the value of Shannon entropy for the filtered data increases at the first step of thresholding coefficient change, the filtering process is stopped. In this case the studied data do not need any filtering.
Stage III.Gene expression profiles reducing
The aim of this stage is the division of the studied gene expression profiles into informative and non-informative in terms of complex use of statistical criteria and Shannon entropy. It is assumed that if the variance and average of absolute value of gene expression profiles are less and value of Shannon entropy is greater than the corresponding boundary values, then these profiles are removed from the studied data as non-informative without significant loss of useful information. The fuzzy logic system was used to determine the boundary values of the appropriate parameters within the framework of the proposed technology [14]. After determination of the appropriate parameters boundary values a stepwise comparison of the variance, the average of absolute value and Shannon entropy of the gene expression profiles with the boundary values are performed. If the following conditions are true:
var≤varlim;abs≤anslim;entr≥entrlim (1)
then this gene is allocated from the data as non-informative. Otherwise, the gene profile is recognized as informative for the further analysis.
Stage IV.Step-by-step gene expression profiles clustering within the framework of the objective clustering inductive technology
The implementation of the objective clustering inductive technology involves the division of the initial dataset into two equal power subsets (containing the same quantity of pairwise similar objects). Further, the clustering process is carried out on both subsets concurrently and the calculation of the internal and external clustering quality criteria at each step of the algorithm operation is performed. At final step the complex balance criterion is calculated based on the internal and external criteria. The maximum value of the balance criterion corresponds to the optimal parameters of the appropriate clustering algorithm operation. The use of DBSCAN clustering algorithm allows us to allocate the genes, which are identified as noise. These genes are removed from the studied data. At the second step of the clustering process the gene expression profiles are divided into two clusters with the use of SOTA clustering algorithm. These subsets are used for the following bicluster analysis.
Stage V.Bicluster analysis of the obtained subsets of gene expression profiles
value of the internal biclustering quality criterion. Further, the biclustering process is performed with implementation of “ensemble” biclustering method using the optimal parameters of this algorithm.
Stage VI.Gene regulatory networks reconstruction and validation of the obtained models
The reconstruction of gene networks was performed based on the correlation inference algorithm with the use of software Cytoscype [26].The optimal topology of the obtained gene networks was determined on the basis of the maximum value of general Harrington desirability index [27], which contains the topological parameters of networks as the components. Validation of the obtained models was performed based on the comparison analysis of the existence of direct links between the appropriate genes in the basic network and in the networks reconstructed based on the obtained biclusters. The basis of ROC-analysis theory was used to calculate the complex relative validation criterion, which indicates a quality of the obtained gene networks.
2.1. The Evaluation of the Stability of the Objective Clustering Inductive Model to the Level of the Noise Component
The objective clustering inductive model based on the self-organizing SOTA clustering algorithm was studied to evaluate the stability of the model to the level of the noise component. Gene expression profiles of 2000 patients who were examined on lung cancer [28] were used in this case. The length of the studied vectors was equal to the number of the studied samples (96). The simulation process involved the following steps:
1. Generation of random values vector. The length of this vector is equal to the length of the studied gene expression profiles and its amplitude corresponds to the minimum value of the studied data genes expression (“white noise”).
2. Setup of the vector of coefficients to change the amplitude of the noise component. In the case of the studied gene expression profiles the values of coefficients were changed within the range from 0.2 to 4 with step 0.2. These parameters were determined empirically during the simulation process.
3. Formation of gene expression profiles with the noise by adding of the appropriate noise component to studied gene expression profiles.
4. Division of the obtained data into two equal power subsets by the use of algorithm presented in [18].
5. Gene expression profiles clustering correspond to the method described in detail in [18] using SOTA clustering algorithm. The value of the sister cell weigh coefficient (scell) was changed within the small range from 8×10⁻⁴to 11×10−4with the step 2×10⁻⁵. This range was determined empirically during the previously simulation process. The value of the variation coefficient was taken as zero.
6. Calculation of the complex balance criterion (general Harrington desirability index) for each value of the sister cell weigh coefficient. Creation of the plots of complex balance criterion versus the weigh coefficient value for both the data without noise and the data with different levels of noise component. Determination of SOTA clustering algorithm optimal parameters, which correspond to the maximum value of the complex balance criterion. Data clustering with the use of SOTA algorithm with its optimal parameters.
7. Calculation of the external clustering quality criteria, which allows us to compare the clustering results for both the data without noise and data with noise component. The following criteria were used as the external clustering quality criteria in this case:
• Jaccard index:
J= a
• Kulczynski index:
K= a
2×(a+b)+
a
2×(a+c), (3)
whereais the number of objects distributed in the same clusters in different clustering;bis the number of objects in the clusters of the first clustering, which do not coincided with appropriate objects in the clusters of the second clustering;cis the number of objects in the clusters of the second clustering, which do not coincided with appropriate objects in the clusters of the first clustering.
8. Analysis of the obtained results.
2.2. The Evaluation of the Stability of the Model of Gene Regulatory Networks Reconstruction to the Level of the Noise Component
In this case the gene expression profiles from data moe430a [29] from Affymetrix microarray experiment were used during the simulation process. This data contains the gene expression profiles of the mesenchymal cells from two distinct lineages, neural crest and mesoderm derived. 1000 of gene expression profiles from 20 samples were used during the simulation process. Random “white noise” was added to each of the studied gene expression profiles. An amplitude of the noise component was determined by the following:
A=k×(max(v)−min(v)), (4)
wherevis the vector of gene expression, the length of which is equal to the number of the studied samples;kis the coefficient, which limits the amplitude of the noise vector.The value of k coefficient was changed within the range from 0.025 to 0.1 with the step 0.025 during the simulation process. So, four database of gene expression profiles with different level of noise were generated as the result of this process implementation.
Data biclustering was performed with the use of “ensemble” biclustering method according to the method described in details in [24]. Finally, the gene regulatory network reconstruction and validation of the obtained model were carried out. The relative criterion of validation was calculated for the reconstructed networks based on both the data without noise and data with different levels of noise component.
3. Results and Discussion
3.1. Results of the Simulation With the Use of Objective Clustering Inductive Technology Based on SOTA Clustering Algorithm
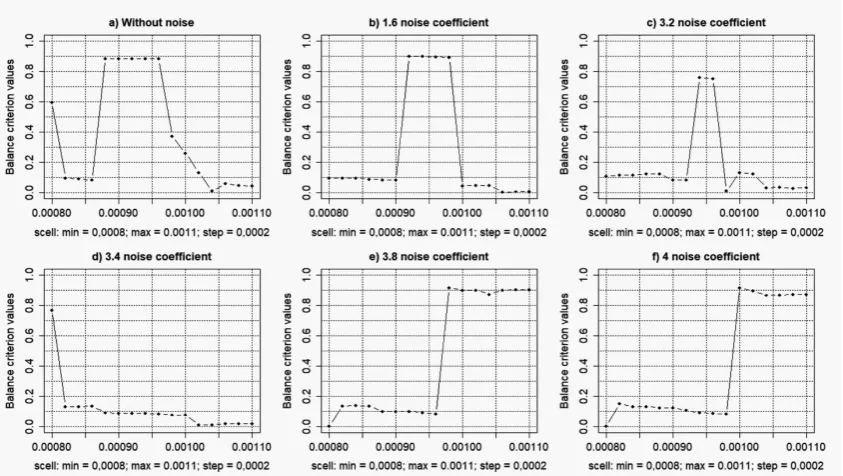
Figure 2 presents the charts of the complex balance criterion versus the sister cell weigh coefficient (scell) of SOTA clustering algorithm, which was implemented within the framework of the objective clustering inductive technology [18–20]. The noised gene expression profiles of the patients who were examined on lung cancer disease were used in this case. The optimal value ofscell, which corresponds to the maximum value of general Harrington desirability index was determined during the simulation process. The results of the simulation have shown that the increase of the amplitude coefficient of the noise component from 0.2 to 3.2 does not significantly influence to the character of the balance criterion change. Figure 3 shows the charts of the number of objects in the clusters, Jaccard and Kulczynski indexes and the relative changes of these indexes in percent versus the amplitude coefficient of the noise component.
Figure 2. Charts of the complex balance criterion versus the sister cell weigh coefficient (scell) for different levels of noise component.
Figure 3.Charts of: a)the quantity of gene expression profiles in different clusters;b)Jaccard and Kulczynski indexes values; c)the relative changes of Jaccard and Kulczynski indexes versus the amplitude coefficient of noise component.
of the appropriate vector. Therefore, thescellvalue in this case is not determinative. The results of the simulation have shown that the clustering results in the case of high level of noise component are almost the same and they do not depend on the scell value.
The conducted research has shown also that the objective clustering inductive technology is effective and efficient in the case of the analysis of the complex data with local particularities. The use of this technology to group the gene expression profiles is reasonable in the case of low level of the noise component.
3.2. Results of the Simulations Concerning the Influence of the Level of Noise Component to the Quality of the Reconstructed Gene Networks
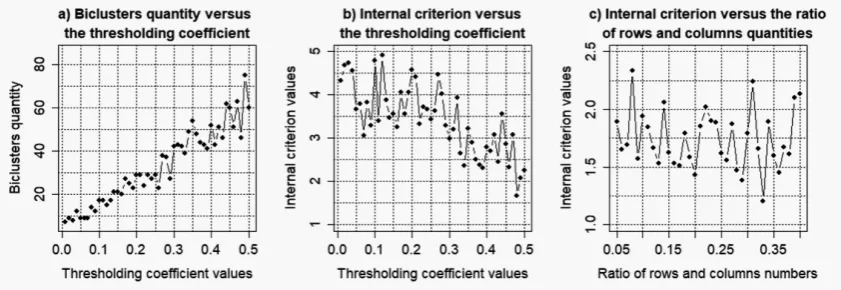
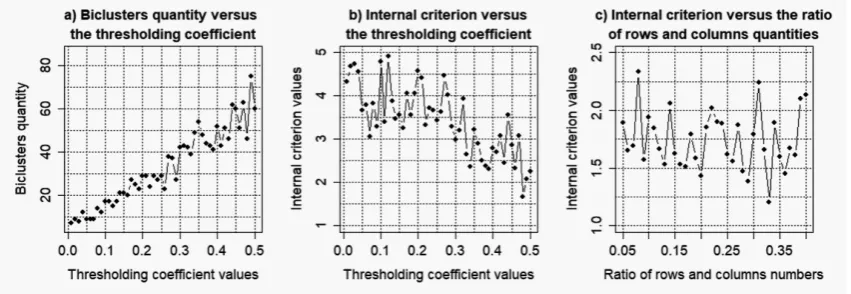
Figures 4–7 shows the charts of the obtained biclusters quantity and the value of the biclustering quality criterion versus the parameters of “ensemble” biclustering method (thresholding coefficient value (thr) and ratio of the number of rows and columns in biclusters (simthr)) in the case of bicluster analysis of the gene expression profiles of data moe430a with different levels of noise component. The following parameters were determined as the result of the obtained charts analysis:
• k= 0.025:thr= 0.33;simthr= 0.29;
• k= 0.05:thr= 0.35;simthr= 0.11;
• k= 0.075:thr= 0.26;simthr= 0.07;
• k= 0.1:thr= 0.48;simthr= 0.33;
Figure 4.Results of the simulation to determine the optimal parameters of "ensemble" biclustering method for noise coefficientk=0.025.
Figure 6.Results of the simulation to determine the optimal parameters of "ensemble" biclustering method for noise coefficientk=0.075.
Figure 7.Results of the simulation to determine the optimal parameters of "ensemble" biclustering method for noise coefficientk=0.1.
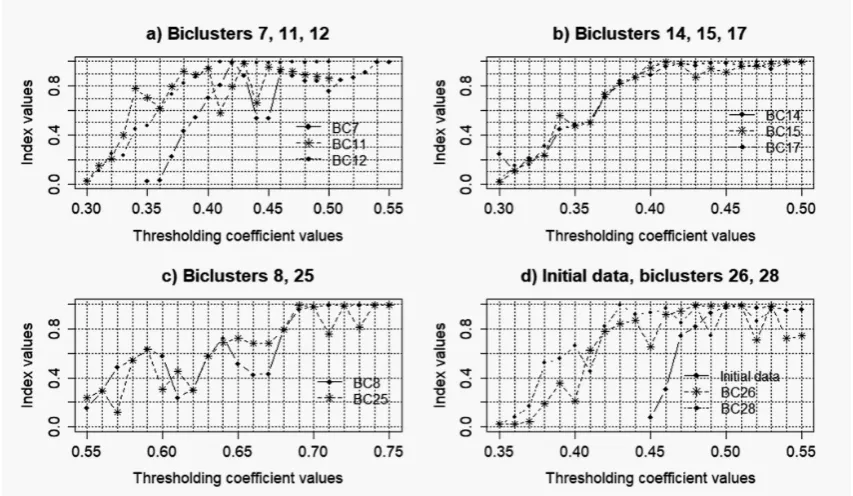
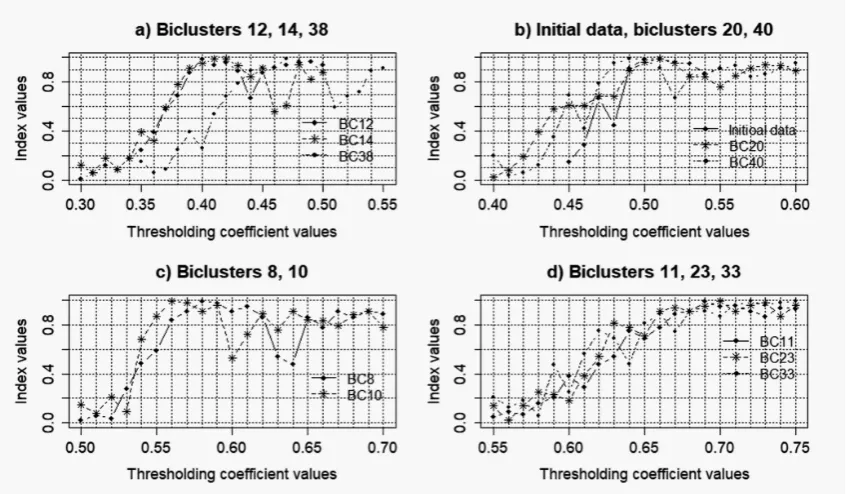
Ten largest biclusters from each of the studied data were selected for the further analysis. Reconstruction of the gene regulatory networks and validation of the obtained models were performed based on Cytoscape software with the use of correlation inference algorithm [26].Detailed description of the used information technology for the reconstruction and validation of gene networks is presented in [30]. Figures 8–11 presents the charts of general Harrington desirability index versus the value of thresholding coefficient for both the data without noise and data with different levels of noise component. The values of thresholding coefficient, which correspond to the maximum of Harrington desirability index for both the complete set of the studied gene expression profiles and the data in the obtained biclusters are presented in Table 1.
Figure 8.Charts of general Harrington desirability index versus the value of thresholding coefficient for gene networks reconstructed based on gene expression profiles with noise coefficientk=0.025.
Figure 10.Charts of general Harrington desirability index versus the value of thresholding coefficient for gene networks reconstructed based on gene expression profiles with noise coefficientk=0.075.
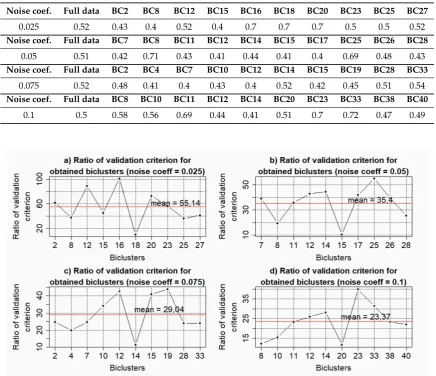
Table 1.The values of thresholding coefficient for gene networks reconstruction based on both the full data and selected biclusters for different levels of the noise component.
Noise coef. Full data BC2 BC8 BC12 BC15 BC16 BC18 BC20 BC23 BC25 BC27
0.025 0.52 0.43 0.4 0.52 0.4 0.7 0.7 0.7 0.5 0.5 0.52
Noise coef. Full data BC7 BC8 BC11 BC12 BC14 BC15 BC17 BC25 BC26 BC28
0.05 0.51 0.42 0.71 0.43 0.41 0.44 0.41 0.4 0.69 0.48 0.43
Noise coef. Full data BC2 BC4 BC7 BC10 BC12 BC14 BC15 BC19 BC28 BC33
0.075 0.52 0.48 0.41 0.4 0.43 0.4 0.52 0.42 0.45 0.51 0.54
Noise coef. Full data BC8 BC10 BC11 BC12 BC14 BC20 BC23 BC33 BC38 BC40
0.1 0.5 0.58 0.56 0.69 0.44 0.41 0.51 0.7 0.72 0.47 0.49
Figure 12. Results of validation of the gene networks reconstructed based on the gene expression profiles with different level of the noise component.
The analysis of the obtained charts allows us to conclude that the existence of the noise component decreases the degree of the adequacy of the gene networks reconstructed based on the biclusters to the network reconstructed on the basis of complete data. The average of the relative validation criterion for the obtained models of gene networks are significantly less than the appropriate value of this criterion in the case of gene networks reconstruction based on the gene expression profiles without noise [30]. Moreover, the analysis of the charts in Figure 12 has shown that the increase of the noise level in the data decreases the average of the relative validation criterion. This fact indicates the necessity of qualitative preprocessing of the gene expression profiles at the early stage of gene regulatory networks reconstruction.
4. Conclusions
the stability of the objective clustering inductive technology based on SOTA clustering algorithm have shown that this technology is not sensitive to noise in the case of low level of amplitude of the noise component. However, in the case of high level of noise in the gene expression profiles the variation of the algorithm parameters does not change the clustering results. This fact indicates the effectiveness of the proposed technology to clustering data, which contain some quantity of noise. The evaluation of the stability of the information technology of the gene regulatory network reconstruction to the level of the noise component has shown, what this technology is very sensitivity to noise. A slight increase of the noise amplitude promotes to the decrease of the degree of adequacy of the networks reconstructed based on the data in the obtained biclusters in relation to the network reconstructed on the basis of the complete set of the studied gene expression profiles in terms of the used criteria.
The following perspectives of the author’s research is the investigation of different algorithms of the gene regulatory networks reconstruction, estimation of their effectiveness, development of the validation methods for the reconstruction of the networks and simulation of the reconstructed network with the use of Bayes and Petri networks.
Abbreviations
The following abbreviations are used in this manuscript:
SOTA Self-Organizing Tree Algorithm
DBSCAN Density-Based Spatial Clustering of Applications with Noise DNA Deoxyribonucleic Acid
RNA Ribonucleic Acid PM Pirfect Match
References
1. Zak, D.E.; Vadigepalli, R.; Gonye, E.G.; Doyle, F.J.; Schwaber, J.S.; Ogunnaike, B.A. Unconventional systems analysis problem in molecular biology: a case study in gene regulatory network Modeling. Computational and Chemical Engineering2005,29(3), 547-563, DOI.10.1016/j.compchemeng.2004.08.016, URL: http://www.sciencedirect.com/science/article/pii/S0098135404002443.
2. Davidson, E.; Levin, M. Gene regulatory networks for development.Proceedings of the National Academy of Sciences of the USA,2005,102(14), 4936-4942, DOI: 10.1073/pnas.0408031102
3. Liang, S.; Fuhrman, S.; Somogyi, R. REVEAL, a general reverse engineering algorithm for inference of genetic network architectures.Pacific Symposium on Biocomputing, World Scientific Publishing Co.,1998,3 ), 18-29. 4. Zhang, X.; Zhou, Z.; Jiao, Y.; Niu, Y.; Wang, Y. A visual cryptography scheme-based DNA microarrays.
International Journal of Performability Engineering, 14(2), pp. 334–340, 2018. International Journal of Performability Engineering,2018,14(2), 334-340. DOI: 10.23940/ijpe.18.02.p14.334340
5. Shukla, S.; Agarwal, A.K.; Lakhmani, A. MICROCHIPS: A leading innovation in medicine. Proceedings of the 3rd International Conference on Computing for Sustainable Global Development, INDIACom2016,2016, No 7724256, 205-210. DOI: 10.23940/ijpe.18.02.p14.334340
6. Wu, X; Yang, B.; Udo-Inyang, I.; Ji, S.; Ozog, D.; Zhou, L.; Q.-S. Mi, Q.-S. Research Techniques Made Simple: Single-Cell RNA Sequencing and its Applications in Dermatology.Journal of Investigative Dermatology,2018, 138(5), 1004-1009. DOI: 10.1016/j.jid.2018.01.026
7. Wang, L.Y.; Guo, J.; Cao, W.; Zhang, M.; He, J.; Li, Z. Integrated sequencing of exome and mRNA of large-sized single cells.Scientific Reports,2018,No 384. DOI: https://doi.org/10.1038/s41598-017-18730-y 8. Puchala, D.; Szczepaniak, B.; Yatsymirskyy, M. Effective Realizations of Biorthogonal Wavelet Transforms of
Lengths 2K+1/2K-1 with Lattice Structures on GPU and CPU. 16th International Conference on Intelligent Data Engineering and Automated Learning (IDEAL), Book Series: Lecture Notes in Computer Science.2015, 9375, 130-137. DOI: 10.1007/978-3-319-24834-9_16
10. Pontes, B.; Giráldez, R.; Aguilar-Ruiz, J.S. Biclustering on expression data: A review.Journal of Biomedical Informatics,2015,57, 163-178. DOI: 10.1016/j.jbi.2015.06.028
11. Chi, E.C.; Allen, G.I.; Baraniuk, R.G. Convex Biclustering. Biometrics, 2017, 73(1), 10-20. DOI: 10.1111/biom.12540
12. Rocha, O.; Mendes, R. JBiclustGE: Java API with unified biclustering algorithms for gene expression data analysis.Knowledge-Based Systems,2018,155, 83-87. DOI: 10.1016/j.knosys.2018.04.024
13. Puleo, G.J.; Milenkovic, O. Correlation Clustering and Biclustering with Locally Bounded Errors. Proceedings of the 33 rd International Conference on Machine Learning, New York, NY, USA2018,64(6), 4105-4119. 14. Babichev, S.; Lytvynenko, V.; Korobchynskyi, M.; Skvor, J.; Voronenko, M. Information Technology of Gene
Expression Profiles Processing for Purpose of Gene Regulatory Networks Reconstruction. Proceedings of the 2018 IEEE Second International Conference on Data Stream Mining and Processing,2018, Lviv, Ukraine, 336-342
15. Ester, M.; Kriegel, H.; Sander, J.; Xu, X: A density-based algorithm for discovering clusters in large spatial datasets with noise. Proceedings of the Second International Conference on Knowledge Discovery and Data Mining, Portland,1996, 226-231. URL: http://dl.acm.org/citation.cfm?id=3001507
16. Dorazo, J.; Corazo, J. Phylogenetic reconstruction using an unsupervised growing neural network that adopts the topology of a phylogenetic tree. Journal of Molecular Evolution, 1997, 44(2), 226-259. DOI.https://doi.org/10.1007/PL00006139
17. Fritzke, B. Growing cell structures a self-organizing network for unsupervised and supervised learning. Neural Networks, 1994, 7(9), 1441-1460. URL: http://www. sciencedirect.com/science/article/pii/0893608094900914
18. Babichev, S.; Lytvynenko, V.; Korobchynskyi, M.; Taif, M.A. Objective Clustering Inductive Technology of Gene Expression Sequences Features.Communications in Computer and Information Science,2017,716, 359-372. DOI: 10.1007/978-3-319-58274-0_29
19. Babichev, S.; Lytvynenko, V.; Osypenko, V. Implementation of the Objective Clustering Inductive Technology Based on DBSCAN Clustering Algorithm. Proceedings of the 2017 12th International Scientific and Technical Conference on Computer Sciences and Information Technologies (CSIT),2017, Lviv, Ukraine, 479-484 20. Babichev, S.; Taif, M.A.; Lytvynenko, V.; Osypenko, V. Criterial Analysis of Gene Expression Sequences
to Create the Objective Clustering Inductive Technology. Proceedings of the 2017 37th IEEE International Conference on Electronics and Nanotechnology (ELNANO),2017, Kyiv, Ukraine, 244-248
21. Babichev, S.; Taif, M.A.; Lytvynenko, V. Estimation of the inductive model of objects clustering stability based on the k-means algorithm for different levels of data noise.Radio Electronics Computer Science Control, 2016,4, 54-60. DOI: 10.15588/1607-3274-2016-4-7
22. Setlak, G.; Bodyanskiy, Y.; Pliss, I.; Vynokurova, O.; Peleshko, D.; Kobylin, I. Adaptive Fuzzy Clustering of Multivariate Short Time Series with Unevenly Distributed Observations Based on Matrix Neuro-Fuzzy Self-organizing Network. Advances in Intelligent Systems and Computing, 2018, 643, 308-315. DOI: 10.1007/978-3-319-66827-7_28
23. Hausser, J.; Strimmer, K. Entropy inference and the james-stein estimator with application to nonlinear gene association networks. Journal of Machine Learning Research, 2009, 10, 1469-1484. URL: https://arxiv.org/abs/0811.3579
24. Babichev, S.; Lytvynenko, V.; Osypenko, V.; Korobchynskyi, M.; Voronenko, M. Comparison Analysis of Biclustering Algorithms With the Use of Artificial Data and Gene Expression Profiles. Proceedings of the 2018 38th IEEE International Conference on Electronics and Nanotechnology (ELNANO),2018, Kyiv, Ukraine, 292-297
25. Kaiser, S. Biclustering: Methods, Software and Application. Dissertation, LMU München: Faculty of Mathematics, Computer Science and Statistics.2011
26. Shannon, P.; Markiel, A.; Ozier, O.; Baliga, N.S.; Wang, J.T.; Ramage, D.; Amin, N.; Schwikowski, B.; Ideker, T. Cytoscape: a software environment for integrated models of biomolecular interaction networks.Genome Res.,2003, 2498-2504.
27. Harrington, J. The desirability function.Industrial Quality Control,1965,21(10), 494-498.
29. Bhattacherjee, V.; Mukhopadhyay, P.; Singh, S.; Johnson, C.; at al. Neural crest and mesoderm lineagedependent gene expression in orofacial development. Differentiation,2007, 75(5), 463-477. DOI: 10.1111/j.1432-0436.2006.00145.x