η
-nuclei in the SCAN experiment
KatarínaMichaliˇcková1,∗,S.V.Afanasiev2,∗∗,D.K.Dryablov2,∗∗∗, andS.Vokál1,∗∗∗∗ 1Institute of Physics, Faculty of Science, P. J. Šafárik University, Košice, Slovakia
2VBLHEP, Joint Institute for Nuclear Research, Dubna, Russia
Abstract.η-mesic nucleus or the quasibound nuclear state of anη-meson in a nucleus is caused by the strong-interaction force alone. The project SCAN2 is aimed at searching and studying theη-meson nuclei production. The experi-ment is based on two-arms spectrometer using internal target at the Nuclotron. The setup was designed to study products fromη-meson nucleus decay in the reactiond+12C → (A)
η +X → π+p+(A−2) at deuteron energies from
0.5 to 2.5 GeV/nucl. The energy spectrum of secondary protons has been mea-sured. The dependence of the yields of protons and pions on the beam energy has been obtained. This dependence can show us the minimum energy for the S11resonance formation. The first prototype of the neutron detector, which will
be used in a new modified experimental setup SCAN3 for recording of neutrons fromη-nucleus decays in theπnandpnchannels, has been tested. The time-of-flight method to obtain the neutron spectrum was used. The time resolution and efficiency of the neutron detector have been obtained.
1 Introduction
The study of the in-medium properties of hadrons has attracted continuous attention and is one of the most interesting topics of nuclear physics. The existence of anη-meson nuclei was postulated in 1986 by Liu and Haider and since then a search for such states was conducted in many experiments [1]. However, up to now no confirmed experimental evidence for the
η-meson nuclei was found. It has been considered that a meson-nucleus system may exist as a quasi-bound state, caused by the strong interaction. In nuclear reactions theη-meson interacts with recoiling nucleon and in the low momentum region the interaction is dominated by the broad nucleonS11(1535) resonance, which is very close to theηproduction threshold (49
MeV above theηNthreshold). The decay of this state through theS11(1535) resonance would
lead to apπ- pair emitted in opposite directions. The experiment SCAN at the Nuclotron in Joint Institute for Nuclear Research studies these exotic nuclei [2].
2 Data analysis of the SCAN2 experiment
The project SCAN2 is aimed at searching and studyingη-meson nuclei production. The ex-periment is based on the two-arms spectrometer using the internal target at the Nuclotron.
∗e-mail: [email protected] ∗∗e-mail: [email protected]
The setup was designed to study products of the η-meson nucleus decay in the reaction d+12C → (A)
η+X → π+p+(A−2) at deuteron energies from 0.5 to 2.5 GeV/nucl. The experiment was carried out on "the rise of the magnetic field". The dependence of the magnetic field induction on time is shown in Fig. 1.
0 0.5 1 1.5 2 2.5 3 3.5 4
t [s] 0
0.2 0.4 0.6 0.8 1 1.2
B [T] Entries 1089354Entries 1089354
Figure 1.Dependence of the magnetic field induction on time of deuteron beam
Expression (1) transfers the magnetic field induction to the kinetic energy of initial parti-cles:
T =
m2
d+(0.3BZR)2−md, (1)
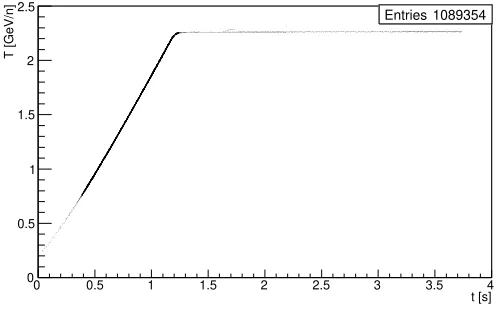
wheremd is the mass of deuteron, Bis the magnetic field induction andR is the effective radius. The maximum energy of the deuteron beam was 2.3 GeV/nucl (Fig. 2).
0 0.5 1 1.5 2 2.5 3 3.5 4
t [s] 0
0.5 1 1.5 2 2.5
T [GeV/n]
Entries 1089354 Entries 1089354
Figure 2.Dependence of the deuteron beam kinetic energy on time
η-nuclei decay should have the kinetic energy about 90 MeV. If theη-nuclei was formed than two peaks would be observed. One can see that the minimal energy of the deuteron beam for η-nuclei production is 0.8 GeV/nucl. Since the observed peak was not at 90 MeV, the corrections need to be made.
Entries 7958
0 20 40 60 80 100 120 140 160 180 200
[MeV] p E 0 0.02 0.04 0.06 0.08 0.1 9 − 10 × trig
/ Np
N
Entries 7958
<0.8 GeV/nucl d
0.6<T
Entries 103197
0 20 40 60 80 100 120 140 160 180 200
[MeV] p E 0 0.05 0.1 0.15 0.2 0.25 0.3 0.35 0.4 12 − 10 × trig
/ Np
N
Entries 103197
<1.0 GeV/nucl d
0.8<T
Figure 3. Energy spectrum of secondary protons. The minimal energy of deuteron beam forη-nuclei production is 0.8 GeV/nucl
3 Neutron detector for the SCAN3 experiment
The experimental setup SCAN2 will be modified to the experimental setup SCAN3. The new setup is planned as the three-arms spectrometer. The one arm is a magnetic arm for charged particles and another two are the time-of-flight spectrometers for the registration of neutrons and protons [3].
One of the task of the spectrometer SCAN3 is the detection of neutrons from theη-meson nucleus decay inπnand pnchannels. Theoretical predictions impose requirements on the accuracy in determining the energy of the pion-nucleon and nucleon-nucleon pairsδE≤10 MeV. The only way to ensure the neutron spectrometry is to use the time-of-flight method. In the SCAN-3 geometry, this leads to a limitation on the neutron transit time measurement accuracyδt =2.2 ns for the pion-nucleon channel andδt=0.4 ns for the nucleon-nucleon channel.
To test the neutron detector, a deuteron stripping reaction on the fixed target to obtain the neutron beam was used. The geometry of the neutron detector is shown in Fig. 4. The prototype of the neutron detector consist of 4 scintillation layers with 8 photomultipliers (8ND) on two opposite ends of the counter. The size of each scintillation layer is: 50cm× 14cm×5cm. A1 and A3 are the anticoincidence counters for detecting the charged particles and 4-SP-12 is the magnet. The target S1 is the think fiber with two photomultipliers.
Figure 4.Scheme of the neutron detector
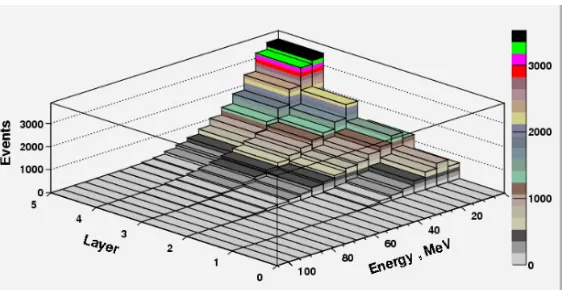
running. Depending on the length of the flight and the arrival time of the signal from the interaction to the counter, it is possible to estimate the velocity and the energy of the neutron. The energy distribution of neutrons in each layer of the detector is shown in Fig. 5. The neutrons interact continuously in all layers. The number of events in each layer depends on the position of layer. Each next layer detects the products of neutron interaction in all previous layers. It can be seen that the probability of interaction increase from layer to layer and after interaction the neutron with the proton of material these secondary protons have forward direction.
Figure 5.Energy distribution of the number of signals in each layer
In the case of incoming charged particles in the first layer, we have the signal and practi-cally constant occupancy in all layers. This case is shown in Fig. 6.
We have obtained the time resolution for the two closest layers at the deuteron beam energy 3 GeV/nucl. This time resolution is shown in Tab. 1.
Table 1.Time resolution for the two closest layers at deuteron energy beam 3 GeV/nucl
Ni−Nk N1−N3 N3−N5 N5−N7 N2−N4 N4−N6 N6−N8
σ[ns] 0.27 0.27 0.30 0.44 0.30 0.20
Figure 6.Energy distribution of the number of signals for charged particles in each layer
Figure 7.The efficiency of the neutron detector depends on the number of scintillation layers used
4 Conclusions
We have made the analysis of d+C reaction using the regime of increasing the primary energy of the beam. The maximum energy of deuteron beam was 2.3 GeV/nucl. The min-imum energy for theη-nuclei formation is 0.8 GeV/nucl. Corrections are needed to obtain more correct results. It has been shown that we can use increasing the magnetic field of the Nuclotron for study of the energy dependence. At the first time the experiment with the increasing magnetic field has been carried out. The first prototype of the neutron detector has been investigated. The detection efficiency of neutrons using four layers is 27%. This detector can be used for the time resolution in the experimental setup SCAN3 for recording neutrons in theπnandpndecay channels of theη-nucleus.
References
[1] Q. Haider and L.C. Liu, Phys. Lett. B172, 257 (1986)