Clinical Ophthalmology
Dove
press
O r i g i n a l r e s e a r C h
open access to scientific and medical research
Open access Full Text article
Correlation between optical coherence
tomography and multifocal electroretinogram
findings with visual acuity in retinitis pigmentosa
Marilita M Moschos irini P Chatziralli george Verriopoulos aristeides Triglianos Dimitrios s ladas Dimitrios Brouzas laboratory of electrophysiology, First Department of Ophthalmology, University of athens, athens, greece
Correspondence: Marilita M Moschos laboratory of electrophysiology, First Department of Ophthalmology, University of athens, 6 ikarias street, ekali, 14578, athens, greece Tel +30 694 488 7319 Fax +30 210 412 2139 email moschosmarilita@yahoo.fr
Introduction: Our purpose was to study the correlation between the macular morphology and function in eyes with retinitis pigmentosa (RP).
Methods: Sixty-six eyes from 33 patients with RP and with different visual acuity (VA) were studied using optical coherence tomography (OCT) and multifocal electroretinogram (mfERG). Correlation analysis was performed between VA, macular thickness, mfERG amplitude, and latency.
Results: Retinal thickness, retinal response density, and latency of the mfERG in the foveal area were independently and positively associated with VA (P= 0.002; P , 0.0001;
P= 0.029; and P= 0.002, respectively), whereas there was no evidence for a correlation between VA and the amplitude of mfERG in the parafoveal area. Evidence of a correlation between the OCT and the mfERG evaluation was of borderline significance (P= 0.047). Also, there was evidence for an inverse association of VA with latency in ring 1 and ring 2 (b=-0.138; 95% confidence interval: -0.261, -0.015; P= 0.029). In accordance with the univariate findings, when foveal retinal thickness, mfERG amplitude, and latency in ring 1 were inserted simultaneously in the same model, all the three variables remained significantly associated with VA (P= 0.016; P , 0.0001; and P= 0.031, respectively). Nevertheless, some individual values deviated from the expected range. More specifically, 15 eyes showed a normal retinal thickness, whereas the respective VA was relatively low and the mfERG values were abnormal. Conversely, in seven eyes, despite the low retinal thickness, the respective VA was high.
Conclusion: The combined use of OCT with mfERG appears to be more appropriate for the estimation of macular function.
Keywords: retinitis pigmentosa, OCT, mfERG, VA
Introduction
Retinitis pigmentosa (RP) comprises a heterogeneous group of inherited retinal disor-ders that primarily affects the rod and cone photoreceptors and provokes a progressive loss of them beginning in the periphery and progressing toward the central retina.1–3
Histopathologic studies on patients with RP have shown earlier anatomic changes, such as shortening and distortion of the outer segments of rods and cones.4,5 Currently
there is no treatment that can recover lost vision or halt disease progression. However, novel treatments including gene therapy,6,7 tissue transplantation,8,9 or retinal
prosthe-sis10–13 offer optimism on the subject. This makes better evaluation of the functional
and structural changes of the macula, which is better preserved until the late stages of the disease.
Clinical Ophthalmology downloaded from https://www.dovepress.com/ by 118.70.13.36 on 21-Aug-2020
For personal use only.
Number of times this article has been viewed
This article was published in the following Dove Press journal: Clinical Ophthalmology
Dovepress
Moschos et al
Optical coherence tomography (OCT) is a noninvasive technique that provides information about the morphology of the retina, and especially of the macular area in vivo. Some studies support the idea that OCT determines structural changes in the macula that are correlated with subjective visual function, including visual acuity (VA) and visual threshold in patients with RP. Additionally, multifocal electroretinogram (mfERG) evaluation can be useful in moni-toring macular function in RP, and mfERG responses have been shown to be associated with the subjective visual field size.14,15 However, to date, there are relatively few reports
concerning the combined use of OCT and mfERG for the investigation of the correlation between retinal morphology and function of the macula in patients with RP.16,17 The
pur-pose of our study was to investigate the usefulness of mfERG in the detection of early changes of macular function, and to determine whether a significant correlation exists between the amplitude of mfERG and the retinal thickness in the central area of the macula in patients with RP.
Methods
The study was based on 66 eyes of 33 patients (17 males and 16 females) with RP, examined in the First Department of Ophthalmology, University of Athens, Greece. Also, a group of 20 age- and sex-matched volunteers who were ophthalmologically normal, without ocular or systemic diseases, served as control subjects. Diagnosis was based on family history, fundus examination, and International Society for Clinical Electrophysiology of Vision standard full-field electroretinograms (ERGs). The exclusion criteria were atypical RP-like central RP, sector RP, or unilateral RP, cystoid macular edema, cataract, or glaucoma, which may affect mfERG and OCT recordings.
The inheritance pattern in 17 cases was autosomal domi-nant, and in seven cases was autosomal recessive, while in nine cases, RP was characterized as simplex, as it was dif-ficult to determine its inheritance. Interestingly, two patients presented with Usher syndrome II, which is characterized by congenital bilateral sensorineural hearing loss that is mild to moderate in the low frequencies and severe to profound in the higher frequencies, intact vestibular responses, and RP.18
A complete ophthalmic examination, including VA measurement by means of Snellen charts, OCT recordings, and mfERG recordings were performed. The patients had functional visual fields of at least 10° using the Humphrey field analyzer 24-2 threshold test (Carl Zeiss Meditec AG, Jena, Germany). The study was conducted in accordance with the tenets of the Declaration of Helsinki. Informed consent
was obtained from each patient after they were provided with an explanation of the nature of the study.
Optical coherence tomography (OCT)
OCT examination was performed with the OCT model 3000 (Stratus OCT; Carl Zeiss Meditec AG). The reti-nal mapping software was used, calculating the average retinal thickness of the central ring. All eyes were scanned in a radial spoke pattern centered on the foveola with a scan length of 6 mm.
The subjects were asked to gaze at the fixation light within the machine, and the foveolar fixation was confirmed by observing the retina through the infrared monitoring camera. The retinal thickness was calculated as the distance between the two boundaries along each A-scan using the attached automatic boundary detection software.
Multifocal erg
For the recording of the mfERG, the VERIS III (Visual Evoked Response Imaging System; Tomey Corporation, Nagoya, Japan) was used. The stimulus matrix consisted of 61 pattern scaled segments displayed on a cathode ray tube color monitor (Sony Corporation, Tokyo, Japan) driven at a frame of 72 Hz. These hexagons elicit approximately equal signal amplitudes at all locations on a normal retina. The luminance of the stimulus element in the light state was 100 cd/m2 in the lighted state
and ,cd/m2 in the dark state. Room lights should be on and
produce illumination close to that of the stimulus screen. Each hexagon was independently alternated between black and white at a rate of 72 Hz. The pattern seems to flicker randomly, but each element follows a fixed prede-termined sequence (presently an “m-sequence”) so that the overall luminance of the screen over time is relatively stable. The radius of the stimulus array subtended approximately 20° high and 25° wide. The bandwidth of the amplifier was 10–300 Hz and the amplification was ×10.000.
For signal acquisition, a bipolar contact lens was used in which the active and reference electrodes were incorporated in the contact lens. The ground electrode was attached to the earlobe. The fellow eye was closed, and the duration of the data acquisition was 8 minutes divided into eight sessions of 60 seconds. Patients’ fixation was monitored using a fundus camera system. The recording procedure was repeated if there were spurious potentials from eye blinks or if ocular movements were recorded.
The response density (amplitude per unit retinal area, nV/deg2) of each local response was estimated as the dot
product between the normalized response template and each
Clinical Ophthalmology downloaded from https://www.dovepress.com/ by 118.70.13.36 on 21-Aug-2020
Table 1 The distribution of visual acuity (decimal), foveal retinal thickness, mferg amplitude, and latency values
Variables
Visual acuity
#0.30 26 (36.4)
0.31–0.60 11 (20.0)
0.61–0.90 7 (10.3)
1.00 22 (33.3)
Foveal retinal thickness (μm) 152.95 ± 38.00
mferg (nV/deg2)
ring 1 91.52 ± 49.82
ring 2 33.67 ± 25.95
latency (ms)
ring 1 44.77 ± 7.55
ring 2 44.05 ± 8.49
Note: Data are presented as the number (%) or mean ± standard deviation.
Abbreviation: mferg, multifocal electroretinogram.
Dovepress OCT and mferg in retinitis pigmentosa
local response. The normal ranges for these amplitudes were defined by calculation of the median and the 95% confi-dence intervals (CIs) in both eyes of 20 normal volunteers (group B). Accordingly, group A consisted of 33 patients with RP.
The mfERG stimuli location and anatomic areas cor-responded roughly as follows: ring 1 to the fovea (0°–2°), ring 2 to the parafovea (2°–7°), ring 3 to the perifovea (7°–13°), ring 4 to the near periphery (3°–22°), and ring 5 to the central part of the middle periphery (22°–30.5°). The amplitude of each group was scaled to reflect the angular size of the stimulus hexagon, which produces the response. These averages give a more accurate view of the relative response densities of each group. The retinal response den-sity (RRD) decreases with eccentricity, although there is no further decrease from ring 4 to ring 5. The protocol followed the recommended guidelines of the International Society of Electrophysiology of Vision for basic mfERG.19
statistical analysis
Pearson’s coefficient was used to evaluate correlation. The Kolmogorov–Smirnov test checked the assumptions of normality. Several univariate linear regression models were per-formed to explore the association of VA with study parameters; VA was regarded as the outcome variable, whereas exploratory variables were defined as follows: foveal retinal thickness (model 1); mfERG amplitude in ring 1 (model 2); mfERG amplitude in ring 2 (model 3); latency in ring 1 (model 4); and latency in ring 2 (model 5). Further on, multivariate linear regression analysis was used in order to study the simultaneous insertion of foveal retinal thickness, mfERG amplitude, and latency. Significance was accepted at the P , 0.05 level. The SAS statistical package (version 9.1; SAS Institute Inc, Cary, NC, USA) was used to analyze the data.
Results
The mean age of our study sample was 45.94 ± 11.68 years, ranging from 25 years to 69 years. Table 1 shows the distribution of VA, foveal retinal thickness, mfERG ampli-tude, and latency values. The VA of 22 out of 66 eyes (33.3%) expressed in a decimal scale number was 1.0. The mean foveal retinal thickness value was calculated at 152.95 ± 38.00 μm. The mean RRD of mfERG was calculated at 91.52 ± 49.82 nV/deg2 and at 33.67 ± 25.95 nV/deg2 in
ring 1 and ring 2, respectively. The mean latency in ring 1 was 44.77 ± 7.55 ms and in ring 2 was 44.05 ± 8.49 ms.
Correlation analysis was performed between VA, foveal retinal thickness, mfERG amplitude, and latency
measurements (Table 2). Foveal retinal thickness, mfERG amplitude in ring 1, and latency in ring 1 and ring 2 were independently and positively associated with VA (P= 0.002;
P , 0.0001; P= 0.029; and P= 0.002, respectively), whereas there was no evidence for a correlation between VA and mfERG amplitude in ring 2. The evidence of a correlation between foveal retinal thickness and mfERG amplitude in ring 1 was of borderline significance (P= 0.047).
Subsequently, the data were modeled through linear regression analyses using VA as the dependent variable (Table 3). According to model 1, a 10 μm increase in foveal retinal thickness increases the mean VA by 0.039 (coeffi-cient b= 0.039; 95% CI: 0.016, 0.062; P= 0.002), whereas according to model 2, a 10 nV/deg2 increase in mfERG
amplitude increases the mean VA by 0.042 (b = 0.042; 95% CI: 0.026, 0.059; P , 0.0001). When foveal retinal thickness and mfERG amplitude in ring 1 were inserted simultaneously into the same model, both were found to be strongly associated with VA. Regarding mfERG amplitude in ring 2 (model 3) there was no evidence for an association with VA (P= 0.484). There was evidence for an inverse association of VA with latency in ring 1 (model 4) and ring 2 (model 5). Specifically, a 10 ms increase of latency in ring 1 decreases the mean VA by 0.138 (b=-0.138; 95% CI: -0.261, -0.015; P= 0.029), and a 10 ms increase of latency (ring 2) decreases the mean VA by 0.168 (b= 0.168; 95% CI: -0.274, -0.063; P= 0.002). In accordance with the univariate findings, when foveal retinal thickness, mfERG amplitude, and latency in ring 1 were inserted simultane-ously into the same model, all the three variables remained significantly associated with VA (P= 0.016; P , 0.0001; and P= 0.031, respectively).
Clinical Ophthalmology downloaded from https://www.dovepress.com/ by 118.70.13.36 on 21-Aug-2020
Table 2 Pearson’s coefficients and their respective P-values for the correlation between visual acuity, foveal retinal thickness, amplitude, and latency of mferg among the 66 eyes of the 33 study participants
Visual acuity Foveal retinal thickness mfERG (r1) MfERG (r2) Latency (r1)
Foveal retinal thickness 0.38 (P= 0.002)
mferg r1 0.55 (P , 0.0001) 0.25 (P= 0.047)
mferg r2 0.09 (P= 0.484) -0.06 (P= 0.628) 0.50 (P , 0.0001)
latency r1 -0.27 (P= 0.029) -0.09 (P= 0.482) -0.07 (P= 0.586) 0.14 (P= 0.270)
latency r2 -0.37 (P= 0.002) -0.15 (P= 0.227) -0.14 (P= 0.259) 0.14 (P= 0.252) 0.69 (P , 0.001) Abbreviations: mferg, multifocal electroretinogram; r1, ring 1; r2, ring 2.
Table 3 Regression coefficients b, 95% confidence intervals, and
P-values for changes of mean visual acuity by specified changes of
predictor variables (foveal retinal thickness, mferg, and latency) among the 66 eyes of the 33 study participants
Variable Increment Coefficient b 95% CI P-value
Model 1 Foveal retinal
thickness
10 μm 0.039 (0.016,
0.062)
0.002
Model 2 mferg
(ring 1)
10 nV/deg2 0.042 (0.026,
0.059)
,0.0001
Model 3 mferg
(ring 2)
10 nV/deg2 0.013 (-0.024, 0.050)
0.484
Model 4 latency
(ring 1)
10 ms -0.138 (-0.261,
-0.015) 0.029
Model 5 latency
(ring 2)
10 ms -0.168 (-0.274,
-0.063) 0.002
Abbreviation: mferg, multifocal electroretinogram.
Dovepress
Moschos et al
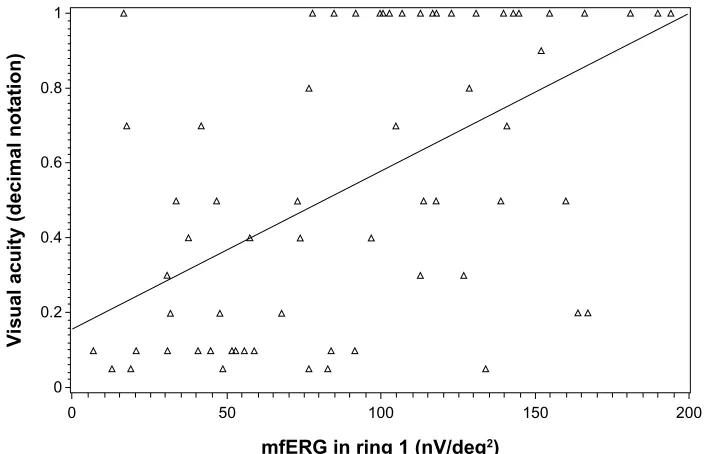
Further investigation into the spread of individual values revealed that most of the foveal retinal thickness and mfERG amplitude in ring 1 measurements of the study participants confirmed that both techniques are associated with the level of VA. Nevertheless, some individual values deviated from the expected range. Specifically, 15 eyes showed an increased reti-nal thickness value, whereas the respective VA was relatively low. Conversely, in seven eyes, despite the decreased foveal ret-inal thickness, the respective VA was high. Regarding mfERG amplitude in ring 1, five eyes showed an increased mfERG value when the respective VA was relatively low. Conversely, in ten eyes, despite the decreased mfERG amplitude, the respec-tive VA was high. Graphically, the relationships between VA and foveal retinal thickness, and VA and mfERG amplitude in ring 1 are depicted in Figures 1 and 2, respectively.
Discussion
Our results demonstrated that the RRD of mfERG in ring 1 and foveal thickness were associated with VA, whereas there
was no evidence of a correlation between VA and mfERG in ring 2. Furthermore, there was evidence for an inverse association of VA with latency in ring 1. Indeed, a 10 ms increase of latency in ring 1 decreases the mean VA by 0.138, and a 10 ms decrease of latency in ring 2 increases the mean VA by 0.168. This is in contrast with previous investigations, which have shown that patients with RP can have preserved mfERG timing in the central retina despite the decrease of mfERG amplitudes or the reduced temporal contrast sensitivity function.20,21 Another interesting finding
of our study is that there were patients lacking a central mfERG response despite good VA, in line with Gerth et al,22
who also found that some patients miss a central mfERG response despite a VA of 0.4 (decimal scale) or better and a normal Humphrey visual field foveal threshold. Seiple et al23 showed a similar example of a patient with RP, a VA
of 20/25, and preserved mfERG responses in the peripheral area without a central response.23 A possible explanation in
these cases could be that the number of intact photoreceptors may be sufficient to resolve a small visual angle required for good VA.22
Concerning the OCT findings, our results showed that foveal retinal thickness generally is positively associated with VA, and the evidence of a correlation between mfERG and OCT was of borderline significance. Nevertheless, some individual values deviated from the expected range. Specifically, 15 eyes showed a normal retinal thickness of the fovea, whereas the respective VA was relatively low. In these eyes, RRD of mfERG in ring 1 was subnormal. Conversely in seven eyes, despite the decreased foveal thickness, the respective VA was normal or quasi-normal. In three of these eyes, mfERG in ring 1 was normal.
These findings raise some questions about the correla-tion between the foveal retinal thickness and VA at least in some cases. It must be mentioned that Sugita et al15
postulated that there are some patients with RP whose macular OCT images are relatively well preserved, but their electrophysiological functions are severely reduced.
Clinical Ophthalmology downloaded from https://www.dovepress.com/ by 118.70.13.36 on 21-Aug-2020
250 200
150
Foveal retinal thickness (µm)
Visual acuity (decimal notation)
100 50
0 0.2 0.4 0.6 0.8 1
Figure 1 scatterplot for the association between foveal retinal thickness and visual acuity.
200 150
100
mfERG in ring 1 (nV/deg2)
Visual acuity (decimal notation)
50 0
0 0.2 0.4 0.6 0.8 1
Figure 2 scatter plot for the association between mferg (ring 1) and visual acuity.
Abbreviation: mferg,multifocal electroretinogram.
Dovepress OCT and mferg in retinitis pigmentosa
The real reason for this discrepancy was not determined. According to the authors, there are two possibilities. First, these patients may have very subtle structural changes which third-generation Stratus OCT (Carl Zeiss Meditec AG) cannot determine, or the functional abnormality may precede structural changes in some patients with RP. Similar findings were described in some patients with Leber congenital amaurosis and very low VA, where the cone photoreceptors and inner retinal architecture in the
central retina was retained.24,25 If this second possibility
is correct, only the combined assessment of macular structure by OCT and macular function by psychophysics or ERG can provide important information on the macula of patients with RP.15 On the contrary, the use of only OCT
or mfERG for the evaluation of the macula may lead to unreliable results and erroneous decisions for the feasibil-ity of upcoming treatments in the future treatment of RP.26
A potential limitation of our study pertains to the fact that
Clinical Ophthalmology downloaded from https://www.dovepress.com/ by 118.70.13.36 on 21-Aug-2020
Clinical Ophthalmology
Publish your work in this journal
Submit your manuscript here: http://www.dovepress.com/clinical-ophthalmology-journal
Clinical Ophthalmology is an international, peer-reviewed journal covering all subspecialties within ophthalmology. Key topics include: Optometry; Visual science; Pharmacology and drug therapy in eye diseases; Basic Sciences; Primary and Secondary eye care; Patient Safety and Quality of Care Improvements. This journal is indexed on
PubMed Central and CAS, and is the official journal of The Society of Clinical Ophthalmology (SCO). The manuscript management system is completely online and includes a very quick and fair peer-review system, which is all easy to use. Visit http://www.dovepress.com/ testimonials.php to read real quotes from published authors.
Dovepress
Dove
press
Moschos et al
the duration of the disease was not included in the analysis. In addition, spectral domain OCT, which is more accurate, was not able to be performed.
Conclusion
Our study suggested that RRD of mfERG in ring 1 was asso-ciated with VA, while no association was remarked in ring 2. Additionally, there was a significant association between the foveal thickness in OCT and VA. Therefore, the combined use of OCT with mfERG appears to be more appropriate for the estimation of macular function. Nevertheless, fur-ther studies are important for improving the combination of structural imaging and electrophysiological investigations of the macula for a better estimation of its activity.
Disclosure
The authors report no conflicts of interest in this work.
References
1. Carr RE, Heckenlively JR. Hereditary pigmentary degenerations of the retina. In: Duane TD, Jaeger EA, editors. Clinical Ophthalmology. Philadelphia, PA: JB Lippincott; 1987:1–28.
2. Heckenlively JR. RP syndromes. In: Heckenlively JR, editor. Retinitis Pigmentosa. Philadelphia, PA: JB Lippincott; 1988:221–252. 3. Weleber RG, Gregory-Evance K. Retinitis pigmentosa and allied
disorders. In: Hinton DR, editor. Retina:Basic Science and Inherited Retinal Disease. 4th ed. St Louis, MO: Mosby; 2006:395–498. 4. Szamier RB, Berson EL, Klein R, Meyers S. Sex-linked retinitis
pigmentosa: ultrastructure of photoreceptors and pigment epithelium.
Invest Ophthalmol Vis Sci. 1979;18(2):145–160.
5. Fariss RN, Li ZY, Milam AH. Abnormalities in rod photoreceptors, amacrine cells, and horizontal cells in human retinas with retinitis pigmentosa. Am J Ophthalmol. 2000;129(2):215–223.
6. Bennett J. Gene therapy for retinitis pigmentosa. Curr Opin Mol Ther. 2000;2(4):420–425.
7. Acland GM, Aguirre GD, Ray J, et al. Gene therapy restores vision in a canine model of childhood blindness. Nat Genet. 2001;28(1):92–95. 8. Lund RD, Coffey PJ, Sauvé Y, Lawrence JM. Intraretinal transplantation
to prevent photoreceptor degeneration. Ophthalmic Res. 1997;29(5): 305–319.
9. Bartsch U, Oriyakhel W, Kenna PF, et al. Retinal cells integrate into the outer nuclear layer and differentiate into mature photoreceptors after subretinal transplantation into adult mice. Exp Eye Res. 2008;86(4): 691–700.
10. Loewenstein JI, Montezuma SR, Rizzo JF. Outer retinal degen-eration: an electronic retinal prosthesis as a treatment strategy. Arch Ophthalmol. 2004;122(4):587–596.
11. Hossain P, Seetho IW, Browning AC, Amoaku WM. Artificial means for restoring vision. BMJ. 2005;330(7481):30–33.
12. Stingl K, Greppmaier U, Wilhelm B, Zrenner E. Subretinal visual implants. Klin Monbl Augenheilkd. 2010;227(12):940–945. German. 13. Julien S, Peters T, Ziemssen F, et al. Implantation of ultrathin,
biofunctionalized polyimide membranes into the subretinal space of rats. Biomaterials. 2011;32(16):3890–3898.
14. Hood DC, Holopigian K, Greenstein V, et al. Assessment of local retinal function in patients with retinitis pigmentosa using the multi-focal ERG technique. Vision Res. 1998;38(1):163–179.
15. Holopigian K, Seiple W, Greenstein VC, Hood DC, Carr RE. Local cone and rod system function in patients with retinitis pigmentosa.
Invest Ophthalmol Vis Sci. 2001;42(3):779–788.
16. Sugita T, Kondo M, Piao CH, Ito Y, Terasaki H. Correlation between macular volume and focal macular electroretinogram in patients with retinitis pigmentosa. Invest Ophthalmol Vis Sci. 2008;49(8): 3551–3558.
17. Wolsley CJ, Silvestri G, O’Neill J, Saunders KJ, Anderson RS. The association between multifocal electroretinograms and OCT retinal thickness in retinitis pigmentosa patients with good visual acuity.
Eye (Lond). 2009;23(7):1524–1531.
18. Bonnet C, El-Amraoui A. Usher syndrome (sensorineural deafness and retinitis pigmentosa): pathogenesis, molecular diagnosis and therapeutic approaches. Curr Opin Neurol. 2012;25(1):42–49.
19. Hood DC, Bach M, Brigell M, et al. ISCEV guidelines for clinical multifocal electroretinography (2007 edition). Doc Ophthalmol. 2008;116(1):1–11.
20. Seeliger M, Kretschmann U, Apfelstedt-Sylla E, Rüther K, Zrenner E. Multifocal electroretinography in retinitis pigmentosa. Am J Ophthalmol. 1998;125(2):214–226.
21. Felius J, Swanson WH. Photopic temporal processing in retinitis pigmentosa. Invest Ophthalmol Vis Sci. 1999;40(12):2932–2944. 22. Gerth C, Wright T, Héon E, Westall CA. Assessment of central
retinal function in patients with advanced retinitis pigmentosa. Invest Ophthalmol Vis Sci. 2007;48(3):1312–1318.
23. Seiple W, Clemens CJ, Greenstein VC, Carr RE, Holopigian K. Test-retest reliability of the multifocal electroretinogram and humphrey visual fields in patients with retinitis pigmentosa. Doc Ophthalmol. 2004;109(3):255–272.
24. Jacobson SG, Aleman TS, Cideciyan AV, et al. Identifying photore-ceptors in blind eyes caused by RPE65 mutations: prerequisite for human gene therapy success. Proc Natl Acad Sci U S A. 2005;102(17): 6177–6182.
25. Cideciyan AV, Aleman TS, Jacobson SG, et al. Centrosomal-ciliary gene CEP290/NPHP6 mutations result in blindness with unexpected sparing of photoreceptors and visual brain: implications for therapy of Leber congenital amaurosis. Hum Mutat. 2007;28(11):1074–1083. 26. Grigoropoulos VG, Emfietzoglou J, Nikolaidis P, et al. Optical
coher-ence tomography findings in patients with retinitis pigmentosa and low visual acuity. Ophthalmic Surg Lasers Imaging. 2010;41(1):35–39.
Clinical Ophthalmology downloaded from https://www.dovepress.com/ by 118.70.13.36 on 21-Aug-2020