Transaction Graph
Dorit Ron and Adi Shamir
Department of Computer Science and Applied Mathematics, The Weizmann Institute of Science, Israel
{dorit.ron,adi.shamir}@weizmann.ac.il
Abstract. The Bitcoin scheme is a rare example of a large scale global
payment system in which all the transactions are publicly accessible (but in an anonymous way). We downloaded the full history of this scheme, and analyzed many statistical properties of its associated transaction graph. In this paper we answer for the first time a variety of interest-ing questions about the typical behavior of users, how they acquire and how they spend their bitcoins, the balance of bitcoins they keep in their accounts, and how they move bitcoins between their various accounts in order to better protect their privacy. In addition, we isolated all the large transactions in the system, and discovered that almost all of them are closely related to a single large transaction that took place in November 2010, even though the associated users apparently tried to hide this fact with many strange looking long chains and fork-merge structures in the transaction graph.
Keywords: bitcoin, digital coins, electronic cash, payment systems,
trans-action graphs, quantitative analysis
1
Introduction
Bitcoins are digital coins which are not issued by any government, bank, or organization, and rely on cryptographic protocols and a distributed network of users to mint, store, and transfer. The scheme was first suggested in 2008 by Satoshi Nakamoto [1], and became fully operational in January 2009. It had attracted a large number of users and a lot of media attention [2] [3] [4], but so far it was difficult to get precise answers to simple questions such as: How many different users are there in the system? How many bitcoins are typically kept in each account, and how does this balance vary over time? Are most bitcoins kept by a few large users? Do they keep their bitcoins in “saving accounts” or do they spend them immediately? How many users had large balances at some point in time? What is the size distribution of bitcoin transactions, and how many of them are micropayments?
full public record of this system in one of its two major forms1, which consisted
of about 180,000 HTML files. After parsing and processing these files, we built a graph of all the Bitcoin addresses and transactions up to that date. We then used the methodology described in the next section in order to try to identify which addresses are likely to belong to the same entity, and used this information to contract the transaction graph by merging such addresses, in order to get a more accurate picture of the full financial activity of each user. We then analyzed many statistical properties of both the original and the contracted transaction graphs (most of our statistical results were very similar for the two graphs, within a factor of 2). The most interesting and informative distributions we found are described in a series of tables. In addition, we isolated all the large (≥50,000 bitcoins) transactions which were ever recorded in the system, and analyzed how these amounts were accumulated and then spent. We discovered that almost all these large transactions were the descendants of a single large transaction involving 90,000 bitcoins which took place on November 8th 2010, and that the
subgraph of these transactions contains many strange looking chains and fork-merge structures, in which a large balance is either transferred within a few hours through hundreds of temporary intermediate accounts, or split into many small amounts which are sent to different accounts only in order to be recombined shortly afterwards into essentially the same amount in a new account.
There was one previous reported attempt [5] to download and analyze the full Bitcoin history, which also used the same methodology to try to contract all the addresses which are believed to belong to the same user. They created the graph of transactions on July 12th2011, which was before the scheme really
caught on. Thus, the total number of bitcoins participating in all the transactions in our graph is about three times larger than in their graph. In addition, we expect the transactions in our more mature graph to better represent typical use of the system, whereas their graph represents primarily the experiments run by early adopters. However, the biggest difference between our papers is that they were primarily interested in privacy issues, whereas we are primarily interested in the statistical properties of the Bitcoin transaction graph. Another analysis of the Bitcoin transaction graph was presented at the Chaos Computer Club Conference in Germany in December 2011 [6]. Again, they were primarily interested in how to defeat the anonymity of the network, but also included some interesting comments about the economic principles behind the scheme, the effect of lost coins on its operation, weaknesses in its protocols, and the general topological properties of this transaction graph.
The paper is organized as follows. In Section 2 we describe the Bitcoin scheme. In Section 3 we summarize the main statistical distributions we ex-tracted from the downloaded transactions, which describe many interesting and even surprising properties of the scheme. Finally, in Section 4 we present the graph of the largest transactions and analyze its strange structure.
1
2
The Bitcoin Scheme
Bitcoin is a decentralized electronic cash system using peer-to-peer networking to enable payments between parties without relying on mutual trust. It was first described in a paper by Satoshi Nakamoto (widely presumed to be a pseudonym) in 2008. Payments are made in bitcoins (BTC’s), which are digital coins issued and transferred by the Bitcoin network. The data of all these transactions, after being validated with a proof-of-work system, is collected into what is called the block chain.
Participants begin using bitcoin by first acquiring a program called a Bitcoin wallet and one or more Bitcoin addresses. Bitcoin addresses are used for receiving bitcoins, in the same way that e-mail addresses are used for receiving e-mails. Even though Bitcoin is considered to be an experimental payment system, it is already deployed on a large scale (in the sense that the current value of all the coins issued so far exceeds 100,000,000 USD) and attracts a lot of media attention. Its proponents claim that it is the first truly global currency which does not discriminate its users based on citizenship or location, it is always running with no holidays, it is easy to secure with very low usage fees, it has no chargebacks, etc. On the other hand, its detractors claim that it is widely misused to buy illegal items and to launder large sums of money, and that it is too easy to steal bitcoins from wallets via cyber attacks.
Unlike fiat currency, which has been declared to be legal tender by a gov-ernment despite the fact that it has no intrinsic value and is not backed by reserves, the Bitcoin scheme has no centralized issuing authority. The network is programmed to increase the money supply in a slowly increasing geometric series until the total number of bitcoins reaches an upper limit of about 21 mil-lion BTC’s. Bitcoins are awarded to Bitcoin “miners” for solving increasingly difficult proof-of-work problems which confirm transactions and prevent double-spending. The network currently requires over one million times more work for confirming a block and receiving an award (currently 50 BTC’s) than when the first blocks were confirmed.
The exchange rate of bitcoins has fluctuated widely over the years, from merely $0.01 to over $30 per BTC. Today (October 2012) it is worth a little over $12 per BTC. The entire activity in the Bitcoin network is publicly available through the internet in two major forms, and the one we decided to download appears as a block chain, starting at block 0 [7] (created back on the 3rd of
January 2009). Each block reports on as little as a single transaction to as much as over a thousand transactions, and provides hyperlinks to other blocks and to other activities of each address.
de-tails of who gave how much to whom. An address may receive bitcoins which are either newly minted or have a specific sending address. Another important difference between Bitcoin transactions and regular bank transactions is the no-tion of change, which is related to the fact that bitcoins are kept in (possibly fractional sized) chunks which have to be transferred in an all or nothing way. For example, a user can have three chunks of 10 bitcoins each. A transaction can spend 12.5 bitcoins by transferring the first full chunk plus 2.5 bitcoins from the second chunk, and then the 7.5 bitcoin change should be sent to a new address owned by the same user with new public and private keys. The user then has the option of either transferring the third chunk to the new address, or leaving it in the old address. In fact, it is considered good practice for a user to generate a new address, i.e., public-private key-pair, for every transaction even if this is not necessary. To better protect their identity, users are advised to take the follow-ing steps: they do not have to reveal any identifyfollow-ing information in connection with their addresses; they can repeatedly send varying fractions of their BTC’s to themselves using multiple (newly generated) addresses; and/or they can use a trusted third-party in the form of a shared e-wallet to mix their transactions with those of other owners.
can estimate with our methodology that WikiLeaks owns at least 83 addresses, that it was involved in at least 1088 transactions, and that it had an accumulated income in all these addresses of 2605.25 BTC’s.
We acquired the complete state of the Bitcoin transaction system on May 13th2012, which contained all the transactions carried out in the system since its inception on January 3rd2009 until that date. This required downloading 180,001 separate but linked HTML files, starting from block number 180,000 [8] and following the links backwards to the zeroth block initiating the system in January 2009. Each file was parsed in order to extract all the multisender/multireceiver transactions in it, and then the collection of transactions was encoded as a standard database on our local machine. We then ran a variant of a Union-Find graph algorithm [9] in order to find sets of addresses which are expected to belong to the same user. We merged all the nodes and combined all the transactions which can be associated with him (without eliminating the internal transfers, which become self loops in the new graph). We call the original transaction graph theaddress graph, and the contracted transaction graph theentity graph (we avoid using the word “owner” with its complex legal connotations since we do not really know who owns each address, and instead use the neutral word “entity” as our best approximation to the common owner of multiple addresses). All the statistics described in Section 3 are derived from both the address graph and the entity graph, as indicated in the tables. In most (but not all) cases, we expect the statistics to change monotonically as we move from the address graph to the entity graph and then to the (unknown) owner graph, since each entity is typically the union of several addresses which we managed to merge, and each real owner is typically the union of several entities that we failed to merge. For example, since the average balance of an address is 2.4 BTC’s and the average balance of an entity is 3.7, we can argue that the average balance of an owner is likely to be larger than 3.7 BTC’s. This monotonicity can thus be used to provide plausible upper or lower bounds for the statistical properties of the real ownership graph, even though we do not know it.
3
Statistics Calculated Over the Bitcoin Transaction
Graph
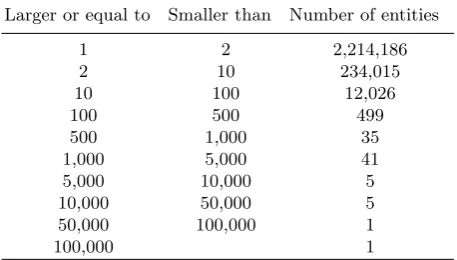
some of these addresses and following their transactions, it is easy to determine that this entity is Mt.Gox, which is the most popular Bitcoin Exchange site (responsible for almost 90% of all the exchange operations in the network). The full distribution of the number of addresses per entity is given in Table 1.
Table 1.The distribution of the number of addresses per entity
Larger or equal to Smaller than Number of entities
1 2 2,214,186
2 10 234,015
10 100 12,026
100 500 499
500 1,000 35
1,000 5,000 41
5,000 10,000 5
10,000 50,000 5
50,000 100,000 1
100,000 1
In our reduced entity graph, each m-to-n transaction has a single sender (since the m sending addresses necessarily belong to the same entity) and at mostnreceivers. It can thus be decomposed into at mostndifferent transactions from the single entity associated with the m senders to the entities associated with the n receivers. In case some of the receiving addresses are identified as belonging to the same entity, their amounts are accumulated to create a single common transaction, and if some of the receivers are identified with the single sender, we create a single self loop with the combined amounts. The resulting entity graph has 7,134,836 single sender and single receiver transactions, out of which 814,044 (about 11%) involve Deepbit (the largest Bitcoin mining pool), and 477,526 (about 7%) involve Mt.Gox. About 10% of the transactions are self loops. The entity graph is not connected as it is composed of 133,742 different connected components, many of size one. For instance, there are as many as 43,710 components (about 33%) consisting of a single address which are used only for accepting (one or several batches of) freshly minted bitcoins, and which have never participated in any incoming or outgoing transactions. Note that the address graph has a larger number of 13,734,847 transactions of lower values, since a single transaction with 2 sending addresses and 3 receiving addresses is represented in the address graph as 6 single-sender and single-receiver transac-tions.
go much further than that, since the entire transaction graph can be used to determine the financial history of each entity including all of its sending/receiving activities along with the daily balance of bitcoins in its various addresses and how they vary over time. Having this entity graph at hand enables us to study various statistical properties of the network, which are not easy to determine by following a small number of online links in the Blockexplorer representation of the Bitcoin network. In the rest of this section, we describe some of our findings so far.
Here is our first surprising discovery, which is related to the question of whether most bitcoins are stored or spent. The total number of BTC’s in the system is linear in the number of blocks. Each block is associated with the gen-eration of 50 new BTC’s and thus there are 9,000,050 BTC’s in our address graph (generated from the 180,001 blocks between block number zero and block number 180,000). If we sum up the amounts accumulated at the 609,270 ad-dresses which only receive and never send any BTC’s, we see that they contain 7,019,100 BTC’s, which are almost 78% of all existing BTC’s. Due to the way bitcoins can be repeatedly moved to fresh addresses, some of which can be very recent, we can not claim that all these bitcoins are out of circulation. However, 76.5% of these 78% (i.e., 59.7% of all the coins in the system) are “old coins”, defined as bitcoins received at some address more than three months before the cut off date (May 13th2012), which were not followed by any outgoing
transac-tions from that address after they were received. One can also argue that very old dormant bitcoins were simply abandoned or lost by users who experimented with the system in its early days, when it was very difficult to buy anything or to exchange bitcoins into dollars. To be even more cautious with our estima-tion of dormant bitcoins, we decided to ignore all the transacestima-tions which took place prior to July 18th2010, when Mt.Gox started its exchange and price quot-ing services. The sum of the balances of all the addresses which have not been active since that date is 1,657,480 bitcoins. Clearly, by considering all these bit-coins as “lost” rather than “hoarded” we are underestimating the number of bitcoins which are kept dormant in “saving accounts”. By ignoring these very old bitcoins and repeating the same calculation, we found that 73% of all the remaining BTC’s were accumulated at addresses which only receive and never send bitcoins, and that 70% of these 73% (i.e., 51%) are dormant bitcoins in the sense that they were received more than three months before our cutoff date but after it became easy to exchange them. If instead of summing the transaction values we sum thefinal balances of all the addresses that were active after July 18th 2010 but became inactive in the last three months, we get that 55% of all
and thus each coin which is in circulation had to be moved a large number of times to account for this total flow.
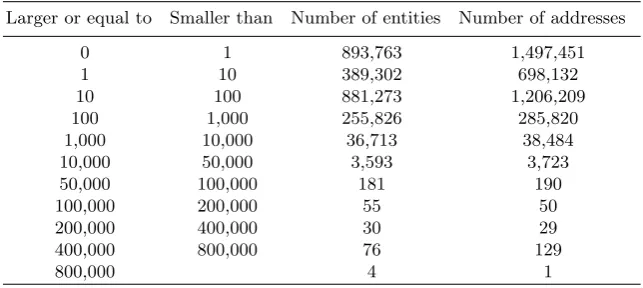
Another interesting finding is that the total number of bitcoins received by most entities and addresses is negligible. In the rest of this section, we use un-parenthesized numbers to indicate values derived from the entity graph, and parenthesized numbers to indicate values derived from the address graph. For example, as can be seen from Table 2, 36% of all entities (and 40% of all ad-dresses) received fewer than one BTC, currently worth about 12 USD, through-out their lifetime, 52% (59%) received fewer than 10 BTC’s and 88% (91%) fewer than 100. At the other end of the distribution there are only four entities (and one address) which received over 800,000 BTC’s, and 80 entities (129 addresses) which received over 400,000.
Table 2. The distribution of the accumulated incoming BTC’s per entity and per
address
Larger or equal to Smaller than Number of entities Number of addresses
0 1 893,763 1,497,451
1 10 389,302 698,132
10 100 881,273 1,206,209
100 1,000 255,826 285,820
1,000 10,000 36,713 38,484
10,000 50,000 3,593 3,723
50,000 100,000 181 190
100,000 200,000 55 50
200,000 400,000 30 29
400,000 800,000 76 129
800,000 4 1
Similarly, as can be seen in Table 3 the current (on May 13th2012) balance of almost 97% (98%) of all entities (addresses) was less than 10 BTC’s. This number decreases to 88% (91%) if instead of looking at one specific moment, we look at the maximal balance ever seen throughout an entity’s (address’es) lifetime. This statistics is summarized in Table 4. In addition, it can be seen that there are only 78 entities (70 addresses) with current balance larger than 10,000 BTC’s. This number grows to 3,812 (3,876) when looking at the maximal balance ever seen.
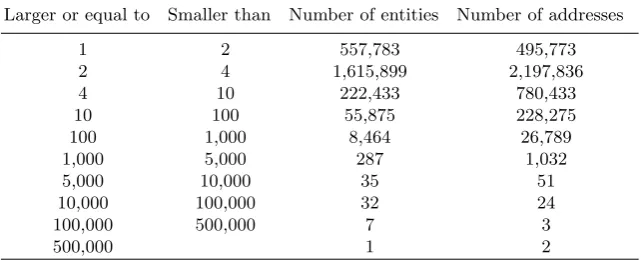
Another measure that may indicate the level of activity of an entity (address) is the number of transactions it has been involved with. Its distribution is pre-sented in Table 5. It is remarkable that 97% (93%) of all entities (addresses) had fewer than 10 transactions each, while 75 entities (80 addresses) use the network very often and are affiliated with at least 5,000 transactions.
Table 3. The distribution of the current (on May 13th 2012) balance of BTC’s per entity and per address
Larger or equal to Smaller than Number of entities Number of addresses
0 0.01 2,097,245 3,399,539
0.01 0.1 192,931 152,890
0.1 10 95,396 101,186
10 100 67,579 68,907
100 1,000 6,746 6,778
1,000 10,000 841 848
10,000 50,000 71 65
50,000 100,000 5 3
100,000 200,000 1 1
200,000 400,000 1 1
400,000 0 0
Table 4.The distribution of the maximal balance of BTC’s ever seen per entity and
per address
Larger or equal to Smaller than Number of entities Number of addresses
0 0.1 547,763 1,063,876
0.1 10 668,247 1,160,170
10 100 945,083 1,188,596
100 1,000 259,142 276,613
1,000 10,000 36,769 37,087
10,000 50,000 3,513 3,521
50,000 100,000 163 159
100,000 200,000 40 41
200,000 400,000 26 26
400,000 500,000 68 129
500,000 2 0
Table 5.The distribution of the number of transactions per entity and per address
Larger or equal to Smaller than Number of entities Number of addresses
1 2 557,783 495,773
2 4 1,615,899 2,197,836
4 10 222,433 780,433
10 100 55,875 228,275
100 1,000 8,464 26,789
1,000 5,000 287 1,032
5,000 10,000 35 51
10,000 100,000 32 24
100,000 500,000 7 3
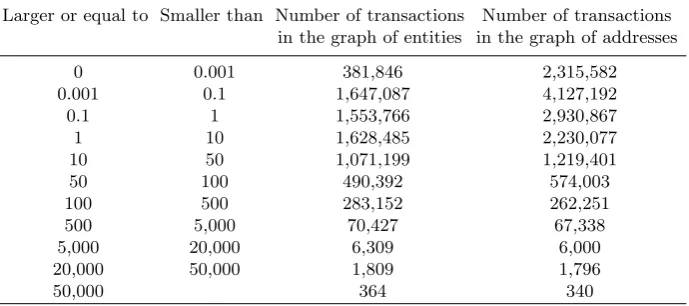
scheme actually enables sending micro transactions, which are of the order of 10−8 BTC (this is the smallest fraction into which a BTC can be broken, and is called a satoshi). When we also consider midsize amounts, we see that 73% (84%) of the transactions involve fewer than 10 BTC’s. On the other hand, large transactions are rare at Bitcoin: there are only 364 (340) transactions larger than 50,000 BTC’s. We have carefully inspected all these large transactions and describe our findings in the next section.
Table 6.The distribution of the size of the transactions in the Bitcoin scheme
Larger or equal to Smaller than Number of transactions Number of transactions
in the graph of entities in the graph of addresses
0 0.001 381,846 2,315,582
0.001 0.1 1,647,087 4,127,192
0.1 1 1,553,766 2,930,867
1 10 1,628,485 2,230,077
10 50 1,071,199 1,219,401
50 100 490,392 574,003
100 500 283,152 262,251
500 5,000 70,427 67,338
5,000 20,000 6,309 6,000
20,000 50,000 1,809 1,796
50,000 364 340
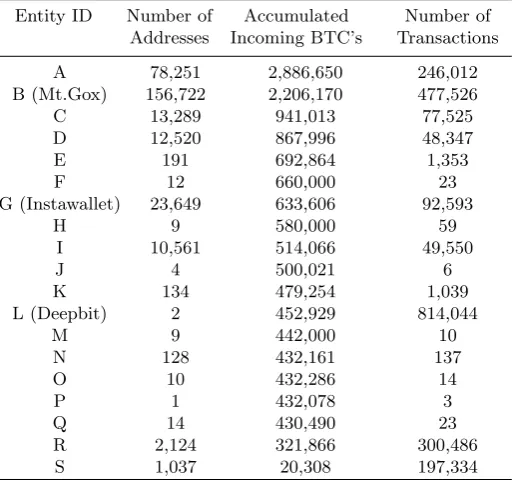
It is interesting to investigate the most active entities in the Bitcoin system, those who have either maximal incoming BTC’s or maximal number of trans-actions. 19 such entities are shown in Table 7 sorted in descending order of the number of accumulated incoming BTC’s shown in the third column. The left-most column associates the entities with letters between A to S out of which three are identified: B is Mt.Gox, G is Instawallet and L is Deepbit. Eight ad-ditional entities: F, H, J, M, N, O, P, and Q are pointed out in the graph of the largest transactions (Fig. 1) which is presented in the next section. The sec-ond column gives the number of addresses merged into each entity. The fourth column presents the number of transactions the entity is involved with.
trans-Table 7.The list of most active entities in Bitcoin, which have either maximal incoming BTC’s or maximal number of transactions. Some of the letters in the leftmost column: F, H, J, M, N, O, P and Q refer to the red letters in Fig. 1 pointing these entities out.
Entity ID Number of Accumulated Number of
Addresses Incoming BTC’s Transactions
A 78,251 2,886,650 246,012
B (Mt.Gox) 156,722 2,206,170 477,526
C 13,289 941,013 77,525
D 12,520 867,996 48,347
E 191 692,864 1,353
F 12 660,000 23
G (Instawallet) 23,649 633,606 92,593
H 9 580,000 59
I 10,561 514,066 49,550
J 4 500,021 6
K 134 479,254 1,039
L (Deepbit) 2 452,929 814,044
M 9 442,000 10
N 128 432,161 137
O 10 432,286 14
P 1 432,078 3
Q 14 430,490 23
R 2,124 321,866 300,486
actions, see Section 4 below. On the other hand, entity A had never sent any large transactions and thus it has not been included in our graph of the largest transactions.
4
The Graph of the Largest Transactions in Bitcoin
We have identified and analyzed all the largest (≥50,000 BTC’s) transactions in the entity graph, (there were 364 such transactions as described in the last column of Table 6), and followed their flow. We started with the earliest such large transaction, the one of 90,000 BTC’s made on November 8th 2010. By tracing each of the other 363 large transactions in this category, we were able to show that 348 were actual successors of this initial transaction. The resulting directed graph is depicted in Fig. 1. This graph reveals several characteristic behaviors of the flow in the Bitcoin transaction graph: long consecutive chains of transactions, fork-merge patterns that may include self loops, setting aside BTC’s and final distribution of large sums via a binary tree-like structure.
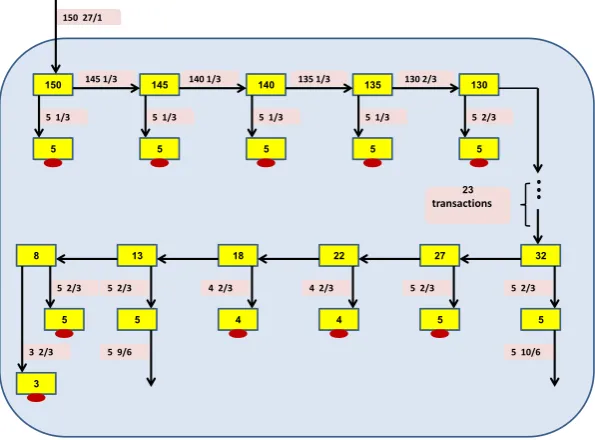
Long Chains.A common prominent practice of Bitcoin users is to create
chains of consecutive transactions. Some of these chains can be explained by the change mechanism in which small payments are accompanied by the creation of a new address, into which the user transfers the difference. Such chains can be found in Fig. 2, Fig. 4, Fig. 5 and Fig. 7, with lengths of 3, 15, 26, 80, 88 and 350 transactions. However, the behavior seen in Fig. 3 deviates significantly from this pattern, since the same amount of 5,000 bitcoins is repeatedly split off the main sum and put into accounts which have no additional transactions associated with them.
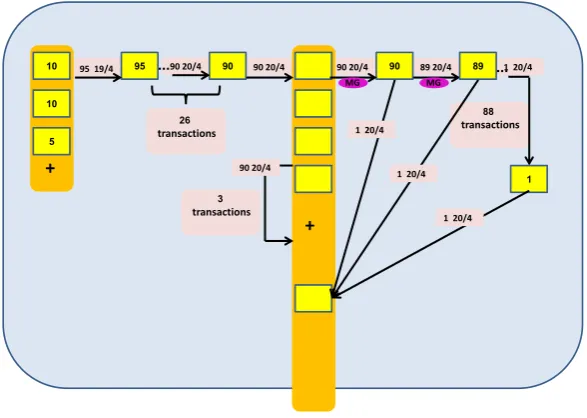
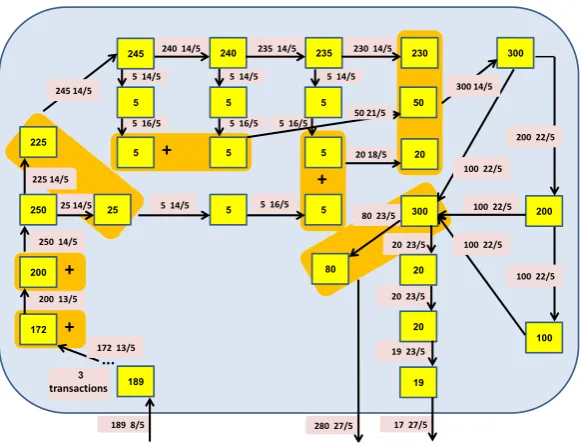
Fork-Merge Patterns and Self Loops.Another frequent scenario in
Bit-coin is transferring a large number of BTC’s from one address to another via several intermediate addresses, each receiving part of the entire amount and then sending it, mostly in full, to the same destination whether directly or via other mediators. Examples can be seen in Fig. 6, Fig. 8 and Fig. 9. A harder to follow fork-merge pattern is presented in Fig. 5: An entity is sending 90,000 BTC’s to itself three times in self loops. Each time it splits it into different amounts, 76+14, 72+18 and 69+21. It uses the same address for the small amounts and different addresses for the large amounts. Then it exchanges the entire 90,000 BTC’s at Mt.Gox. Finally, the 90,000 BTC’s are being transferred via a chain of 90 transactions using 90 different addresses (which may or may not belong to the same owner), where at each one of them 1,000 BTC’s are sent back to the first entity, recombined into essentially the very first amount of 90,000 BTC’s.
Keeping Bitcoins in “Saving Accounts”.Another long chain of
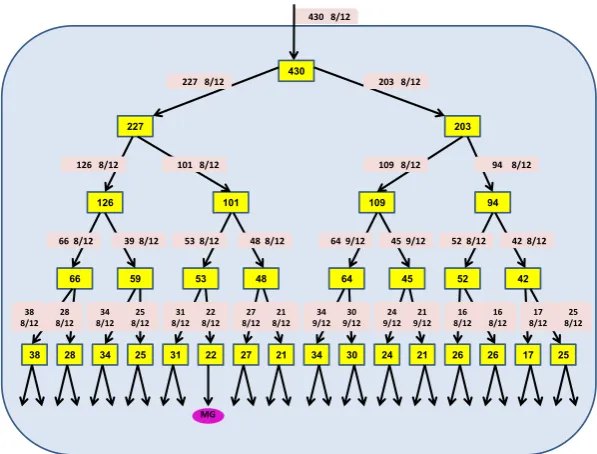
Binary Tree-Like Distributions.Often amounts of BTC’s are distributed among many addresses by splitting it into two similar amounts at each step. This results in a binary tree-like structure as depicted in Fig. 10 and in Fig. 4.
5
Conclusions
The Bitcoin system is the best known and most widely used alternative payment scheme, but so far it was very difficult to get accurate information about how it is used in practice. In this paper we describe a large number of statistical properties of the Bitcoin transaction graph, which contains all the transactions which were carried out by all the users until May 13th 2012. We discovered that most of the minted bitcoins remain dormant in addresses which had never participated in any outgoing transactions. We found out that there is a huge number of tiny transactions which move only a small fraction of a single bit-coin, but there are also hundreds of transactions which move more than 50,000 bitcoins. We analyzed all these large transactions by following in detail the way these sums were accumulated and the way they were dispersed, and realized that almost all these large transactions were descendants of a single transaction which was carried out in November 2010. Finally, we noted that the subgraph which contains these large transactions along with their neighborhood has many strange looking structures which could be an attempt to conceal the existence and relationship between these transactions, but such an attempt can be foiled by following the money trail in a sufficiently persistent way.
Acknowledgments. This research was supported by the Citi Foundation. We
would like to thank Ronen Basri, Uriel Feige, Michal Irani, Robert Krauthgamer, Boaz Nadler, Moni Naor and David Peleg from the Computer Science and Ap-plied Mathematics Department of the Weizmann Institute of Science for many interesting and informative discussions. We would also like to thank Aharon Friedman for his major help in acquiring and processing the Bitcoin data base. Finally, we would like to thank all the members of the Bitcoin community, and in particular Meni Rosenfeld and Stefan Richter, who sent us excellent comments, criticisms and suggestions. We revised the original version of the paper in order to respond to their input.
References
1. Nakamoto, S.: Bitcoin: A Peer-to-Peer Electronic Cash System, 2008.
2. Wallace, B.: The Rise and Fall of Bitcoin, Wired Magazine, 23 November 2011, http://www.wired.com/magazine/2011/11/mf_bitcoin/all/
3. NPR Staff: Silk Road: Not Your Father’s Amazon.com, 12 June 2011,http://www.
npr.org/2011/06/12/137138008/silk-road-not-your-fathers-amazon-com
4. Brett, W.: Senators seek crackdown on ”Bitcoin” currency,
Reuters, 8 Jun 2011, http://www.reuters.com/article/2011/06/08/
5. Reid, F., Harrigan M.: An Analysis of Anonymity in the Bitcoin System, arXiv:1107.4524v2 [physics.soc-ph] 7 May 2012.
6. Hamacher, K., Katzenbeisser, S.: Bitcoin - An Analysis, 29 Dec 2011,http://www.
youtube.com/watch?v=hlWyTqL1hFA
7. Bitcoin’s block number 0,http://blockexplorer.com/b/0
8. Bitcoin’s block number 180,000,http://blockexplorer.com/b/180000
9. Cormen, T.H., Leiserson, C.H., Rivest, R.L., Stein, C.: Introduction to Algorithms, Second Edition. MIT Press and McGrawHill, 2001. Chapter 21: Data structures for Disjoint Sets, pp. 498-524.
10. Forbes: Top 10 Bitcoin Statistics, http://www.forbes.com/sites/jonmatonis/
2012/07/31/top-10-bitcoin-statistics/
11. Block chain: Bitcoin chartshttp://blockchain.info/charts
432 12/6 17 27/5
Fig. 5.
424 ; 18 23/6
384 18/7
500 16/11
Fig. 9.
10 29/4 10 29/4
85 29/4 200 30/4
125 19/6 125 10/6
10 10/6 135 6/6
10 6/6 145 29/4
430 8/12 50 16/11
40 ; 36 18/7 280 27/5
189 8/5
155 29/4 150 27/1
90 8/11/10
382 19/6 165 29/4
250 27/1 150 27/1
400 27/1
Fig. 2. Fig. 3. Fig. 4. Fig. 6. Fig. 8. Fig. 10. 430 150 90
400 250 85 200
424 500 165 50 50 50 120 transactions
Largest transactions’ flow in the Bitcoin network
10 155 10 145 10 135 10 125 100 MG Fig. X
X d/m
MG
An entity of 1 address with balance of X*1000 BTC’s
Some transactions are sent via the exchange Mt. Gox A sub graph which is expanded below in another Figure
X *1000 BTC‘s were transferred on day d of month m 2011 (unless otherwise specified)
+
+
17
+
432 19/650 25/6 50 19/6
Fig. 7. 50 432 50
+
40 50 5050 11/9
50
18
50 27/8
+
50 27/8 50 27/850 11/9
50 11/9 50 11/9
An address which has received X*1000 BTC’s and has not sent them since
X Y
X Addresses X and Y (+ possibly others) are owned by the same entity
31
36 280
Incoming of many small transactions
432 Q N O P M H F J
Fig. 1. The backbone of the graph of almost all largest transactions in the Bitcoin
90 8/11/10
20 6/11/10 35 6/11/10 30 8/11/10 15 8/11/10
12 8/11/10
7 8/11/10 90 8/11/10
90 35
7 20
55 12
30 45
12
12 17/6 12 15
80 transactions Mostly
generations
15
15 15/6
Fig. 2.A Sub graph of Fig. 1: A trace back of some flows of BTC’s leading to the first
large transaction of 90,000 BTC’s on November 8th2010.
5 10/6 3 2/3
5 2/3
135 1/3 130 2/3
5 2/3 5 1/3
5 1/3 140 1/3
5 1/3 145 1/3
5 1/3 150 27/1
32 130 145
5
22 135 150
27 140
18
23
transactions
5 5 5 5
13 8
5 5
4 4
5 5
3
5 2/3 5 2/3
4 2/3 4 2/3
5 2/3
5 9/6
Fig. 3.A Sub graph of Fig. 1: A long chain of transactions where each address puts
50 11/9
Transactions from this address continue after we have downloaded the network
X
125 19/6
135 19/6
2.5 8/9 2.5 8/9
5 5/8 5 5/8 10 5/8 10 5/8
3 25/4/12 3 25/4/12
4 25/4/12 6 25/4/12
87 8/5/12 91 4/5/12
10 25/4/12 10 31/7
105 1/8 95 25/4/12
4 4/5/12 20 1/8
125 31/7
91 95 135
3 105
125
3 125
10
10 20 10 4
2.5
87
5 10 4 6
5
2.5
4 15
transactions
+
+
Fig. 4.A Sub graph of Fig. 1: A long chain of transactions where each address transfers
most of its BTC’s forward. The rest is distributed in a binary tree-like structure.
1 20/4 89 20/4
90 20/4 90 20/4
90 20/4
95 19/4 95 90
26
10 90
7 5 ...
26
transactions
...
3
transactions
10
5
+
+
89
88
transactions
1
1 20/4 1 20/4 1 20/4
90 20/4
MG MG
Fig. 5. A Sub graph of Fig. 1: An entity is sending 90,000 BTC’s to itself in a self
189 8/5 280 27/5 17 27/5 5 14/5
5 16/5 5 16/5 5 16/5
200 13/5
5 14/5
20 23/5
19 23/5
100 22/5 80 23/5
230 14/5 235 14/5
240 14/5
172 13/5
20 200 100 3 transactions 50 20 230 235 240 300 300 80
5 5 5
19
5 14/5 5 14/5
300 14/5
50 21/5
200 22/5
100 22/5 100 22/5
100 22/5 20 23/5
20 5
5 + 5
5 5 225 245 200 172 189 ... + + +
250 14/5
20 18/5
225 14/5
25 14/5 25
250 5 16/5
245 14/5
Fig. 6. A Sub graph of Fig. 1: Large amounts of BTC’s are transferred from one
address to another by sending parts of it to intermediate addresses, which are then being merged into the same destination.
7 18/7 50 25/6
26/6 18/7
25/6
25/6 44 26 15
50 34 100 transactions 7 5
5 18/7
... ... 122 transactions ... 120 transactions ... 100 transactions
Fig. 7.A Sub graph of Fig. 1: Large amounts of BTC’s are rapidly transferred in a
424 23/6 18 23/6
32 19/6 82 19/6
232 19/6 182 19/6 132 19/6
282 19/6 332 19/6
382 19/6
132
82 282
32 332
50
182 382
50 232
50 50 50 50
50 50 42
50 19/6
50 19/6 50 19/6 50 19/6
50 19/6 50 19/6
50 19/6
50 19/6
+ 4
+
50 19/6
5
Fig. 8.A Sub graph of Fig. 1: A very large amount of BTC’s is transferred by splitting
it into equal amounts each directed to a different address belonging to the same entity, then most of the accumulated sums are transferred to a single receiver.
284 27/8 300 27/8
40 16/11 50 11/9
50 27/8
100 27/8 150 27/8
250 27/8 200 27/8
334 27/8 384 27/8
200
150 284
334
50
250 384
50 300
100
50 50
50 50
50 11/9
50
50 50
50 50
50
50 27/8 50 27/8 50 27/8
50 27/8
50 27/8
50 27/8
50 11/9 50 11/9 50 11/9
50 11/9
50 11/9
50 50
50 27/8
+
40
100
50 11/9
Fig. 9.A Sub graph of Fig. 1: A similar scenario as described in Fig. 8 but with more
430 8/12
203 227
94 109
430
227 8/12 203 8/12
42 101
126
59 53 48 64 45 52
66
126 8/12 101 8/12 109 8/12 94 8/12
39 8/12
66 8/12 53 8/12 48 8/12 64 9/12 45 9/12 52 8/12 42 8/12
38 28 34 25 31 22 27 21 34 30 24 21 26 26 17 25
25 8/12 17 8/12 16 8/12 16 8/12 34
9/12 30 9/12
24 9/12
21 9/12 31
8/12 22 8/12
27 8/12
21 8/12 38
8/12
34 8/12
25 8/12 28
8/12
MG
Fig. 10. A Sub graph of Fig. 1: The largest amount of transferred BTC’s is finally