ABSTRACT
WILSON, MELODY TYLER. Using the Technological Pedagogical Content Knowledge (TPCK) Framework to Explore Teachers’ Perceptions of the Role of Technology in the Implementation of mCLASS®: Reading 3D. (Under the direction of Dr. Lance Fusarelli.)
This qualitative study considers the perceptions of teachers from one rural county in North Carolina who implemented the program implementation of mCLASS ®: Reading 3D. Reading 3D is an electronic early literacy assessment that is designed to assist teachers in planning appropriate literacy instruction based on student needs by offering immediate access to individual student data.
This study sought to provide perspectives about which aspects of technology are occurring in schools and the degree to which actual practices resemble North Carolina’s intended delivery of the Reading 3D program. The primary framework that was used to understand the teachers’ perceptions was the Technological Pedagogical Content Knowledge (TPCK) Framework. The purpose of TPCK is to recognize the information that is needed for teachers to be able to properly integrate technology into their teaching.
The findings were acquired by surveying 26 teachers, reviewing online documents, and interviewing eight participants through stratified random sampling.
professional development plans, solicit teacher input on county-wide standards, and acquire updated technology for a positive implementation climate.
The theoretical implications included closer monitoring of all programs, connection of program to improved student achievement as well as offering appropriate training that supports new technology. There are also implications for future research including investigating the reliability of the assessments before using this assessment as its main support to guiding instruction, adding to the participant pull - including the principals and other staff members, and examining the impact that this program is having on student achievement.
Using the Technological Pedagogical Content Knowledge (TPCK) Framework to Explore Teachers’ Perceptions of the Role of Technology in the
Implementation of mCLASS®: Reading 3D
by
Melody Tyler Wilson
A dissertation submitted to the Graduate Faculty of North Carolina State University
in partial fulfillment of the requirements for the degree of
Doctor of Education
Educational Administration and Supervision
Raleigh, North Carolina
2012
APPROVED BY:
_____________________________ ________________________ Lance D. Fusarelli, Ph. D. Kenneth H. Brinson, Jnr., Ph. D. Chair of Advisory Committee
DEDICATION
BIOGRAPHY
Melody Tyler Wilson was born on August 8th in Hagerstown, Maryland where she lived with her parents, three brothers, and three sisters. While growing up, her family traveled around the country with their missionary father and mother.
In 2000, she graduated with her Bachelor of Science in Elementary Education from Shippensburg University in Pennsylvania. Once receiving her teaching license, she moved to North Carolina and received her Master of School Administration from North Carolina State University. Since moving to North Carolina, she has been a teacher, assistant principal, and is currently serving children as a principal of an elementary school. She is nationally board certified in literacy and has a passion for building a respectful learning environment in which children can excel.
ACKNOWLEDGEMENTS
I would like to thank my colleague and dear friend, Jennifer Carraway, who walked through every step of this process with me and never let me give up. I couldn’t have accomplished this without you and I will forever be grateful to you for your encouragement and support.
I would also like to acknowledge my deep gratitude for my dissertation chair, Dr. Lance Fusarelli, along with my committee: Dr. Steven Amendum, Dr. Ken Brinson, and Dr. Bonnie Fusarelli. Thank you all for your guidance, encouragement, and feedback during this exciting process. You always made me feel like my ideas were valued and appreciated.
TABLE OF CONTENTS
List of Tables ……… v
Chapter 1 Introduction ………. 1
Program Implementation ……….. 4
Purpose of the Study ………. 6
Significance of the Study ……….. 6
Brief Overview of Methodology ……….. 8
Conceptual Framework ……… 8
Definition of Terms ………. 9
Chapter Summary………..……….………….. 12
Chapter 2 Review of Literature……… 13
Conceptual Framework ……… 13
Implementation Research ……… 16
Perceptual Research ……… 22
Early Literacy………... 25
DIBELS………... 29
Text, Reading and Comprehension ……… 31
Using Technology in Early Literacy Assessments ……….. 33
Chapter Summary ………... 39
Chapter 3 Methodology ……….. 40
Research Questions ……….. 42
Participant Selection………. 43
Data Collection ……….... 46
Data Analysis ……….. 53
Validity and Reliability………. 55
Subjectivity Statement ………. 55
Ethical Considerations ………. 58
Limitations of the Study………... 59
Chapter Summary ……….... 62
Chapter 4 Findings ……… 63
Key Findings ……… 63
Technological Pedagogical Content Knowledge ………. 72
Implementation Overview ……… 90
Chapter Summary ……… 95
Chapter 5 Discussion ……… 96
Review of Purpose ……… 96
Summary of Key Findings ……… 97
Implications ……….106
Implications for Future Research ……… 111
Limitations ………. 113
Chapter Summary ……… 116
References ………... 118
Appendices ………. 131
Appendix A. Composite Score ………... 132
Appendix B. Survey Protocol ……… 133
Appendix C. Sample Online Documentation……...……… 137
Appendix D. Interview Protocol……….. 139
Appendix E. Initial Participant IRB………. 140
Appendix F. Sample Home School Connection Report ……….. 142
Appendix G. Sample Small Group Advisor Report ……… 144
LIST OF TABLES
Table 1 The Elements of Beginning Reading ……… 29
Table 2 DIBELS components of mCLASS ®: Reading 3D ………. 31
Table 3 Site Information ………..….… 45
Table 4 Participant Selection ……….... 46
Table 5 Description from Survey Participants ………. 49
Table 6 Description of Interview Participants ……….. 52
LIST OF FIGURES
Chapter 1 Introduction
One of the schools’ most original responsibilities was to teach children how to read. Researchers (Fletcher & Lyon, 1998) estimated that 95 percent of all children could learn how to read. Yet in 2009, only 61 percent of the students in North Carolina were considered proficient on the Reading End of Grade (EOG) Assessments in Grades 3-5 (NCDPI, 2010). In a white paper, Honey (2007) explained, “Despite evidence that formative assessment in the early years allows educators to identify student needs, enabling them to help students build skills and increase proficiency, few districts and states have any sort of systemic formative program for K-2” (p. 5).
Early literacy intervention is a widely discussed educational concern. There is
varying research on the top five elements of reading. Some research stated that there are five core components of effective reading instruction; phonics, phonemic awareness, fluency, comprehension, and vocabulary (NICHD, 2000). Other research identified the big ideas of beginning reading as phonemic awareness, alphabetic principle, accuracy and fluency, comprehension, and vocabulary (Barone, Mallette, & Xu, 2005; Reading Resource, 2011). Although it is widely recognized that there are essential components in early literacy, North Carolina continues to struggle to improve the literacy of it’s children.
this program was to improve student achievement in early literacy. There were 47 schools involved in this Diagnostic Reading Assessment Pilot (DRAP) program that utilized mCLASS®: Reading 3D (Reading 3D). In August of 2010, the final evaluation report was presented to the North Carolina General Assembly. Based on the positive results of the report, additional school districts were selected to participate in the implementation of Reading 3D. Due to budget constraints, a limited number of schools were selected to participate in this program at the state’s expense. Schools were selected based on EOG data from 2009-10 and the state mandated that every school with a composite score of 55.9% or below would participate in Reading 3D. Each year, the state determines each school’s composite score by computing the percent of students who scored at or above Achievement Level III on reading and mathematics EOG tests, the North Carolina Alternate Assessment Portfolio, and the North Carolina Alternate Assessment Academic Inventory (NCAAAI). See Appendix A for a detailed explanation of composite score.
In 2010-11, 47 pilot schools, joined by 78 former Reading First schools and 75 low performing schools, participated in Cohort I; 236 were selected from applications for Cohort II; and 67 more were selected for Cohort III. In this year of implementation, a total of 483 schools or 36 percent of the elementary schools in North Carolina participated in the implementation of Reading 3D (wirelessgeneration.com, 2010).
Reading 3D as the diagnostic assessment for reading in elementary grades as part of a state-wide initiative. This diagnostic assessment aims to:
• Enable teachers to determine student-learning needs and individualize instruction.
• Ensure that students are adequately prepared for the next level of coursework as set out by the Standard Course of Study.
• Save time by using technology to accurately record information. • Facilitate more frequent formative assessment for struggling students. • Make it possible to provide interventions for students in a timely manner.
(wirelessgeneration.com, 2010)
Wireless Generation assists educators in this assessment process by offering mCLASS®: Reading 3D on a handheld type of technological device. In an effort to guide instruction, Reading 3D instantly provides differentiated lessons and web-based reporting.
learn how to alter programs by moving beyond simply evaluating a program. Pressman & Wildavsky (1984) went on to explain that, “By expanding the task of evaluation beyond the mere measurement of outcomes to their causes, we can obtain knowledge that can be used to alter programs and/or their modes of implementation” (p. xv). In order to evaluate the outcomes of this program, it is essential to understand the implementation of this program.
Program Implementation
McNamara (2007) explained, “The assessment of reading comprehension is a critical part of designing and implementing programs that teach reading strategies” (p. 107). In an attempt to improve student achievement in reading, new programs continue to be
implemented in education. Patton (2002) believed, “unless one knows that a program is operating according to design, there may be little reason to expect it to produce the desired outcomes” (p. 161). Therefore, there is a need to reflect on the impact that programs have on student achievement. When evaluating program implementation, the evaluator should assess whether the program is reaching the appropriate population or if its service delivery is consistent with program expectations (Preuss, 2007; Rossi, Lipsey, & Freeman, 2004). This study obtained data from one rural North Carolina county that has implemented Reading 3D in their elementary schools.
implementation of Reading 3D. The state offered open enrollment participation through an application process and two more schools in this county were selected to participate in Reading 3D. These four schools selected for data collection in this qualitative study. This study focused on the teachers’ perceptions of the implementation of this technology-based early literacy assessment program.
People use different types of technology repeatedly throughout their day. Yet the educational institutions charged with preparing youth for productive lives are farther behind in integrating technology than any other institution in American society (Guthrie, 2003). Although many schools have been permeated with technology (Molebash & Fisher, 2003), many teachers have resisted technology, viewing it merely as an additional task or burden to learn. Technology has the potential for making remarkable changes in pedagogy and student learning; however, classroom use has lagged (Guthrie, 2003). To further complicate matters, emergent technology may be leading to a redefinition of literacy, as societal demands and a borderless world await students, and instruction in classrooms struggle to meet those demands (Leu, Kinzer, Coiro, & Cammack, 2004).
two worlds. Instead of this dual challenge, educators should view this technology as a way to assist pedagogy by providing an easier way to collect and analyze reading assessment data.
Purpose of the Study
The purpose of this study was to understand how teachers perceive the program implementation and the role of technology in the reading assessment program called mCLASS: Reading 3D.
The following research questions will guide this qualitative perceptual study: 1. What are the teachers’ perceptions of the implementation of the Reading 3D program?
2. For teachers implementing Reading 3D in grades K-3, what are their perceptions regarding the implementation process of Reading 3D as it relates to the role of technology?
The results revealed the perspectives from teachers about how technology impacted the implementation of Reading 3D. Knowing the extent to which technology in Reading 3D is implemented will allow us to better understand which program characteristics are
contributing to the desired outcomes. Furthermore, the results may reveal some unrealistic sections of the program, and thus provide information to Wireless Generation about how to improve this technology-based diagnostic reading assessment program.
Significance of the Study
Literacy expectations, too, have advanced from the basic paper and pencil assignments to publishing with technology (Clay, 2001; Coiro, Knobel, Lankshear, & Leu, 2008; Leu et al., 2004). The AACTE Committee (2008) commented, “Literacy will constantly be redefined as new technologies emerge and as expectations change for what it means to be literate” (p. 63). Herrington, Hodgson, and Moran (2009) predicted that, “by 2011, it would be hard to argue for the validity of an assessment in writing that did not provide for digital composing” (p. vii). Therefore, this study may be considered cutting edge and could be used to help further investigate literacy initiatives in the future.
The state of North Carolina as well as school districts and individual campuses have invested significant amounts of money in technology. Last year alone, North Carolina allocated 34.6 million dollars from Race to the Top funds for technology infrastructure in education (NCDPI, 2011). These technology allotments have stayed consistent despite a state budget crisis and cuts to other areas of the budget. In the county of study, Board Policy Code: 3220 - Technology in the Educational Program stated, “The board strives to
incorporate the use of technology in the educational program in order to enhance
instructional opportunities, appeal to different learning styles and meet the educational goals of the board”. It is significant to understand the perceptions that teachers have on the impact that this technology has on student achievement.
This study may also contribute to the research literature by building on the broader influences of technology-based literacy assessments. Teacher perceptions on the
program. The findings of this perceptual study may inform other research regarding the impact that technology has on literacy.
Brief Overview of Methodology
Merriam (1998) affirmed, “The qualitative, interpretive, or naturalistic research paradigm defines the methods and techniques most suitable for collecting and analyzing data” (p. 1). Qualitative research is suited for promoting a deep understanding of a social setting or activity as viewed from the perspective of the research participants. This approach implies an emphasis on exploration, discovery, and description (Bloomberg & Volpe, 2008). A qualitative perceptual study is an appropriate method to study teachers’ perceptions of program implementation in a small sample of schools.
Conceptual Framework
Through this research design, I considered many conceptual frameworks on which to base this study. When analyzing behavior change theory, it was realized that this would not align with the purpose of the study because this study is not measuring the change in
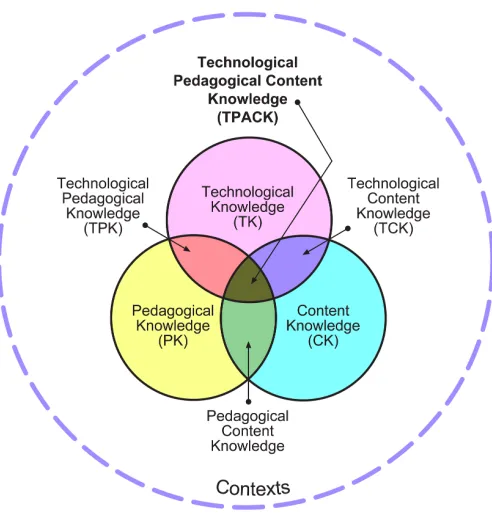
TPCK is a framework for teacher knowledge in technology integration. It builds on Shulman's (1986) construct of pedagogical content knowledge (PCK) to include technology knowledge. The TPCK framework is a complex interaction among three bodies of
knowledge: Content, Pedagogy, and Technology (see Figure 1 on page 14). Through this lens, I sought to understand teachers’ perceptions on the impact that technology in Reading 3D has had on classroom implementation.
The AACTE committee (2008) described this complex interaction “as most evident whenever a new educational technology suddenly forces teachers to confront basic
educational issues and reconstruct the dynamic equilibrium among all three elements” (p. 18). The Reading 3D program requires a handheld form of technology to assess students. Whether teachers were ready for this change or not, they were forced to confront this issue and analyze their perspectives on early literacy assessments.
Definition of Terms
Formative assessments use observational or diagnostic measures to provide detailed information about a student’s progress. Formative assessments provide teachers with
frequent data regarding the growth and development of students. The purpose of this data is to allow teachers to plan appropriate differentiated small group instruction that will meet the needs of each student. Collecting data for formative types of assessment can be done in a variety of ways. According to Wang (2008), “Formative assessments play an important role in both the traditional learning environment and the e-Learning environment” (p. 1249). Traditionally, this has been a paper-pencil type of data collection. However, wireless generation offers a way to collect this data electronically, which speeds up the delivery of that data analysis for each child. For this study, formative assessment, also called progress monitoring is defined as, “a probe used between benchmarks to target specific content areas for remediation” (Reaves & Sullivan, 2010, p. 38).
The PlaidLet is a mini laptop computer made by DakTech. It has a touch screen and is used to collect data during benchmarking and progress monitoring. When the teacher is not collecting this anecdotal data, the PlaidLet could be used as a regular mini laptop computer in the classroom. As a result, the PlaidLet is used to collect the data, as well as provide “access to results immediately following assessments” (Reaves & Berger, 2010, p. 28).
Literacy is hard to define and ever changing. It is a shifting target that will continue to change over time. What it meant to be literate a few decades ago no longer holds true today. Past definitions used included learning to read and sounding out words from traditional texts (AACTE, 2008). For the purpose of this study, literacy will be used as a broader term. In order to be literate in the 21st century, students must be able to successfully collaborate and communicate through various types of media. Literacy teachers will be expected to change with new technologies and be able to support a variety of resources in order to meet the needs of young aspiring readers (Clay, 2001). This means that teachers will also need to creatively consider how to best connect technology with research-based literacy practices, which will be assisted in understanding through the TPCK model.
Chapter Summary
Preuss (2007) believed that perceptive data is often ignored in data driven decision-making because of the time that it takes to collect. However, its impact is as powerful as any other type of data in the analysis process. The purpose of this perceptual study is to
understand how teachers perceive the role of technology in the implementation of
mCLASS®: Reading 3D. This chapter has provided the background of the problem as well as the role of technology in education. In addition, the conceptual framework to guide this study was presented.
Chapter 2 Review of Literature
In chapter one, it was stated that the purpose of this study was to understand how teachers perceive program implementation and the role of technology in the reading assessment program called mCLASS: Reading 3D.
The literature reviewed throughout this chapter will begin with the conceptual framework that was used to analyze the data that was collected throughout this study; technological pedagogical content knowledge (TPCK). In addition to this framework, the literature discussed in this chapter will include implementation studies, perceptual behavior, and early literacy. I will also identify common themes throughout the literature about the use of technology in early literacy assessments.
Conceptual Framework
Figure 1 – TPCK Conceptual Model
The AACTE (2008) believed, “While the acquisition of content knowledge and pedagogical knowledge are critically important to the preparation of K-6 literacy teachers, the knowledge of how, when and why to use technology effectively in teaching literacy seems just as relevant for today’s teachers” (p. 61). In order to fully understand this framework, it is essential to know that each component is equally important as well as the interactions among the following categories: pedagogical content knowledge (PCK), technological content knowledge (TCK), technological pedagogical knowledge (TPK), and technological pedagogical content knowledge (TPCK).
curriculum, assessment, and reporting, such as the conditions that promote learning and the links among curriculum, assessment, and pedagogy” (p. 14). PCK offers the flexibility in pedagogical decision making in order to educate children in a way that will most impact them. PCK transforms subject matter into appropriate teaching strategies that students can relate to, understand, learn, and retain.
Technological content knowledge is “an understanding of the manner in which technology and content influence and constrain one another” (AACTE, 2008, p. 26). Within this study, this is an important component because the purpose of this study is to see how the teachers’ perceive the use of technology and how it has impacted the use of their new
assessment program.
The full TPCK model will be used in this study because it goes beyond the previous three components. TPCK is an understanding that develops from using all of the content, pedagogy, and technology components. This is different than just having knowledge of the components individually (AACTE, 2008). This model allowed me to deeply analyze the data to get a deeper understanding of the perceptions of teachers.
existing knowledge and to develop new epistemologies or strengthen old ones. (AACTE, 2008, p. 17)
Therefore, teachers’ perceptions of how students learn were an important finding in this study. The TPCK model also helped to understand the teachers’ perspective and make sense of the data collected.
The AACTE (2008) explained, “When technology is added to the educational
environment, teachers must consider (1) how technology can be applied to enhance learning, (2) how use of technology change what is learned, and (3) how technology can be used to enrich the evidence of student learning” (p. 245). It is through this lens that I sought to understand teachers’ perceptions of the impact that technology in Reading 3D has had on classroom implementation. These teachers work in a social context; they were raised to understand their profession in a social context; and the goal was to explore and share how a state imposed program such as Reading 3D was impacted by that context.
Implementation Research
Educators constantly search for ways to improve instruction and to make the environment better for students. Grammatikopoulos, Tsigillis, and Koustelios (2007) believed a “programme’s effectiveness is highly influenced from the programme
and Sorra (1996), are considered effective depending on the uniformity and quality of the use of a specific program within the entire organization. Of course, “it is not enough simply to ‘implement’; one must choose the right implementation plan. But then, by the same logic, one must know the right way to implement the implementation plan” (Pressman &
Wildavsky, 1984, p. 166).
Purpose of Implementation Studies
Many researchers agreed that educators should not assume that just because a program is adopted, it would be implemented as intended (Desimone, 2002; Klein & Sorra, 1996; Mills, et al., 2000). Educators adopt programs and without further research, assume that it will yield positive results. Klein and Sorra (1996) echoed, “implementation is the critical gateway between the decision to adopt the innovation and the routine use of the innovation within an organization” (p. 1057). In order to yield expected results,
implementers must ensure that the program has been implemented with fidelity. Fidelity of implementation is described as the comparison between the programs as intended with its actual use (Mills & Ragan, 2000).
Patton (2002) believed, “it is important to know the extent to which a program is effective after it is fully implemented, but to answer that question it is important to learn the extent to which the program was actually implemented” (p. 161). Most often, studying the implementation of educational programs offers valuable information regarding the influence of programs. In a program, “the implementation part is where the real action occurs”
can also provide valuable information about the targeted population, program activities, and the overall validity and success of the program.
Educators often adopt programs and are disappointed with the results and assume the program was flawed. However, it may simply be the implementation process that was flawed. Pressman and Wildavsky (1984) believed that “implementation and evaluation are the opposite sides of the same coin, implementation providing the experience that evaluation interrogates and evaluation providing the intelligence to make sense out of what is
happening” (p. xv). Organizations often find that the reason for inability to achieve results is dependent upon implementation of the program rather than the innovation of the program (Klein & Sorra, 1996). There are three possible established benchmarks that reflect implementation of a program; partial, moderate, and full (Desimone, 2002). Many studies use benchmarks to set targets for successful implementation. Some implementation studies established their own empirical benchmarks (Berends, 2000). Desimone (2002) believed that an effective implementation was not always a defined standard. However, he went on to share that researchers have given full implementation a meaningful definition. These established benchmarks give researchers more details about whether the program was implemented with fidelity or with failure.
Implementation Failure
failure, it is essential for an organization to understand the delicacies of implementation studies; too much or too little focus on implementation can cause implementation failure.
Researchers cautioned that once implementation is started, failure to monitor and describe the process could result in useless results (Patton, 2002; Preuss, 2007). In addition, failure to monitor the program will enable teachers to implement with convenience rather than fidelity.
Spillane, Resier, and Reimer (2002) also believed, “some explanations for
implementation failure focus on the inability of principals to formulate clear policy outcomes or to adequately supervise the implementation of their goals” (p. 390). Therefore, principals must have a clear plan on how to prepare for the monitoring of the implementation. Even with a clear plan, principals must be careful to follow it. Often times, managerial types of duties threaten to interrupt the original plan of implementation. Preuss (2007) suggested that, “if there is a staff member or program in need of immediate assistance, run and provide the necessary assistance. But then learn from the experience and reflect upon its cause and seek to remove its roots in order to eliminate or reduce the possibility of its happening again” (p. 11).
Although it is essential to focus on implementation, too strong of a focus appears to restrict teacher autonomy and could easily have a negative impact inside schools. Negative results could include decreased motivation and professionalism among teachers and
Therefore, it is essential to create just the right climate for appropriate program implementation.
Implementation Climate
Klein and Sorra (1996) believed that the stronger an organization’s implementation climate, the more likely the program will experience success. Therefore, examining the organization’s climate before program implementation and then supporting these needs is a way to prepare for program success. Klein & Sorra (1996) described a solid implementation climate as one that “fosters innovation use by (a) ensuring employee skill in innovation use, (b) providing incentives for innovation use and disincentives for innovation avoidance, and (c) removing obstacles to innovation use” (p. 1060). In order to ensure employee skill, the organization must be proactive in numerous ways. Appropriate professional development should be provided to all stakeholders and any barriers that exist should be removed before the implementation begins.
Implementation Evaluation
Educators must implement the right program to improve student achievement. Pressman and Wildavsky (1984) believed that “evaluation must also allow future implementation process to learn from errors” (p. 182). When evaluating program implementation, the implementer should assess whether the program is serving the
appropriate population or if its service delivery is consistent with the program’s expectations (Rossi, Lipsey, & Freeman, 2004). To increase the validation of implementation studies, the Evaluation Scale of Educational Programme Implementation (ESEPI) was developed with six factors: training, educational material, administration, facilities, relationships, and
educational procedure (Grammatikopoulos et al., 2005). The purpose of this instrument is to validate and enhance the effectiveness and accountability of program evaluation.
Gathering descriptive information about a program is another way to evaluate program implementation. According to Patton (2002), this information could include, “inputs, activities, processes, and structures” (p. 161). Although deviations from program protocol are common, it is important to understand why these adjustments have been made and what impact these deviations have had on program outcomes. Pressman & Wildavasky (1984) believed that, “In order for evaluation to be effective in its expanding domain—to be of use during implementation—it must be aimed at generating data that can be used to improve the implementation process” (p. 182).
decision-making or improved schooling are relatively rare” (Fusarelli, 2008, p. 180).
Although this could be considered disastrous, Lipsky (2010) explained the reasoning behind this problem by stating,
Not only is reliable information costly and difficult to obtain but for street-level bureaucrats high case loads, episodic encounters, and the constant press of decisions force them to act without even being able to consider whether an investment in searching for more information would be profitable. (p. 29)
Researchers credit the lack of research in decision making to other varying factors, including; the lack of resources, high case loads, managerial duties, overwhelming paperwork and the need to make hasty decisions (Fusarelli, 2008; Lipsky, 2010).
“Decision-making and program adoption in education is shaped by and often determined by ease of use, good marketing, lack of threat to current practice, … rather than research-based evidence of program effectiveness” (Fusarelli, 2008, p. 185). As a result of the educators’ seemingly limited regard to research, it is important to also explore the perceptions of teachers to report to administrators who are implementing this program in the future.
Perceptual Research
perceptual traditions and behaviors based on perceptions. Secondary to the TPCK framework, these elements of perception will add to the understanding of this study. Perceptual Tradition
The perceptual tradition tries to understand human behavior through the eyes of the individual. According to Purkey (1996), this tradition also tried to, “explain why people do the things they do by postulating that human behavior is determined by, and pertinent to, the phenomenal field of the experiencing person at the moment of acting” (p. 21). Actions are based on how an individual perceives the world at that very moment.
Purkey and Schmidt (1987) outlined 14 basic assumptions of the perceptual tradition: 1. There may be a preexistent reality, but an individual can only know that part which
comprises his or her perceptual world, the world of awareness.
2. Perceptions at any given moment exist at countless levels of awareness, from the vaguest to the sharpest.
3. Because people are limited in what they can perceive, they are highly selective in what they choose to perceive.
4. All experiences are phenomenal in character: The fact that two individuals share the same physical environment does not mean that they will have the same experiences. 5. What individuals choose to perceive is determined by past experiences as mediated by
present purposes, perceptions, and expectations.
7. Choices are determined by perceptions, not facts. How a person behaves is a function of his or her perceptual field at the moment of acting.
8. No perception can ever be fully shared or totally communicated because it is embedded in the life of the individual.
9. ‘Phenomenal absolutism’ means that people tend to assume that other observers perceive as they do. If others perceive differently, it is often thought to be because others are mistaken or because they lie.
10. The perceptual field, including the perceived self, is internally organized and personally meaningful. When this organization and meaning are threatened, emotional problems are likely to result.
11. Communication depends on the process of acquiring greater mutual understanding of one another’s phenomenal fields.
12. People not only perceive the world of the present but they also reflect on past experiences and imagine future ones to guide their behavior.
13. Beliefs can and do create their own social reality. People respond with feelings not to reality’ but to their perceptions of reality.
14. Reality can exist for an individual only when he or she is conscious of it and has some relationship with it. (p. 30)
Behavior Based on Perceptions
Perception is a primary component in human behavior (Purkey and Schmidt, 1987) and people act according to their personal reality (Rogers, 1952).
Perceptions serve as a reference point for behavior. They influence the memories people use to understand the present and anticipate the future. In addition,
perceptions affect the possibilities that people can imagine and the goals that they are willing to work for. Thus, any change in perceptions alters one’s view of the past, present, future, and the imaginable. (Purkey & Novak, 1996, p. 23)
Perceptions affect how people understand and react to situations. Perceptions determine behaviors. Johnson (2004) believed that perception was related to, “a person’s cognitive ability to, among other things, reason, form concepts, and solve problems” (p. 42). This study sought to understand teachers’ perceptions with regard to the implementation of mCLASS®: Reading 3D.
Early Literacy
There is extensive research on literacy development in young children (e.g. Clay, 2001;
IRA & NAEYC, 1998; National Research Council, 1998; Neuman & Dickinson, 2001;
Shanahan, 2003; Yaden, Rowe, & MacGillivary 1999). The National Reading Panel (2000)
was assembled to bring clarity to many research-based studies on reading instruction.
However, instead of solving some of these issues, many remain unresolved. Described
below are some of these elements of early literacy that are needed for success in beginning
Elements of Beginning Reading
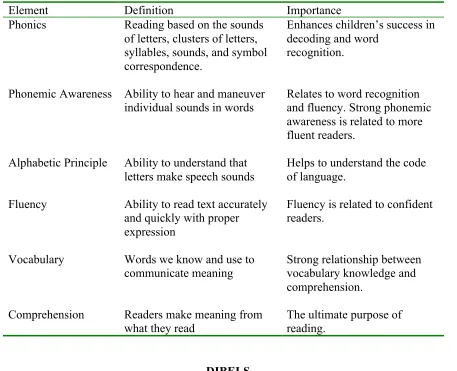
After a synthesis of scientifically based research studies, the National Reading Panel (NRP) concluded that the five core elements of effective reading instruction are phonics, phonemic awareness, fluency, comprehension, and vocabulary (National Institute of Child Health and Human Development - NICHD, 2000). This varied slightly from research studies that determined the big ideas of reading in early literacy as phonemic awareness, alphabetic principle, accuracy and fluency, comprehension, and vocabulary (Barone et al., 2005; National Research Council, 1998; Reading Resource, 2011; Sadao & Robinson, 2010). See Table 1 on page 27.
Phonics. Phonics is a reading approach that is based on the sounds of letters, clusters of letters, and syllables. Hammill and Swanson (2006) described the goal of phonics as teaching, “children to read and pronounce words by learning the phonetic value of letters and groups of letters” (p. 17). Although, the National Reading Panel (NRP) concluded that “systematic phonics instruction enhances children’s success in learning to read and … is significantly more effective than instruction that teaches little or no phonics” (National Reading Panel, 2000, p. 9), there are other critics that have an alternative interpretation of the impact of phonics instruction (Garan, 2002; Yatvin, 2000).
by Fitzgerald, Amendum, and Guthrie (2008) confirmed that phonological awareness is a critical skill for learning how to read.
Alphabetic principle. Alphabetic principle is when a child understands that letters represent speech sounds. This is often a difficult system to learn because of the number of sounds and letters that can be interchangeable. Many researchers (Barone et al., 2005; National Research Council, 1998; Reading Resource, 2011; Sadao & Robinson, 2010) believed that Alphabetic Principle is a big idea in early reading; however some studies emphasize this topic more than others. For example, in the NRP (2000) report, alphabetic principle was defined within sections of phonemic awareness and phonics instead of as a separate element. Hammill and Swanson (2006) believed that, “lessons in phonics usually are carefully structured, highly sequenced, and firmly fixed on the alphabetic principle” (p. 17). The better children understand that more than one letter can represent a sound, the more automaticity they will develop.
Fluency. Fluency is the ability to read text accurately and quickly and with
appropriate expression or prosody. Fluent readers read as if they were speaking (Samuels & Farstrup, 2006). The NRP (2000) defined fluency as speed, accuracy, and appropriate expression. They also reported that fluency is a critical part for competent readers. Some researchers said that in order to increase fluency, a child can engage in repeated reading. However, a study conducted by Hiebert and Fisher (2005) argued that there was no
Vocabulary. Vocabulary refers to the words we know, understand, and use to communicate. Most researchers agree, the more words a reader can identify with correct meaning, the easier it will be for a student to read and understand what they read (Barone et al., 2005; McNamara, 2007; National Reading Panel, 2000; National Research Council, 1998; Reading Resource, 2011; Sadao & Robinson, 2010). There are two types of vocabularies: “receptive vocabulary is the vocabulary that we can understand when it is presented to us in text or as we listen to other speak, while productive vocabulary is that vocabulary we use in writing or when speaking others” (National Reading Panel, 2000, pp. 4-15). Within this study, receptive vocabulary is generally what is referred to when using the term vocabulary, but productive vocabulary also comes into this study in the writing
component of this program.
Comprehension. Reading comprehension is the ultimate purpose for reading. McNamara’s (2007) research stated, “reading comprehension is a product of complex interactions between the properties of the text and what readers bring to the reading
Table 1
The Elements of Beginning Reading
Element Definition Importance
Phonics
Phonemic Awareness
Reading based on the sounds of letters, clusters of letters, syllables, sounds, and symbol correspondence.
Ability to hear and maneuver individual sounds in words
Enhances children’s success in decoding and word
recognition.
Relates to word recognition and fluency. Strong phonemic awareness is related to more fluent readers.
Alphabetic Principle Ability to understand that letters make speech sounds
Helps to understand the code of language.
Fluency Ability to read text accurately and quickly with proper expression
Fluency is related to confident readers.
Vocabulary Words we know and use to
communicate meaning Strong relationship between vocabulary knowledge and comprehension.
Comprehension Readers make meaning from
what they read The ultimate purpose of reading.
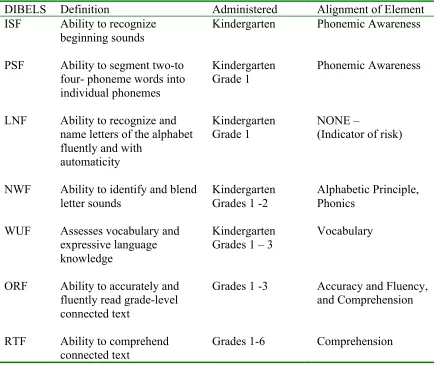
DIBELS
Researchers at the University of Oregon developed DIBELS. Manzo (2005)
measures for assessing early literacy skills from kindergarten through sixth grade. They are intended to be short assessments that are administered regularly to observe the growth of early literacy skills (Center on Teaching and Learning, 2011). See Table 2 on the following page.
DIBELS assessments are used across the country because of federal support for the program. There have been debates on the legitimacy of DIBELS as an accurate indicator of risk and planning tool for educators. Manzo (2005) explained that DIBELS is a good assessment tool, but it does not give teachers clear answers for planning differentiated instruction. DIBELS may assess students at a level in which they cannot yet read the selections; therefore these assessments demonstrate floor effects (Fuchs, Fuchs, Hamlett, Walz, & Germann, 1993; Groce, 2009). Other researchers argued against the reliability of DIBELS assessments (Goffreda, Diperna, & Pedersen, 2009; Goodman et al., 2006; Hintze, Ryan, & Stoner, 2003; Nelson, 2008; Pressley, 2006; Roehrig, Yaacov, Nettles, Hudson, & Torgesen, 2006; Samuels, 2007). There has also been a call for more studies of DIBELS by researchers not connected to the assessments (Ardoin & Christ, 2009; Hintze et al., 2003).
aligns with the elements in beginning reading. Although LNF does not directly align with one of the elements in beginning reading, it is documented as an accurate predictor of risk.
Table 2
DIBELS component of mCLASS®: Reading 3D
DIBELS Definition Administered Alignment of Element ISF Ability to recognize
beginning sounds
Kindergarten Phonemic Awareness
PSF Ability to segment two-to four- phoneme words into individual phonemes
Kindergarten
Grade 1 Phonemic Awareness
LNF Ability to recognize and name letters of the alphabet fluently and with
automaticity
Kindergarten Grade 1
NONE –
(Indicator of risk)
NWF Ability to identify and blend letter sounds
Kindergarten Grades 1 -2
Alphabetic Principle, Phonics
WUF Assesses vocabulary and expressive language knowledge
Kindergarten
Grades 1 – 3 Vocabulary
ORF Ability to accurately and fluently read grade-level connected text
Grades 1 -3 Accuracy and Fluency, and Comprehension
RTF Ability to comprehend
connected text Grades 1-6 Comprehension
Text, Reading, and Comprehension (TRC)
text level assessment called Text, Reading, and Comprehension (TRC). TRC assessments also parallel the concepts in accuracy and fluency, comprehension, and vocabulary. Many researchers suggest that oral reading fluency has a strong relationship with students’ overall reading competence (Fuchs et al., 2001; Glasgow & Farrell, 2007; McGlinchey & Hixson, 2004; Sadao & Robinson, 2010).
McNamara (2007) showed in her research that “one must diagnose an individual reader’s deficits, because there are multiple reasons why a student may struggle to read” (p. 115). Wireless Generation (2008) assists educators in this assessment process by offering mCLASS®: Reading 3D on an electronic device. This program instantly provides effective differentiated reading lessons and web-based reporting. “Reading lessons provide a social context in which teachers and students meet and closely interact” (Amendum, Li, Hall, Fitzgerald, Creamer, Head-Reeves, & Hollingsworth, 2009, p. 120).
These assessments are meant to adapt teaching and are the preferred assessment for guiding instruction.
Using Technology in Early Literacy Assessments
Trunacle (2010) explained, “The fast pace of technological change has caused us to reevaluate how we educate students to meet the needs of the changed workplace” (p. 45). Although this study is in response to North Carolina Governor Beverly Purdue spending 10 million dollars for an educational program called Mobile Class (mCLASS): Reading 3D, other technology-based literacy assessment programs were also reviewed throughout the literature.
mCLASS®: Reading 3D is an innovative K-5 literacy based program that uses mobile technology as a way of collecting and analyzing student data. There are similar technology-based assessment programs marketed to achieve the same goals. For example, many North Carolina schools have selected Pearson’s formative assessment solution, AIMS web, as their solution to Responsiveness to Instruction (RtI). Gaither (2008) described AIMS web as a “curriculum-based measure (CBM). CMBs are brief assessments of academic skills that provide a general outcome measure which is reliable, valid, and sensitive to growth” (p. 15). Like mCLASS®: Reading 3D, AIMS web is also a benchmark and progress-monitoring system based on direct, frequent, and continuous student assessment.
Assessment Instrumentation and Procedures for Reading (FAIP-R), Plato: EduTest,
Curriculum Based Management (CBM), Accelerated Reader (AR), and STAR Assessment. Although some of these programs are endorsed by the North Carolina Department of Public Instruction and provide reports that may help determine which students are on the pathway to proficiency for the North Carolina End Of Grade assessments, the mCLASS®: Reading 3D is unique in the program design to provide instructional guidance based on individual assessments.
Common Themes Found in the Research
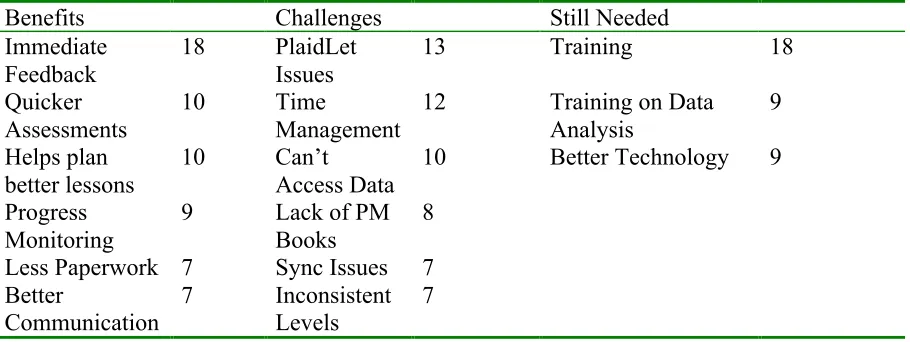
After reviewing the research relating to technology and literacy assessments, several common themes emerged including immediate feedback to students, progress monitoring, cost effectiveness, changes in education, and common cautions. These themes will be discussed in further detail throughout this section.
Immediate feedback. In the literature, there is an emphasis on the importance of immediate feedback to students. Song (2007) believed that using handheld computers ensures that “feedback can be triggered after submission of completed quizzes and
assessments” (p. 40). Although he questioned the consequences of handheld technology, he agreed that the strength in the use of technology is that it provides response and feedback immediately to students. Risko (2010) added that, “assessments can transform instruction by providing timely information that captures students’ strengths, needs, and specific
could never be considered in paper-pencil tests and is one of the many benefits of utilizing technology in formative types of assessments.
mCLASS®: Reading 3D is designed to be formative in nature. The data recorded on the handheld are available to administrators and instructional specialists immediately after the computer is synced with mclasshome.com. This is an efficient way to collect accurate data. It also helps with data driven decision making and determining small group activities designed to meet the individual skill needs of students. This program is designed to
encompass three benchmark assessments that are to guide instruction as well as identify individual students who need progress monitoring.
Progress monitoring. Progress monitoring is defined as assessment in regular intervals in order to predict growth of each student and assess the appropriateness and
effectiveness of an instructional program. For students who are not considered at grade level, North Carolina standards require that progress monitoring occur every ten days, after nine days of instruction. Researchers (Ardoin & Christ, 2009; Balajthy, 2007; Hintze, Christ, & Methe, 2006; Wang, 2010) agreed that simply meeting face to face with a student could make a difference in a child’s performance. Progress monitoring “allows the examiner to assess the reading progress of a student twice a week for 10 to 14 weeks. Student
performance data are then graphed and decisions are indexed to the amount of growth observed over time” (Hintz et al., 2006, p. 52). Hintze et al., (2006) agreed that the
Ardoin and Christ (2009) expressed thoughts of progress monitoring by stating, “10 weeks of twice-weekly progress monitoring data is more data points than is normally
collected and is essential before making instructional decisions” (p. 268). These researchers caution others that while progress monitoring is important, educators should consider grade appropriate selections to ensure that they are consistent. McNamara (2007) believed it was important to assess the child to see if they are at academic risk. Once identified, progress monitoring should be implemented to ensure student success. Technology often makes it easier to ensure validity and consistency.
Cost effectiveness. In a world of limited financial resources, cost effective
assessments hold a unique quality (Ardoin & Christ, 2009). Clarke-Midura and Dede (2010) believed, “Virtual assessments can be more cost effective as well as easier to administer and score for schools, and it can address task and occasion sampling variability through design” (p. 317).
Typically, summative assessments such as End of Grade assessments have been considered more cost-effective. Clarke-Midura & Dede (2010) explained that within an accountability realm, “multiple-choice tests have been the favored choice because they have satisfied psychometric criteria, are more cost effective, and are easier to scale” (p. 311). However, these studies showed that in the twenty-first century there are many other electronic options that are cost effective and support more formative types of assessments.
space constraint. It allows for spontaneity and opportunities for students to learn. Clarke-Midura and Dede (2010) stated that virtual performance based assessments allow for more triangulation of student accomplishment. It increases engagement and allows for more authentic inquiry. MacDonald (2006) believed that mobile technology allows for better documentation of observations. He went on to discuss how technology helps students better meet learning objectives. Researchers agreed that use of technology in assessments help students become more motivated and more apt to show true ability on assessments.
Cautions. Although researchers agreed that formative assessments are essential for student growth, there are cautions to some reading assessment programs. There are flaws in some of the base programs and they should be researched thoroughly before use. Ardoin & Christ (2009) explained that, “Initially the multiple forms that made up CBM-R passage sets for progress monitoring were developed by randomly selecting passages from students curricula. This method, however, was discovered to be flawed because of considerable variability in the difficulty of text within curricula” (p. 267). Furthermore, Song (2007) also argued that technology has made face-to-face teaching and learning more silent and teacher controlled.
Implications
North Carolina elementary schools performing below 55.9% were selected to
program for the state, this study of similar programs creates numerous suggestions for educators.
Wang (2008) suggested that more research is needed on appropriate design of web-based formative assessment feedback. This is also relevant in mCLASS®: Reading 3D schools because of the reports that are generated. It is important to understand and support the design behind such reports. For example, upon examining a parent report from
mCLASS®: Reading 3D, it showed information that was not congruent with countywide expectations. According to Reading 3D Home School Connection Reports (see Appendix F for a sample report), a first grader should read at least a level C to be considered proficient, while countywide expectations clearly state that a first grader must be a level F at the beginning of the year assessment. This type of reporting is contradictory and must be addressed in order to create reliability within the program.
Future studies should also examine reliability of decisions based on progress monitoring (Ardoin & Christ, 2009) which is supported in the design of each assessment. The researchers stated that the “results of the current study suggest that future studies should examine the reliability and accuracy of decisions regarding students’ response to instruction as a function of the difficulty of passages used to monitor progress” (p. 279).
gather additional assessment data, such as from observations and conversations with all stakeholders, and select an appropriate conceptual framework through which to analyze the data.
Chapter Summary
In conclusion, the electronic formative assessment programs discussed in this chapter are a way to track students’ data instantly to guide early literacy instruction. Durkin (1978-79) stated in her revolutionary work decades ago that teachers should not replace teaching with testing. However, in Twenty-First Century learning, it seems as though testing is crucial to help guide teaching. Doe (2006) believed that technology in early literacy assessments could make the life and job of a teacher much simpler along with supporting a diverse population of students. Balajthy (2007) summed it up nicely when he said,
Even under the best conditions, initial startup of any technology-based educational system will be onerous, as teachers learn software operation, work out inevitable bugs, and integrate the new data and their regular instruction. When properly implemented, however, technology can ease teachers’ assessment burdens and increase efficiency and effectiveness. (p. 240)
The following chapter will outline the methodology and research design of this study, including the steps of the data collection process and participant selection, as well as
Chapter 3 Methodology
As previously mentioned, the purpose of this study was to understand how teachers perceive program implementation and the role of technology in the reading assessment program called mCLASS®: Reading 3D. This qualitative perceptual study explored how teachers’ perceived the implementation process and how technology impacted the fidelity of the Reading 3D program.
The results of this study may assist educators with the knowledge of the impact that mobile technology has on early literacy assessments. A great deal of an educator’s budget must be utilized in order to make program implementation successful. In order to understand the previous research in this area, the literature review examined several literature streams including the Technological Pedagogical Content Knowledge model, utilizing technology in early literacy assessments, as well as implementation and perceptual studies.
Research Design
There are many opportunities for research in the field of education (Merriam, 1998). Qualitative research can be defined as “an inquiry process of understanding based on distinct methodological traditions of inquiry that explore a social or human problem. The researcher builds a complex, holistic picture, analyzes words, reports, detailed views of informants, and conducts the study in a natural setting” (Creswell, 2007, p. 15). Merriam (1998) went on to share that in contrast to quantitative research, “qualitative research can reveal how all the parts work together to form a whole. It is assumed that meaning is embedded in people’s experiences and that this meaning is mediated through the investigator’s own perceptions” (p. 6). With this in mind, I considered each teacher’s experience and perspective as a valuable part of the data collection in this study.
Qualitative research is a comprehensive approach to studying social phenomenon and includes a variety of approaches to select from based on the intent of the study (Bloomberg & Volpe, 2008). Educational researchers have refined qualitative research methods to
perception as well as the understanding for the perception. Throughout this study, I sought to gain understanding and meaning within the realm of a single rural North Carolina county.
In this study, I attempted to understand various aspects in the implementation of Reading 3D. This study provided an understanding of the link between technology and teacher perceptions of the implementation of Reading 3D. Although this study does not offer generalizability, describing Reading 3D as a much needed early literacy assessment program that provides appropriate interventions may also assist other schools that are looking for a research-based K-2 intervention program.
This perceptual study sought to discover teachers’ perspectives on how technology in the Reading 3D program impacted the implementation of the program in this school system. The underlying assumptions that drove this research were the sense of exploration and hope for discovery about the impact Reading 3D has on classroom instruction. I collected
appropriate data in this perceptual study in order understand the implementation process in a rural county.
There are limitations to perceptual studies; only teachers’ perceptions were explored throughout this study. The perceptions of principals and other staff members conducting assessments were not examined, so the data gathered may be biased toward teacher perceptions and not representative of the entire implementation of the program.
Research Questions
audience and is consistent with what is supposed to be accomplished. The purpose of
implementing mCLASS®: Reading 3D is to establish a well-defined formative assessment to improve literacy skills to the target audience.
In order to evaluate the teachers’ perceptions of the implementation of this program, two research questions were identified:
1. What are the teachers’ perceptions of the implementation of the Reading 3D program?
2. For teachers implementing Reading 3D in grades K-3, what are their perceptions regarding the implementation process of Reading 3D as it relates to the role of technology?
In order to answer the research questions, this study reviewed data collected through surveys, documentation, and interviews to provide a deep understanding of the perceptions of selected teachers.
Participant Selection
Patton (2002) explained that stratified random sampling is essentially a sample within a sample. All K-3 teachers that implemented Reading 3D in the 2010-11 school year were invited to participate in a survey. However, the sampling for interviewing teachers in this study was stratified because I used online documentation to identify two groups of
selected participants through stratified random sampling in order to enhance the results of this study.
While this study has wider implications, this program is only available at the
elementary level. In 2009-2010, the state of North Carolina piloted Reading 3D in 47 select schools. In August of 2010, the final evaluation report was presented to the North Carolina General Assembly, which resulted in additional school districts participating in Reading 3D. Due to budget constraints, there were a limited number of schools that participated in this program at the state’s expense. The state used EOG data from 2009-10 and mandated that any school that had a composite score of 55.9% or below participate in Reading 3D. See Appendix A for an explanation of a composite score.
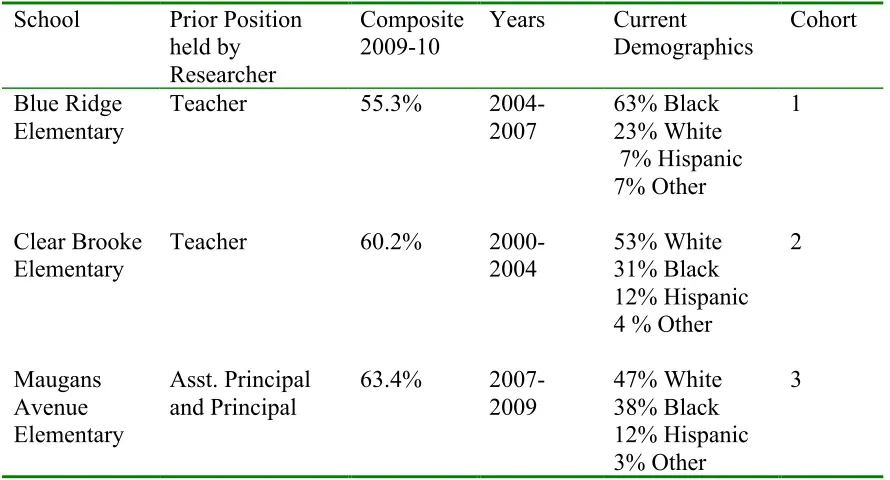
Brooke staff was trained in December 2010 while Maugans Avenue staff received training in January 2011. Both schools were able to implement the program during the middle of the year benchmark assessment. See Table 3 below.
Table 3
Site Information
School Prior Position held by Researcher
Composite
2009-10 Years Current Demographics Cohort
Blue Ridge Elementary
Teacher 55.3%
2004-2007 63% Black 23% White 7% Hispanic 7% Other 1 Clear Brooke Elementary
Teacher 60.2%
2000-2004
53% White 31% Black 12% Hispanic 4 % Other
2 Maugans Avenue Elementary Asst. Principal and Principal
63.4% 2007-2009 47% White 38% Black 12% Hispanic 3% Other 3
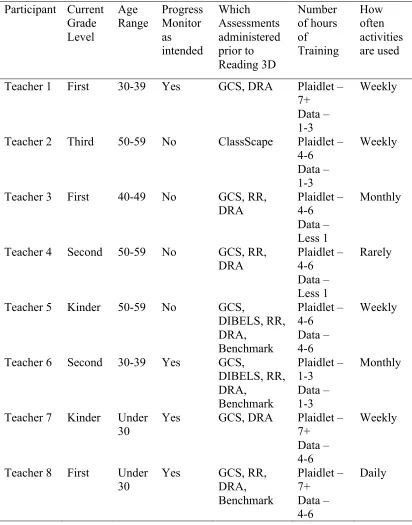
Table 4
Participant Selection
School Cohort Survey Participants Agreed to Interview Progress Monitoring with Fidelity Selected For Interview Blue Ridge Elementary
1 10 5 3 4
Clear Brooke Elementary
2 11 6 4 3
Maugans Avenue Elementary
3 5 3 3 1
TOTAL 26 14 10 8
Data Collection
Researchers recommended many common sources for data collection in qualitative research. Merriam (1998) stated that data is usually derived from interviews, field
observations, and documents, while Yin (2003) recommended gathering data from the following: online documentation, archival records, interviews, direct observations, participant observations, and/or physical artifacts.
For this study, I collected data through surveys, online documentation, and interviews. Data was collected and stored electronically. I backed up the data in a
Surveys
A clear and simple survey yields sufficient and rich data through a few closed questions and a few precise open-ended questions (Edmonson & Irby, 2008). In order to formulate appropriate survey questions, I reviewed various studies, including dissertations, implementation studies, and literacy-based studies. After developing possible questions, I discussed with a literacy expert and drew upon my own experiences with this program to finalize the survey questions, including 10 checklist items and 8 open-ended questions regarding the implementation of Reading 3D.
Edmonson & Irby (2008) explained that, “The survey is long enough to gather important information on the topic; however, a follow-up interview may be necessary with some of the respondents for clarification purposes” (p. 72). The survey also asked
participants whether or not they would be willing to participate in an interview.
There are limitations to administering surveys in a qualitative study. Unfortunately, you run the risk of loosing the opportunity to dig deeper into a participants’ response when you only use a survey (Edmonson & Irby, 2008). That is why I also participated in eight one on one interviews. In addition you are unable to clarify to the participant the meaning of each question and the possibility of an invalid survey arises. Lastly, participants tend to elaborate more when talking than when writing.
I administered a paper/pencil survey at three elementary schools inviting any teacher who taught kindergarten, first, second, or third grade during the last school year to
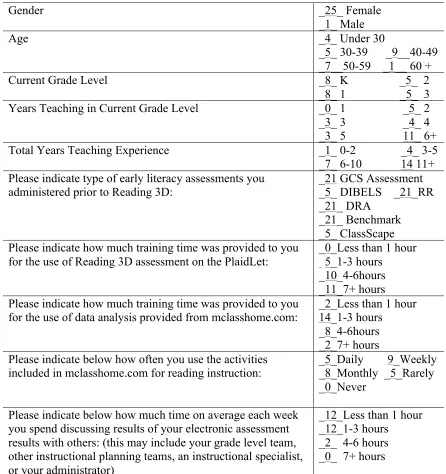
explained the study to them, asking if they would be willing to take a 20 minute survey during the duration of this regularly scheduled staff meeting (see Appendix B). With a completion rate of 96%, twenty-six of the teachers from three schools agreed to participate. Although there were 10 participants from Blue Ridge, 11 from Clear Brooke, and 5 from Maugans Avenue Elementary, I will report the findings as one group of teachers from the same rural county. Within the survey, teachers were given an option to be anonymous and therefore I will not link survey information to a specific teacher. Twenty-five of the teachers were female, with only one male teacher participating, however, throughout this study, each teacher will be referred to with feminine pronouns in order to further protect anonymity. Most of the teachers in this survey have taught for more than six years and have a deep knowledge of previous literacy assessments and practices with which to compare Reading 3D. See Table 5 on the next page for a description of the survey participants.
Table 5
Description from Survey Participants
Gender _25_ Female
_1_ Male
Age _4_ Under 30
_5_ 30-39 _9__40-49 _7__50-59 _1__ 60 +
Current Grade Level _8_ K _5_ 2
_8_ 1 _5_ 3 Years Teaching in Current Grade Level _0_ 1 _5_ 2
_3_ 3 _4_ 4 _3_ 5 11_ 6+ Total Years Teaching Experience _1_ 0-2 _4_ 3-5
_7_ 6-10 14 11+ Please indicate type of early literacy assessments you
administered prior to Reading 3D: _21 GCS Assessment _5_ DIBELS _21_RR _21_ DRA
_21_ Benchmark _5_ ClassScape Please indicate how much training time was provided to you
for the use of Reading 3D assessment on the PlaidLet:
_0_Less than 1 hour 5_1-3 hours
_10_4-6hours _11_7+ hours Please indicate how much training time was provided to you
for the use of data analysis provided from mclasshome.com: _2_Less than 1 hour 14_1-3 hours _8_4-6hours
_2_7+ hours Please indicate below how often you use the activities
included in mclasshome.com for reading instruction:
_5_Daily 9_Weekly _8_Monthly _5_Rarely _0_Never
Please indicate below how much time on average each week you spend discussing results of your electronic assessment results with others: (this may include your grade level team, other instructional planning teams, an instructional specialist, or your administrator)
_12_Less than 1 hour _12_1-3 hours
Online Documents
Patton (2002) believed that a researcher should negotiate access to important documents from the very beginning of a study. Therefore, I requested permission from the Assistant Superintendent and principals to view online documents. Official documents are readily available, but may be protected or private (Bogdan & Biklen, 2007). In this study, the online reports are password protected, but are available with district permission.
Hence, with permission from each principal, I examined each electronic document as officially trained by the developers of Reading 3D, Wireless Generation to discover which of the 14 willing participants were progress monitoring with fidelity (see Appendix C for sample reports). Ten participants appeared to progress monitor regularly, while four participants were not monitoring as often as intended. After stratifying the fourteen
participants into these two groups, I purposefully narrowed the sample in order to study each participant deeper. Selecting four of the ten participants who progress monitored
consistently along with all of the four participants who were not progress monitoring with consistency to participate in a one-on-one interview narrowed the sample size, which allowed me to dig deeper into each perception.
Patton (2002) explained that a possible limitation of document analysis is that they might be incomplete or inaccurate. Therefore, I reviewed documents with my personal expertise to analyze the online reports. Edmonson & Irby (2008) shared that “While