Ultimate failure of creeping structures as a result of progressive damage
Adam Bodnar, Marcin Chrzanowski, Pawel Latus and KrzysztofNowak
Cracow University of Technology, Cracow, Poland
ABSTRACT
The paper discusses safety of creeping metallic structures. As a measure of it the relations of characteristic stages of damage growth has been used. This process is described by means of Continuum Damage Mechanics that incorporates into constitutive equations a new state variable responsible for material's deterioration caused by loading at high temperatures. The characteristic stages mentioned above are associated with advancement of cracking of structures: its nucleation, propagation across of characteristic dimensions of a structure, and - finally - forming the network of cracks which cause structure to collapse. This process has been shown for two types of structures: that of homogeneous state of stress in its members i.e. trusses, and plates which exhibit complex stress fields.
INTRODUCTION
Structures that operate in high temperature environment undergo a number of time dependent processes, which may lead to their catastrophic collapse. These changes are backed up by microstructural transformations, and are manifested by an excessive deformation, stress redistribution and gradual loss of material continuity. This last phenomenon is of prime importance, since it develops mostly within material body and remains unnoticed during macroscopic inspections. This period of degradation process is often called a hidden stage of deterioration; it is terminated at time denoted h when a macrocrack is formed due to coalescence of microdefects. The propagation of this crack until it spans a characteristic dimension of structural member at t2 constitutes the second stage of structural deterioration. Finally, the system of cracks is formed bringing the structure to the state of geometrical instability at time t3. Therefore, the ratio of times t3/tl can be used as the definition of safety margin which allows on a rescue action in time interval <tl, t3>.
In the paper Continuum Damage Mechanics methods have been applied to describe above process in creeping trusses and plates. In the latter case the analysis has been carded out until t2, as the time interval <t2, t3 > is negligible. The influence of stress redistribution resulting from both transition from elastic state up to tertiary creep was, as well from changes in structure's geometry caused by progressive damage, was taken into account.
The formal description of the above process became possible by introduction of a new state variable ~F called "continuity" by L.M. Kachanov in 1958 [1]. This gave impetus to rise new branch of mechanics called Continuum Damage Mechanics [2] which formulates evolution laws for damage variable co = 1 - V. The full set of governing equations (discussed in the following section) with appropriate initial and boundary conditions has to be integrated within above mentioned time intervals (0, tl), (h, t2) and (t2, t3). This requires integration over spatial domain that changes in time as points at which damage reaches its critical values (set to one in the present analysis) do not carry any stress.
For trusses which elements exhibit only uniaxial state of stress, the time tl and t2 coincide when damage reaches its critical value in any member. Therefore, the analysis has to be carded out until sufficient number of the members fail causing global instability at the time t3. In this case time interval
<t3-
t2 > can viewed as safety margin of a given structure.For structures like plates which exhibit non-homogeneous state of stress, the analysis in the first stage of deterioration process (0, h) is carried out until damage reaches its critical value in one point of integration (Gaussian point for FE analysis). In time interval (t~, t2) the points of integration consecutively excluded from integration form a network of macrocracks that propagate throughout plate body until one of them span its thickness. The ratio of t2/t~ can be viewed as first approximation of safety margin of a given structure. In fact, the rate of macrocrack propagation in the third stage (t2, t3) is several orders higher than that in the preceding stage, and consequently the time interval (h, t3) has no practical meaning from safety point of view. Therefore, this stage is not analyzed within the present paper.
GOVERNING EQUATIONS
For deformation which includes elastic state of stress and creep deformation coupled with damage, the set of equations consist of:
equation of equilibrium:
compatibility equation:
o'ij,j - 0 (1)
2eij
- ui, j + uj, i (2)SMiRT 16, Washington DC, August 2001 Paper # 1781
constitutive equations for deformation:
and for damage growth:
e c
6ij
- ~ij + ¢ij (3)e _
D ~ o
(4)8ij kl
~ 8 ~ ( G e f f ) n ~O'eff
~9----~-- y 1_o ~
~--~ ~j
(5)
i t
t
lm
c 3 ° 3 - A f f m a x (c~i) ( - ~ J ) (1 CX) Oeff c3t ; - ~ ' i - - h-o) + - 1-03
(6)
where: uj - displacement, aij, aeij, g°ij - total, elastic and creep strain tensors, respectively, crij - stress tensor, DiN - elastic constants matrix (given by Young modulus E and Poisson ratio v), cr¢e- Huber-Mises effective stress, co - scalar damage parameter (0_< o~ _<1), cry, crj - maximum principal stresses, 3' and n - steady state creep constants, A and m - damage evolution law constants, o~ and h - material constants reflecting failure mode, t - time.
The parameter o~ (0< cz _<1) reflects the sensitivity of different materials to the failure mode. For the microdefects which are formed at grain boundaries perpendicular to principal stresses direction the o~ = 1. In the other extreme case, when slip mechanism of failure prevails o~ = 0. The intermediate values of cz (0< o~ <1) correspond to a mixed type of failure when both mechanisms interplay.
The parameter h (0< h <1) is the coefficient which reflects material sensitivity to compressive stress. For h = 1 the material is equally sensitive to positive and negative stresses and such material behavior will be called bilateral one. For values of h (0< h <1) the material will be called non-unilateral one. The discussion of the above equations can be found elsewhere.
Full analysis of the above problem should be carried out in the space of its parameters. These include: space and time distribution of loading, kinematic boundary conditions (supports and shape of a structure), and material constants. However, such an analysis is out of the scope of present paper, and partially has been already done by authors (cf. e.g. [5] ). In the present paper the material constants will be set to: E = 0.102.106 (MPa), v = 0.33, n = 6.8, m = 5.79, Y = 1.38"1024[(MPa) n hl], A = 1.08.102°[(MPa) m h 1] (Ti-6A1-2CR-2Mo alloy at temperature 675 K [6] ), and only the influence of loading value upon characteristic times will be studied for two chosen examples.
EXAMPLE 1: TRUSS
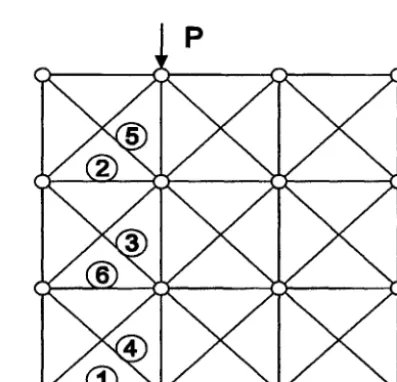
Lets consider the truss shown in Fig. 1. The length of all vertical and horizontal bars is set to lm, whereas the cross section of bars is equal to lcm 2.
P
Numbers in the Fig. 1 indicates the sequence in which failure of consecutive bars (for load value P = 60 kN) occurs.
Table 1 gives values of time tl = t2 at which first bar losses its load beating capacity caused by damage development to its critical value co = 1, as well the times t3 at which the truss becomes unstable.
Table 1. Times to rupture of first and last truss member
P (kN) tl = t2 (hrs) t3 (hrs) t3/tl
20 1.8468E+09 4.5238E+09 2.4495
30 1.7654E+08 4.3331E+08 2.4545
40 3.3376E+07 8.2039E+07 2.4580
50 9.1690E+06 2.2563E+07 2.4608
60 3.1905E+06 7.8582E+06 2.4630
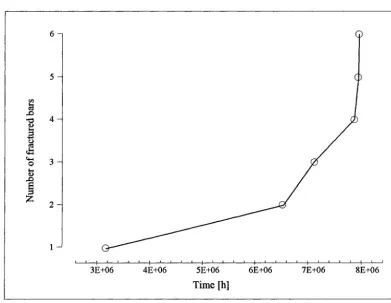
The progress in time of the structure's deterioration is shown in Fig. 2, in which cumulative number of fallen bars is plotted versus time (for load value P = 60 kN).
r.~
CD
q - 4 O
_
_
t. i ] i
3E+06 4E+06 5E+06 6E+06 7E+06 8E+06
Time [h]
Fig. 2 Progression of truss deterioration
E X A M P L E 2: P L A T E
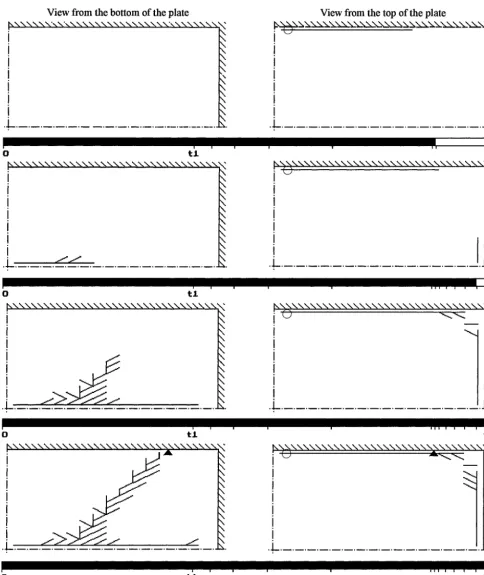
The rectangular plate of thickness equal to 0.01 m and with sides of I and 2 meters length is considered. All plates edges are clamped and plate is loaded with constant uniform press p on its upper surface.
View from the bottom of the plate N \ \ \ \ \ \ ' x \ ' ~ . \ \ \ \ \ \ \ \ \ \ \ \ \ \ \ \ ' \ \ \ \ \ \ \ \
i
i
I
I
i
I
i
View from the top of the plate
I
I
I
i
I
I
I
• L . . .
0 t l
, b , \ \ \ \ \ \ \ \ \ \ \ \ \ \ \ \ \ \ \ \ \ \ \ \ \ \ \ \ \ \ \ \ ~
I
I
I
I
I
i
i
L ...
_/.f
N \ \ \ \ \ \ \ \ \ \ \ \ \ \ \ \ \ \ \ \ \ \ \ \ \ N , \ \ \ \ \ \ \
I
I
I
I
I
i
\ \ \ \ \ \ \ \ \ \ \ \ t 2 \ \ \ \ \ \ \ \ \ \ \ \ \ \ \ x.0 t l t 2
N \ \ \ \ \ \ \ \ \ \ \ \ \ \ \ \ \ \ \ \ \ \ \ \ \ \ \ \ \ \ \ \ \
I
I
I
I
i
• L . . . .
~ \ \ \ \ \ \ \ \ \ \ \ \ \ \ \ \ \ \ \ \ \ \ \ \ \ \ \ \ \ \ x \ ~
I
I
I
I
i
L . . .
0 t l t 2
~ \ \ \ ~ \ \ \ \ \ \ \ \ \ \ \ \ \ \ \ \ \ \ \ \ \ \ \ \ \ \ \ \ A
l
!
!
l
!
!
I
i
/
~ N _ \ \ \ \ \ \ \ \ \ \ \ \ \ \ \ \ \ \ \ \ \ \ \ \ ~ \ \ \ \ \ \ \
I
I
I
I
I
L . . .
\ \ X \ \ \ \ \ \ \ \ \ \ ~x.
O t l t 2
Fig. 3 Cracking stages of the plate in time interval <tl, t2>
m a r g i n .
Table 2. Times of macro-crack initiation and proliferation
p (MPa) t~ (hrs) t2 (hrs) t2/tl
3.13 2.6195E+08 5.9586E+08 2.2747
6.26 4.7763E+06 1.0840E+07 2.2696
9.3 8 4.5 898E+05 1.0402E+06 2'2664
12.51 8.7089E+04 1.9720E+05 2.2644
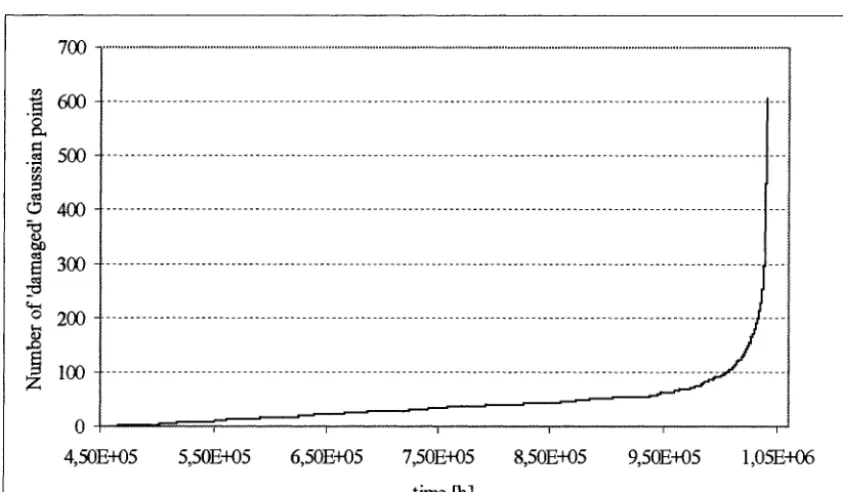
To demonstrate rate of deterioration process in the plate the plot of number of Gaussian points (points of integration in which damage equals one versus time is shown in Fig. 4 (for loading value of p = 9.38 MPa).
00 ...
.~ 6O3
o
.~ 500 r / )
400 r~
o et0
3oo
o 200 t - i 0
z 10o
0 4,50E+05
- ~ : " . . . . I " : ... I - - I . . . I . . . i " - 5,50E+05 6 , 5 0 E + 0 5 7 , 5 0 E + 0 5 8 , 5 0 E + 0 5 9 , 5 0 E + 0 5 1,05E+06
time [h]
Fig. 4 Number of 'damaged' Gaussian points in time interval <tl, tz >
CONCLUSIONS
The method applied here to analyze of progressively deteriorating structures appeared to be effective: all three stages of the process can be reproduced within the frame of a one consistent description. Characteristic time instances tl, t: and t3 can be evaluated and, thus, a safety margin for a structure can be established.
An interesting feature revealed in the present study is that safety margin, defined as the ratio of characteristic times, practically does not depend on the loading level. The rate of cracking for time greater than tl (onset of macrocrack propagation) can be lowered by the reduction of the load; the margin of safety remains unchanged, but the absolute vale of time remaining to final collapse will be essentially prolonged. These conclusions apply only for one set of problem parameter (material constants, boundary conditions etc.). To draw out complete conclusions requires the analysis of result to be performed in the space of problem parameters.
REFERENCES
1. Kachanov, L.M., "On time to failure in creep conditions" (in Russian), Izv. Ak. Nauk SSSR, OTN, Vol. 8, 1958, pp. 26- 31.
3. Bodnar, A., Chrzanowski, M., "Numerical simulation of cracking plates", Arch. Bud. Masz. Vol. 43, 1996, pp.131-139. 4.Bodnar, A., Chrzanowski, M., "Cracking of creeping structures described by means of CDM", Proc. ItYrAM Symposium
on Creep in Structures, Nagoya, Japan, April 2000, pp.189-196.
5.Bodnar, A. Chrzanowski, M., "Development of non-unilateral damage fields in creeping plates", Proc. IUTAM Symposium on Rheology of Bodies with Defects, Beijing, September 1997, pp.267-76.
6.Walczak, J., "On an energy creep rupture criterion", Int. J. Mech. Sci, 2, 1986, pp.71-81.