18th International Conference on Structural Mechanics in Reactor Technology (SMiRT 18) Beijing, China, August 7-12, 2005 SMiRT18-K16-1
THE RESEARCH OF SEISMIC RESPONSE ANALYSIS OF CARR
REACTOR COMPLEX
Ming Zhang
Shanghai Nuclear Engineering Research
& Design Institute, Shanghai 200233
Phone: +86-21-64850220-29274,
Fax: +86-21-64854266/64851074
E-mail: [email protected]
Weida Yao
Shanghai Nuclear Engineering Research
& Design Institute, Shanghai 200233
Phone: +86-21-64850220-29295,
Fax: +86-21-64854266/64851074
E-mail: [email protected]
Xuejun Luo
Shanghai Nuclear Engineering Research & Design Institute, Shanghai 200233
Phone: +86-21-64850220-29295,
Fax: +86-21-64854266/64851074
E-mail: [email protected]
ABSTRACT
CARR reactor complex includes core vessel, heavy water tank, flow guiding tank, decay tank and reactor pool, etc. There is a lot of light water and heavy water in the complex. A fluid-structure interaction must be simulated in the seismic analysis. The reactor complex is simplified a 3D fluid-solid coupled model which includes fluid elements and solid elements. A modal analysis is performed for the 3D fluid-solid coupled model and obtains natural frequencies and mode shapes under fluid-structure interaction. On the base an equivalent fluid-solid coupled model is built and performed for seismic response analysis.
Keywords: CARR reactor complex, fluid-structure interaction, seismic response analysis
1. INTRODUCTION
According to the contract between Reactor Engineering Research & Design Department, China Institute of Atom Energy and Shanghai Nuclear Engineering Research & Design Institute, CIAE entrusted SNERDI with mechanics analysis and evaluation of CARR reactor complex and fuel assemblies. This paper is the research of seismic response analysis of CARR reactor complex. The results of seismic analysis will provide various seismic loads for stress analysis and evaluation of the internals of CARR reactor complex.
2. STRUCTURE BRIEF DESCRIPTION
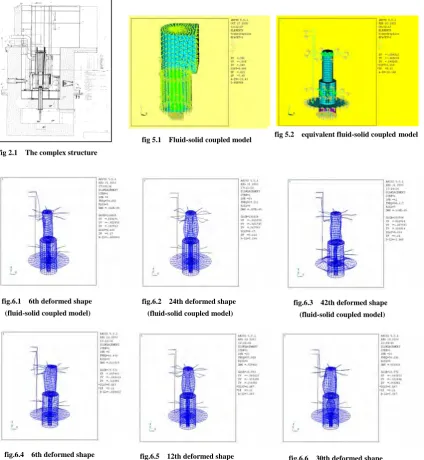
the pool as a whole. The core vessel passes through the middle of heavy water tank and connects with flow guiding tank. The core vessel holds fuel assemblies. The coolant passes through core vessel and decay tank into flow guiding tank and flows out of the reactor from outlet piping. They form the primary loop pressure boundary.[1][2] The structure figure of reactor complex is shown in fig2.1.
3. INPUT LOAD
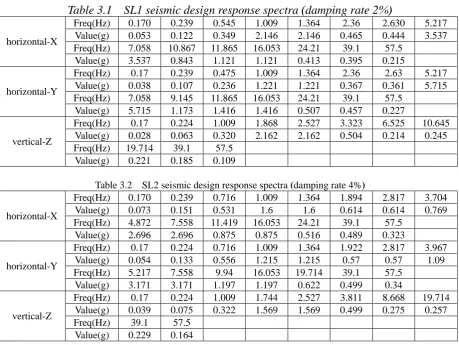
Design acceleration response spectra of the seismic analysis are shown in Table 3.1 and Table 3.2. Damping rate are 2% and 4%, respective. It is provided by Tsinghua university.[3]
Table 3.1 SL1 seismic design response spectra (damping rate 2%)
Freq(Hz) 0.170 0.239 0.545 1.009 1.364 2.36 2.630 5.217
Value(g) 0.053 0.122 0.349 2.146 2.146 0.465 0.444 3.537 Freq(Hz) 7.058 10.867 11.865 16.053 24.21 39.1 57.5
horizontal-X
Value(g) 3.537 0.843 1.121 1.121 0.413 0.395 0.215
Freq(Hz) 0.17 0.239 0.475 1.009 1.364 2.36 2.63 5.217
Value(g) 0.038 0.107 0.236 1.221 1.221 0.367 0.361 5.715
Freq(Hz) 7.058 9.145 11.865 16.053 24.21 39.1 57.5
horizontal-Y
Value(g) 5.715 1.173 1.416 1.416 0.507 0.457 0.227
Freq(Hz) 0.17 0.224 1.009 1.868 2.527 3.323 6.525 10.645
Value(g) 0.028 0.063 0.320 2.162 2.162 0.504 0.214 0.245
Freq(Hz) 19.714 39.1 57.5
vertical-Z
Value(g) 0.221 0.185 0.109
Table 3.2 SL2seismic design response spectra (damping rate4%)
Freq(Hz) 0.170 0.239 0.716 1.009 1.364 1.894 2.817 3.704
Value(g) 0.073 0.151 0.531 1.6 1.6 0.614 0.614 0.769
Freq(Hz) 4.872 7.558 11.419 16.053 24.21 39.1 57.5
horizontal-X
Value(g) 2.696 2.696 0.875 0.875 0.516 0.489 0.323
Freq(Hz) 0.17 0.224 0.716 1.009 1.364 1.922 2.817 3.967
Value(g) 0.054 0.133 0.556 1.215 1.215 0.57 0.57 1.09
Freq(Hz) 5.217 7.558 9.94 16.053 19.714 39.1 57.5
horizontal-Y
Value(g) 3.171 3.171 1.197 1.197 0.622 0.499 0.34
Freq(Hz) 0.17 0.224 1.009 1.744 2.527 3.811 8.668 19.714
Value(g) 0.039 0.075 0.322 1.569 1.569 0.499 0.275 0.257
Freq(Hz) 39.1 57.5
vertical-Z
Value(g) 0.229 0.164
4. ANSYS METHODS AND CALCULATION CODE 4.1 ANALYSIS METHODS
The reactor complex containing core vessel, heavy water tank and flow guiding tank. and the pool form a whole structure. There is a large number of light water and heavy water in the pool. Therefore fluid-structure interaction is considered in the seismic analysis. 3D fluid elements and 3D structure elements are applied.
4.2 CALCULATION CODE
ANSYS code is applied in the seismic analysis. It is known to a large-scale current FEA code. Mechanical analysis containing solid and fluid; static and dynamic; linear and nonlinear etc. can be performed with ANSYS .
4.3 BASIC THEORY OF FLUID-STRUCTURE INTERACTION IN ANSYS[4]
(1) The fluid is compressible (density changes due to pressure variations). (2) The fluid is inviscid (no viscous dissipation).
(3) There is no mean flow of the fluid.
(4) The mean density and pressure are uniform throughout the fluid. The Navier-Stokes equation can be simplified to linear acoustic wave equation: 1 2 0
2 2
2 ∂ −∇ =
∂
p t
p c
(4-1) where: c = speed of sound ( k/ρ0) in fluid medium
ρ0 = mean fluid density
k = bulk modulus of fluid p = acoustic pressure t = time
Since the viscous dissipation has been neglected, equation (4-1) is referred to as the lossless wave equation for propagation of sound in fluids. The discretized structural equation and the lossless wave equation have to be considered simultaneously in fluid-structure interaction problems. The fluid pressure acting on the structure at the fluid-structure interface will be considered to form the coupling stiffness matrix.
The fluid-structure interaction equation derives as follow:
The matrix operators are introduced for equation (4-1) and the discretized wave equation can be written as follow:
[ ]
{ }
+[ ]
{ }
+[ ]
{ }
+ 0[ ]
Re{ }
e =0 Te p e e p e e p
e p C p K p U
M ρ (4-2) where:
[ ]
{ }{ }
N N dvc
M T
v p e = 2
∫
1 = fluid mass matrix (fluid)
[ ]
{ }{ }
N N ds cC T
s p e =
∫
β = fluid damping matrix (fluid)
[ ]
K[ ] [ ]
BT Bdv vp
e =
∫
= fluid stiffness matrix (fluid)In order to completely describe the fluid-structure interaction problem, the fluid pressure load acting at the interface is added to equation. So, the structure equation is written as follow:
[ ]
{ }
[ ]
{ }
[ ]
{ } { }
{ }
pr e e e e e e ee U C U K U F F
M + + = + (4-3) The fluid pressure load vector
{ }
F
epr at the interface S is obtained by integrating the pressure over the area of the surface:{ }
F
{ } { }
N
'
p
n
d
(
s
)
s pr
e
=
∫
(4-4)p={N}T{pe} (4-5)
where: {N'} = shape functions employed to discretize the displacement components u,v,w (obtained from the structural element)
{N} = element shape function for pressure
{n} = normal at the fluid boundary
Substituting the finite element approximating function for pressure given by equation (4-5) into (4-3):
{ }
{ }{ } { } { }
e[ ]
{ }
e Ts pr
e N N nds p p
F =
∫
' = Re (4-6)where:
[ ]
{ }{ } { }
N N T nds s∫
= '
Re (4-7)
Substituting of equation (4-7) into (4-3) results in the dynamic elemental equation of the structure:
[ ]
Me{ }
Ue +[ ]
Ce{ }
Ue +[ ]
Ke{ }
Ue −[ ]
Re{ } { }
pe = Fe (4-8)[ ] [ ]
[ ] [ ]
{ }
{ }
[ ] [ ]
[ ]
[ ]
{ }
{ }
[ ]
[ ]
[ ]
[ ]
{ }
{ }
{ }
{ }
⎭⎬ ⎫ ⎩ ⎨ ⎧ = ⎭ ⎬ ⎫ ⎩ ⎨ ⎧ ⎥ ⎦ ⎤ ⎢⎣ ⎡ + ⎭ ⎬ ⎫ ⎩ ⎨ ⎧ ⎥ ⎦ ⎤ ⎢
⎣ ⎡ + ⎭ ⎬ ⎫ ⎩ ⎨ ⎧ ⎥ ⎦ ⎤ ⎢
⎣ ⎡
0 0
0 0
0 e
e e p e
fs e
e e p e e
e e p e fs
e F
p U K K K p U C C p U M M
M
(4-9)
where: [Mfs]=ρ0[Re]T ; [Kfs]=-[Re] 。
From equation (4-9), we can see that for aproblem involving fluid-structure interaction, the acoustic fluid element will generate all the submatrices with superscript p in addition to the coupling submatrices ρ0[Re]T and [Re]. Mass and stiffness matrix form unsymmetric configuration. Therefore, for the coupled (unsymmetric) problem, a corresponding unsymmetric eigensolver must be used.
5. CALCULATION MODELS
Due to the reactor complex of CARR are immerged in the pool, fluid-structure interaction must be considered in the seismic analysis. At first, a 3D fluid-solid coupled analysis model is built. A unsymmetric matrix method is used to perform a modal analysis because mass and stiffness matrix of the fluid-solid coupled model are unsymmetric. A full transient method can be used for the seismic response analysis. Now because of the computer capacity limitation, 3D fluid-solid coupled model is used only in modal analysis which can obtain structural natural frequencies and mode shapes in fluid-structure interaction. On this base, a 3D equivalent fluid-solid coupled model is built to perform the seismic response analysis.
5.1 FLUID-SOLID COUPLED MODEL BUILD
Shell element of ANSYS is used to simulate core vessel, heavy water tank, flow guiding tank and decay tank. Pipe element is used to simulate inlet pipe, outlet pipe and horizontal channels. Beam element is used to simulate the supports of flow guiding tank. Fluid element is used to simulate liquid in the reactor and the pool. The wall of the pool is assumed to be rigid. Fluid-structure interface may be flagged by surface loads at the element faces. Specifying the label will couple the structural motion and fluid pressure at the interface. core vessel, heavy water tank and flow guiding tank were modeled explicitly. Decay tank is modeled only inner cylinder, middle cylinder and top plate. Its bottom plate is regarded as fixed boundary condition. Water effect on horizontal channels, inlet pipe and outlet pipe is considered as additive mass. Intersectant points between horizontal channels and the wall of the pool are regarded as fixed boundary condition. Intersectant points between inlet pipe, outlet pipe and the wall of the pool are also regarded as fixed boundary condition. For vertical channels, only its mass is considered, its stiffness will be neglected.
The analysis model has 26295 fluid elements, 3192 shell elements and 7397 couple elements. In total, there are 27899 elements and 22966 nodes in the model. Simplified finite element model is shown in figure 5.1.
5.2 EQUIVALENT FLUID-SOLID COUPLED MODEL BUILD
When we build the equivalent fluid-solid coupled model the solid model in section 5.1 is adopted and added on additive liquid mass. Additive liquid mass is calculated to base on ASME code appendix N-1450. In this way, we can obtain additive liquid mass of core vessel, heavy water tank, flow guiding tank, decay tank, horizontal channel, inlet pipe and outlet pipe, etc. These additive liquid mass are applied in analysis model.
Boundary conditions in equivalent model are the same with those described in section 5.1 for core vessel, heavy water tank, flow guiding tank, decay tank and horizontal channels, etc. The equivalent model has 2640 shell elements, 188 beam elements and 66 couple elements. In total, there are 2828 elements and 2817 nodes in the model. Simplified finite element model is shown in figure 5.2.
6. CALCULATION RESULTS
6.1 RESULTS OF MODAL ANALYSIS
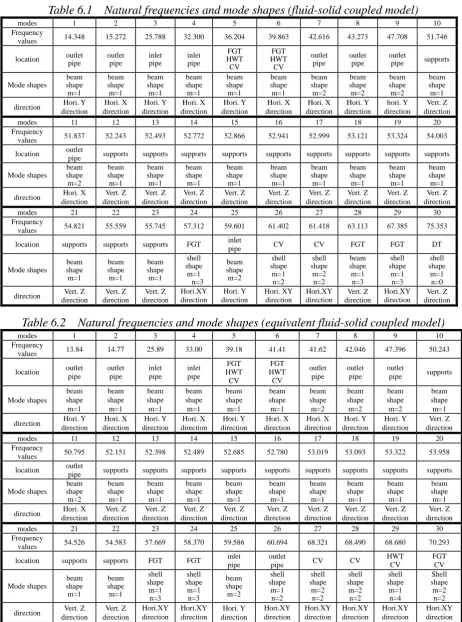
Unsymmetric matrix method is applied in fluid-solid coupled model. Calculating results of natural frequencies and mode shapes (fluid-solid coupled model) were shown in Table 6.1. Deformed shape plots are shown in fig. 6.1∼fig. 6.3.
Table 6.1 Natural frequencies and mode shapes (fluid-solid coupled model)
modes 1 2 3 4 5 6 7 8 9 10 Frequency
values 14.348 15.272 25.788 32.300 36.204 39.863 42.616 43.273 47.708 51.746
location outlet pipe outlet pipe inlet pipe inlet pipe FGT HWT CV FGT HWT CV outlet pipe outlet pipe outlet
pipe supports
Mode shapes beam shape m=1 beam shape m=1 beam shape m=1 beam shape m=1 beam shape m=1 beam shape m=1 beam shape m=2 beam shape m=2 beam shape m=2 beam shape m=1
direction Hori. Y direction Hori. X direction Hori. Y direction Hori. X direction Hori. Y direction Hori. X direction Hori. X direction Hori. Y direction hori. Y direction Vert. Z direction modes 11 12 13 14 15 16 17 18 19 20 Frequency
values 51.837 52.243 52.493 52.772 52.866 52.941 52.999 53.121 53.324 54.003
location outlet
pipe supports supports supports supports supports supports supports supports supports
Mode shapes beam shape m=2 beam shape m=1 beam shape m=1 beam shape m=1 beam shape m=1 beam shape m=1 beam shape m=1 beam shape m=1 beam shape m=1 beam shape m=1
direction Hori. X direction Vert. Z direction Vert. Z direction Vert. Z direction Vert. Z direction Vert. Z direction Vert. Z direction Vert. Z direction Vert. Z direction Vert. Z direction modes 21 22 23 24 25 26 27 28 29 30 Frequency
values 54.821 55.559 55.745 57.312 59.601 61.402 61.418 63.113 67.385 75.353 location supports supports supports FGT inlet
pipe CV CV FGT FGT DT
Mode shapes beam shape m=1 beam shape m=1 beam shape m=1 shell shape m=1 n=3 beam shape m=2 shell shape m=1 n=2 shell shape m=2 n=2 beam shape m=1 n=3 shell shape m=1 n=3 shell shape m=1 n=0
direction Vert. Z direction Vert. Z direction Vert. Z direction Hori.XY direction Hori. Y direction Hori. XY direction Hori.XY direction Vert. Z direction Hori.XY direction Vert. Z direction
Table 6.2 Natural frequencies and mode shapes (equivalent fluid-solid coupled model)
modes 1 2 3 4 5 6 7 8 9 10 Frequency
values 13.84 14.77 25.89 33.00 39.18 41.41 41.62 42.046 47.396 50.243
location outlet pipe outlet pipe inlet pipe inlet pipe FGT HWT CV FGT HWT CV outlet pipe outlet pipe outlet
pipe supports
Mode shapes beam shape m=1 beam shape m=1 beam shape m=1 beam shape m=1 beam shape m=1 beam shape m=1 beam shape m=2 beam shape m=2 beam shape m=2 beam shape m=1
direction Hori. Y direction Hori. X direction Hori. Y direction Hori. X direction Hori. Y direction Hori. X direction Hori. X direction Hori. Y direction Hori. Y direction Vert. Z direction modes 11 12 13 14 15 16 17 18 19 20 Frequency
values 50.795 52.151 52.398 52.489 52.685 52.780 53.019 53.093 53.322 53.958
location outlet
pipe supports supports supports supports supports supports supports supports supports
Mode shapes beam shape m=2 beam shape m=1 beam shape m=1 beam shape m=1 beam shape m=1 beam shape m=1 beam shape m=1 beam shape m=1 beam shape m=1 beam shape m=1
direction Hori. X direction Vert. Z direction Vert. Z direction Vert. Z direction Vert. Z direction Vert. Z direction Vert. Z direction Vert. Z direction Vert. Z direction Vert. Z direction modes 21 22 23 24 25 26 27 28 29 30 Frequency
values 54.526 54.583 57.669 58.370 59.586 60.694 68.321 68.490 68.680 70.293
location supports supports FGT FGT inlet pipe
outlet
pipe CV CV
HWT CV FGT CV Mode shapes beam shape m=1 beam shape m=1 shell shape m=1 n=3 shell shape m=1 n=3 beam shape m=2 shell shape m=1 n=2 shell shape m=2 n=2 shell shape m=2 n=2 shell shape m=1 n=4 Shell shape m=2 n=2
6.2 RESULTS OF SEISMIC RESPONSE ANALYSIS 6.2.1 DISPLACEMENT AND ACCELERATION
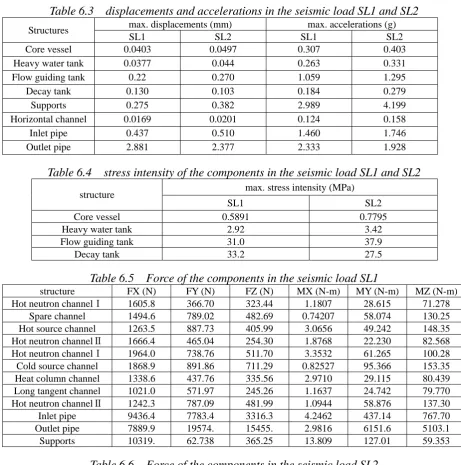
Spectrum analysis method is applied in the seismic response analysis. The most displacements and the most accelerations in the seismic load SL1 and SL2 are shown in Table 6.3.
6.2.2 STRESS INTENSITY AND FORCES
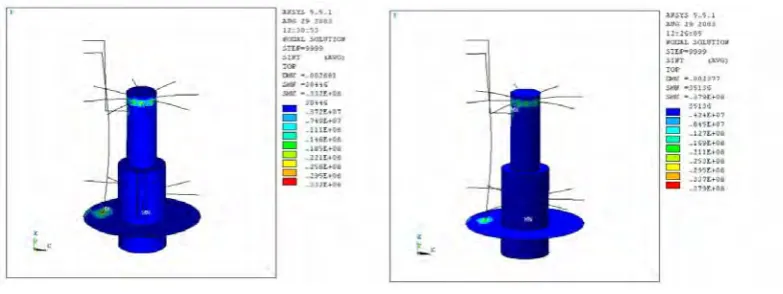
The most stress intensity of the components in the seismic load SL1 and SL2 are shown in Table 6.4. The most stress intensity of the structure in seismic load SL1 is shown in figure 6.7. The most stress intensity of the structure in seismic load SL2 is shown in figure 6.8.
Forces of horizontal channels, inlet pipe and outlet pipe in the seismic load SL1 and SL2 are shown in Table 6.5 and Table 6.6.
fig 2.1 The complex structure
fig 5.1 Fluid-solid coupled model fig 5.2 equivalent fluid-solid coupled model
fig.6.1 6th deformed shape
(fluid-solid coupled model)
fig.6.2 24th deformed shape
(fluid-solid coupled model)
fig.6.3 42th deformed shape
(fluid-solid coupled model)
fig.6.4 6th deformed shape
(equivalent f-s coupled model)
fig.6.5 12th deformed shape
(equivalent f-s coupled model)
fig.6.6 30th deformed shape
Table 6.3 displacements and accelerations in the seismic load SL1 and SL2
max. displacements (mm) max. accelerations (g) Structures
SL1 SL2 SL1 SL2
Core vessel 0.0403 0.0497 0.307 0.403
Heavy water tank 0.0377 0.044 0.263 0.331
Flow guiding tank 0.22 0.270 1.059 1.295
Decay tank 0.130 0.103 0.184 0.279
Supports 0.275 0.382 2.989 4.199
Horizontal channel 0.0169 0.0201 0.124 0.158
Inlet pipe 0.437 0.510 1.460 1.746
Outlet pipe 2.881 2.377 2.333 1.928
Table 6.4 stress intensity of the components in the seismic load SL1 and SL2
max. stress intensity (MPa) structure
SL1 SL2
Core vessel 0.5891 0.7795
Heavy water tank 2.92 3.42
Flow guiding tank 31.0 37.9
Decay tank 33.2 27.5
Table 6.5 Force of the components in the seismic load SL1
structure FX (N) FY (N) FZ (N) MX (N-m) MY (N-m) MZ (N-m)
Hot neutron channelⅠ 1605.8 366.70 323.44 1.1807 28.615 71.278
Spare channel 1494.6 789.02 482.69 0.74207 58.074 130.25
Hot source channel 1263.5 887.73 405.99 3.0656 49.242 148.35
Hot neutron channelⅡ 1666.4 465.04 254.30 1.8768 22.230 82.568
Hot neutron channelⅠ 1964.0 738.76 511.70 3.3532 61.265 100.28
Cold source channel 1868.9 891.86 711.29 0.82527 95.366 153.35
Heat column channel 1338.6 437.76 335.56 2.9710 29.115 80.439
Long tangent channel 1021.0 571.97 245.26 1.1637 24.742 79.770
Hot neutron channelⅡ 1242.3 787.09 481.99 1.0944 58.876 137.30
Inlet pipe 9436.4 7783.4 3316.3 4.2462 437.14 767.70
Outlet pipe 7889.9 19574. 15455. 2.9816 6151.6 5103.1
Supports 10319. 62.738 365.25 13.809 127.01 59.353
Table 6.6 Force of the components in the seismic load SL2
structure FX(N) FY(N) FZ(N) MX(N-m) MY(N-m) MZ(N-m)
Hot neutron channelⅠ 1839.2 473.39 363.45 1.444 31.991 92.256
Spare channel 1784.5 934.82 563.04 0.8921 67.588 152.18
Hot source channel 1626.9 1024.9 507.69 3.7383 61.479 174.98
Hot neutron channelⅡ 2027.6 540.35 312.71 2.4081 27.225 99.545
Hot neutron channelⅠ 2275.6 900.19 592.22 3.9713 70.823 122.05
Cold source channel 2146.1 1134.4 802.74 1.011 107.52 194.38
Heat column channel 1562.8 530.43 395.52 3.6409 34.042 95.534
Long tangent channel 1294.0 664.01 307.87 1.3904 30.508 94.445
Hot neutron channelⅡ 1459.3 944.82 573.82 1.4050 70.145 164.40
Inlet pipe 11778. 8862.9 4142.2 5.9645 545.39 874.28
Outlet pipe 6270.9 16546. 12176. 3.5681 4812.5 4300.1
7. CONCLUSIONS
(1) The seismic response analysis of CARR reactor complex is performed in ANASYS. At first, a 3D fluid-solid coupling analysis model is built. Then, natural characteristic of the structure is analyzed in modal analysis method. The last, a 3D equivalent fluid-solid coupled model is built to perform the seismic response analysis.
(2) The calculational results of the seismic response analysis have obtained the most stress intensity and forces of each component in the seismic load SL1 and SL2. The results will provide seismic loads for various components stress analysis and evaluation.
REFERENCES
[1] “China advanced research reactor feasibility investigation report”, No. CARR·KYB·03-01, Reactor Engineering Research & Design Department, CIAE, 1996.10.
[2] ZHANG Ying, LANG Ruifeng, “CARR Preliminary Design – CARR Reactor Complex Preliminary Design”, Reactor Engineering Research & Design Department, CIAE, 1999.6.
[3] WANG Jiachun, FU Jiyang, “CARR Engineering Floor Spectrum and Structural Force Computation”, No. CARR·CA001-1MEC0010, Institute of Nuclear and New Energy Technology, Tsinghua University, 2000.10. [4] “ANSYS theory manual” ANSYS Inc.
Fig 6.7 Max. stress intensity of the structure in the seismic load SL1